| Param | Original file | Final file |
|---|---|---|
| Filename | modeM0/AS1G05_083T02_9000000498_03899cztM0_level2.evt | modeM0/AS1G05_083T02_9000000498_03899cztM0_level2_quad_clean.evt |
| Size (bytes) | 481,795,200 | 95,794,560 |
| Size | 459.5 MB | 91.4 MB |
| Events in quadrant A | 3,627,560 | 607,281 |
| Events in quadrant B | 3,923,416 | 606,321 |
| Events in quadrant C | 3,179,923 | 596,312 |
| Events in quadrant D | 3,363,042 | 581,819 |
| Mode M9 | |||
|---|---|---|---|
| Quadrant | BADHDUFLAG | Total packets | Discarded packets |
| A | 0 | 2 | 0 |
| B | 0 | 2 | 0 |
| C | 0 | 2 | 0 |
| D | 0 | 2 | 0 |
| Mode SS | |||
|---|---|---|---|
| Quadrant | BADHDUFLAG | Total packets | Discarded packets |
| A | 0 | 148 | 0 |
| B | 0 | 148 | 0 |
| C | 0 | 148 | 0 |
| D | 0 | 148 | 0 |
| Mode M0 | |||
|---|---|---|---|
| Quadrant | BADHDUFLAG | Total packets | Discarded packets |
| A | 0 | 15890 | 2 |
| B | 0 | 16471 | 1 |
| C | 0 | 15045 | 1 |
| D | 0 | 15582 | 1 |
| Quadrant | Total seconds | Saturated seconds | Saturation percentage |
|---|---|---|---|
| A | 7324 | 128 | 1.747679% |
| B | 7324 | 113 | 1.542873% |
| C | 7299 | 59 | 0.808330% |
| D | 7324 | 95 | 1.297105% |
Noise dominated data is calculated using 1-second bins in cleaned event files. If a bin has >2000 counts, and if more than 50% of those come from <1% of pixels, then it is considered to be noise-dominated and hence unusable.
| Quadrant | # 1 sec bins | Bins with >0 counts | Bins with >2000 counts | High rate bins dominated by noise | Noise dominated (total time) | Noise dominated (detector-on time) | Marked lightcurve |
|---|---|---|---|---|---|---|---|
| A | 7533 | 7323 | 33 | 33 | 0.44% | 0.45% | 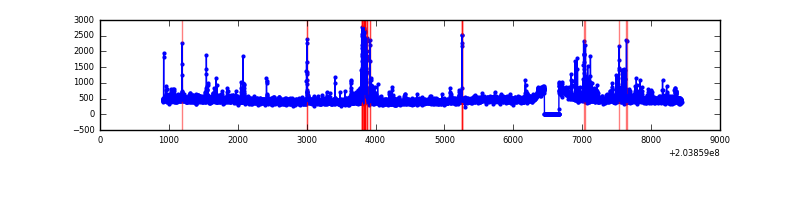 |
| B | 7533 | 7323 | 34 | 34 | 0.45% | 0.46% | 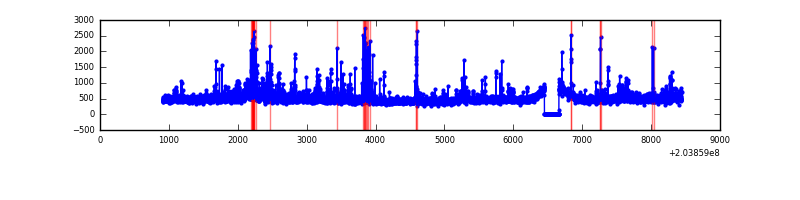 |
| C | 7533 | 7298 | 8 | 8 | 0.11% | 0.11% | 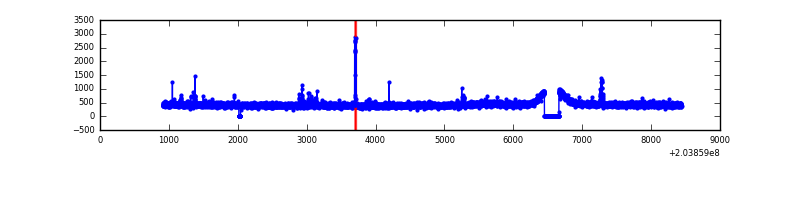 |
| D | 7533 | 7323 | 17 | 17 | 0.23% | 0.23% | 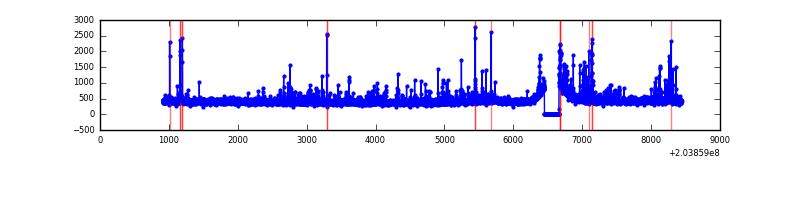 |
Top three noisy pixels from each quadrant. If the there are fewer than three noisy pixels in the level2.evt file, extra rows are filled as -1
| Pixel properties | Quadrant properties | ||||||
|---|---|---|---|---|---|---|---|
| Quadrant | DetID | PixID | Counts | Sigma | Mean | Median | Sigma |
| A | 2 | 79 | 113973 | 666.79 | 821 | 802 | 169.7 |
| A | 0 | 50 | 106638 | 623.57 | 821 | 802 | 169.7 |
| A | 0 | 118 | 103056 | 602.47 | 821 | 802 | 169.7 |
| B | 15 | 204 | 299130 | 1855.52 | 826 | 806 | 160.8 |
| B | 10 | 16 | 209668 | 1299.08 | 826 | 806 | 160.8 |
| B | 7 | 221 | 137817 | 852.18 | 826 | 806 | 160.8 |
| C | 12 | 4 | 32490 | 170.86 | 795 | 796 | 185.5 |
| C | 7 | 222 | 22812 | 118.68 | 795 | 796 | 185.5 |
| C | 2 | 53 | 11554 | 57.99 | 795 | 796 | 185.5 |
| D | 10 | 246 | 115130 | 596.51 | 795 | 771 | 191.7 |
| D | 4 | 95 | 52300 | 268.78 | 795 | 771 | 191.7 |
| D | 2 | 232 | 43600 | 223.4 | 795 | 771 | 191.7 |
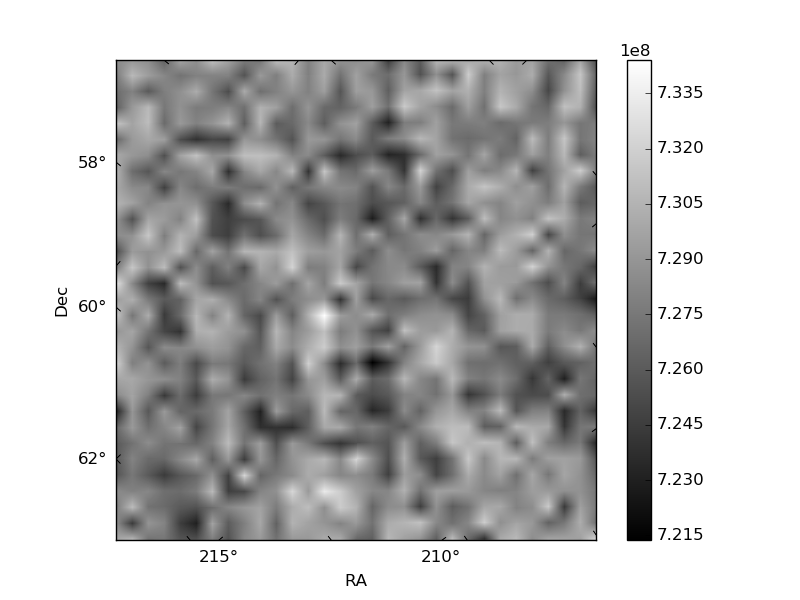
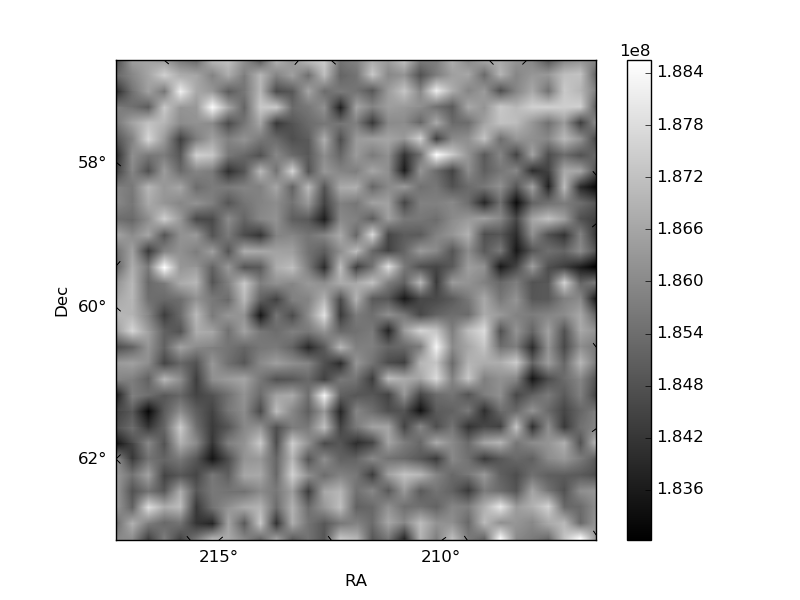
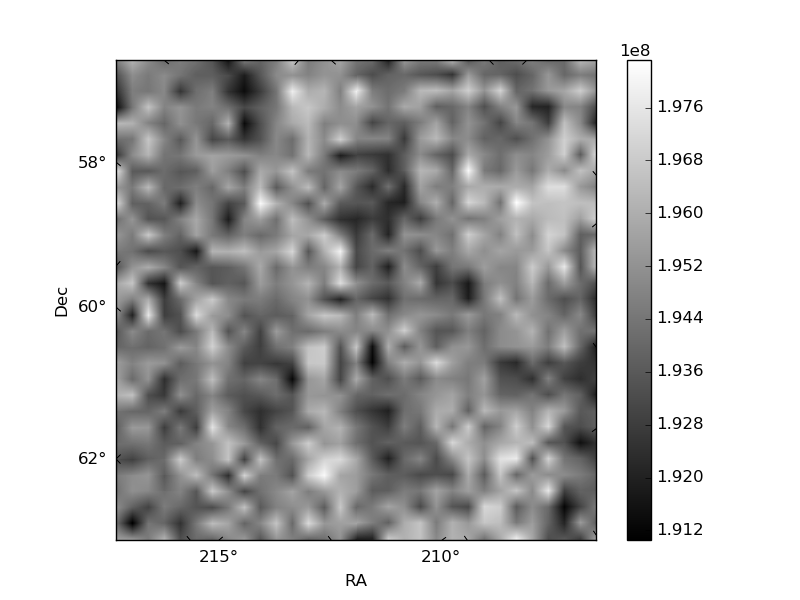
Histogram calculated using DETX and DETY for each event in the final _common_clean file
| Quadrant A | 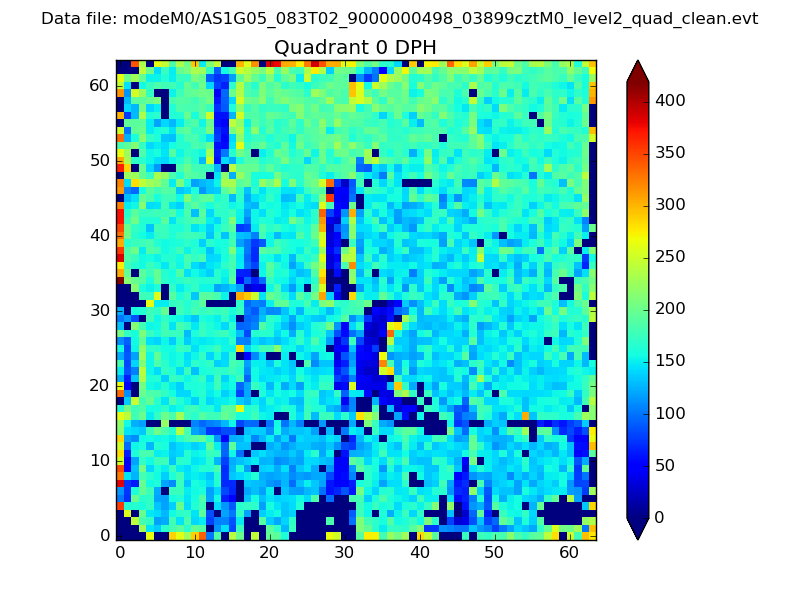 |
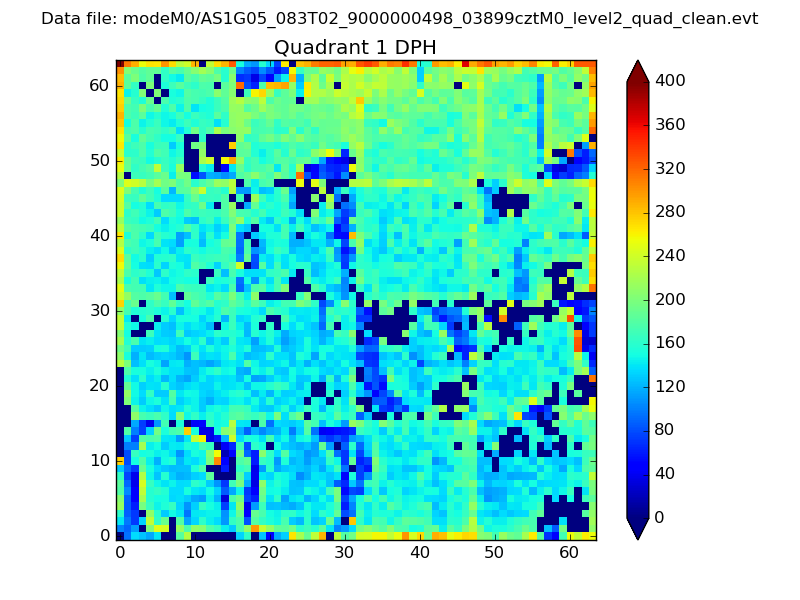 |
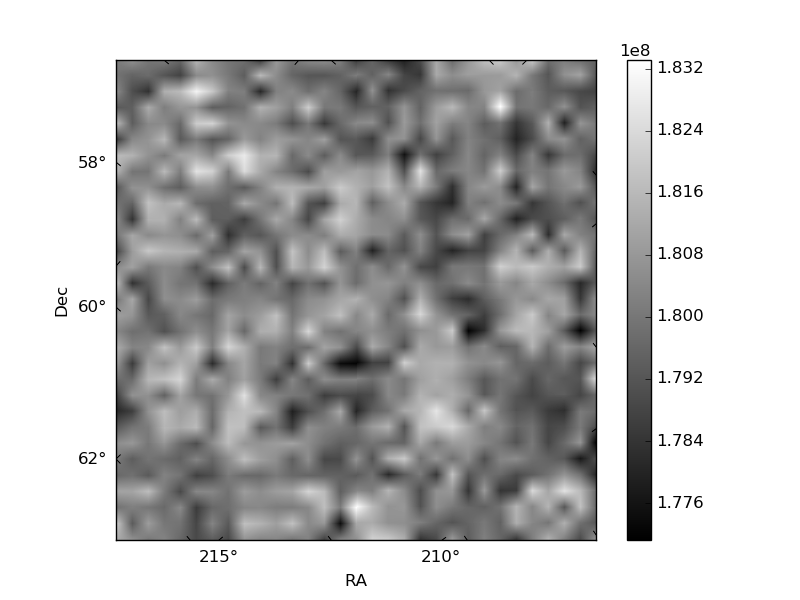
Quadrant B |
|---|---|---|---|
| Quadrant D | 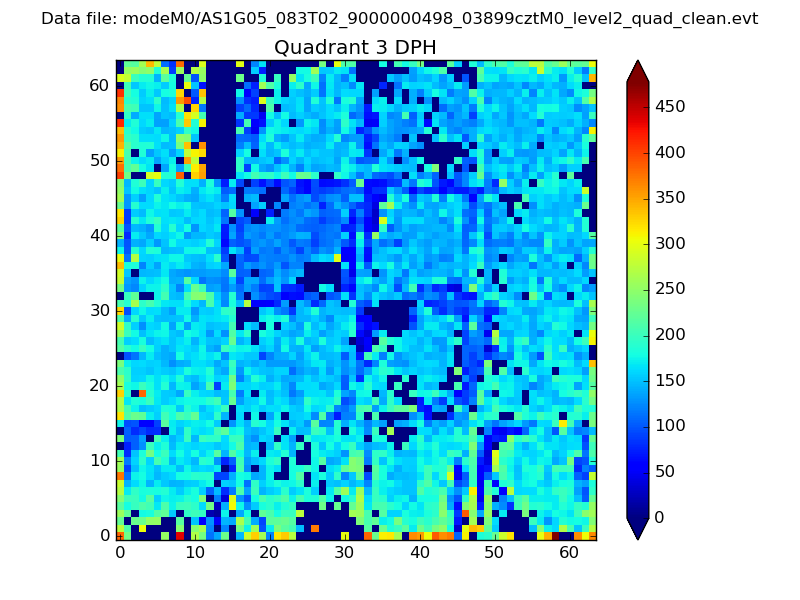 |
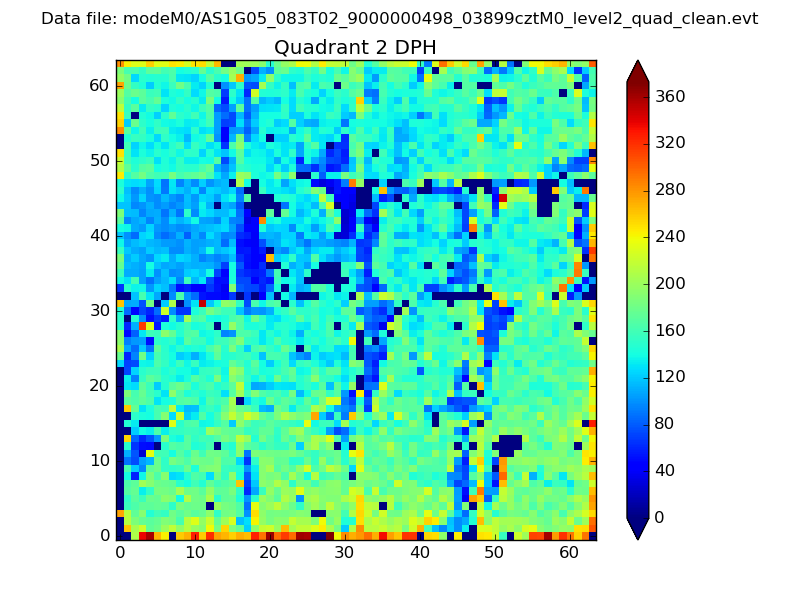 |
Quadrant C |
| Plot type | Count rate plots | Images |
|---|---|---|
| Comparison with Poisson distribution Blue bars denote a histogram of data divided into 1 sec bins. Red curve is a Poisson curve with rate = median count rate of data. |
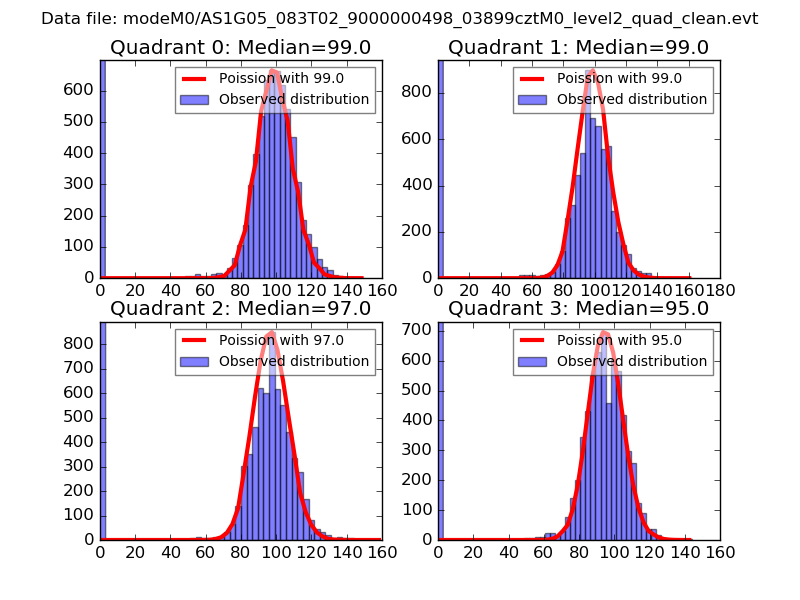 |
 |
| Quadrant-wise count rates Data is divided into 100 sec bins |
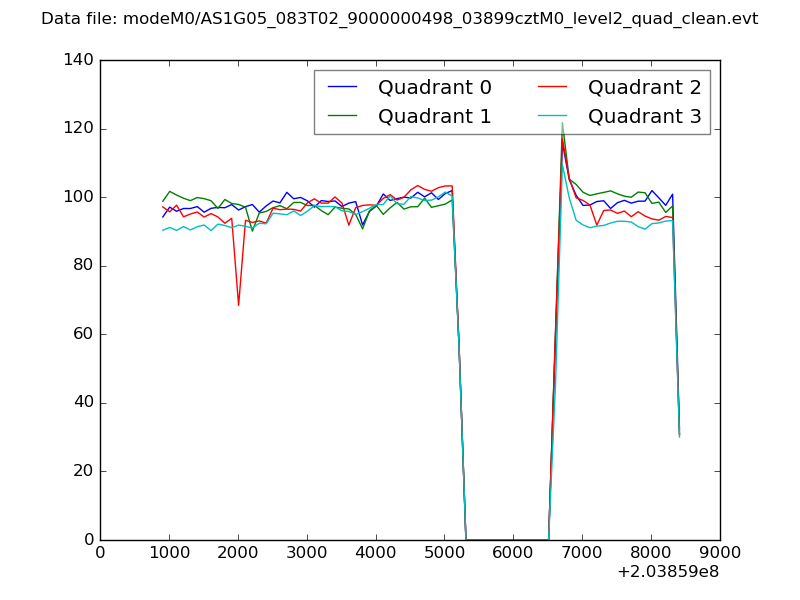 |
|
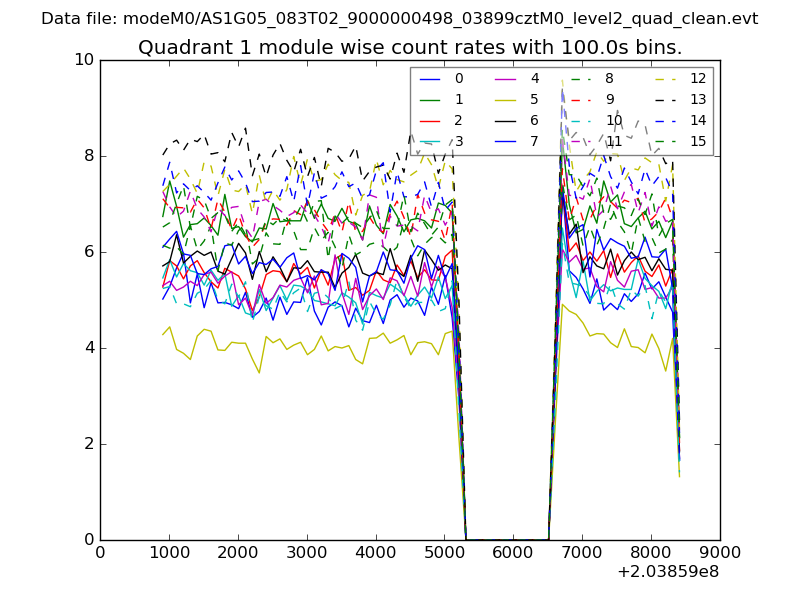
| Module-wise count rates for Quadrant A Data is divided into 100 sec bins |
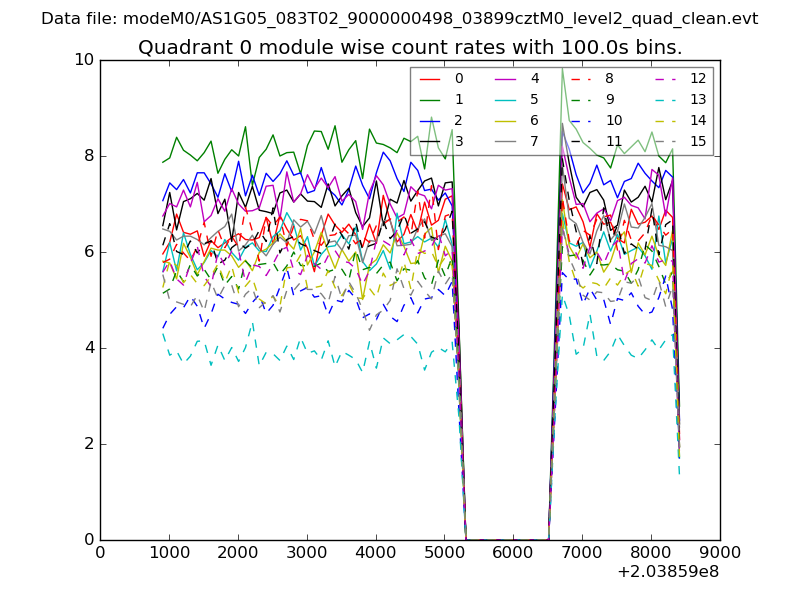 |
 |
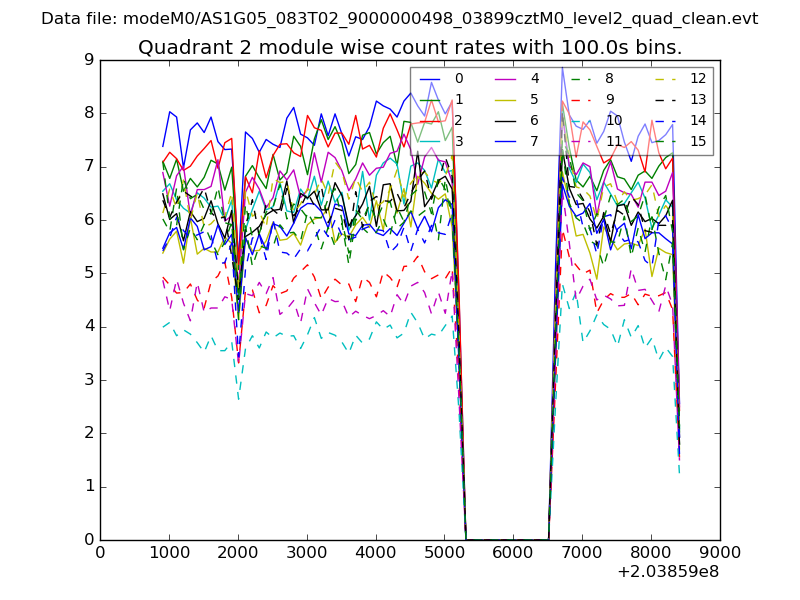
| Module-wise count rates for Quadrant B Data is divided into 100 sec bins |
 |
 |
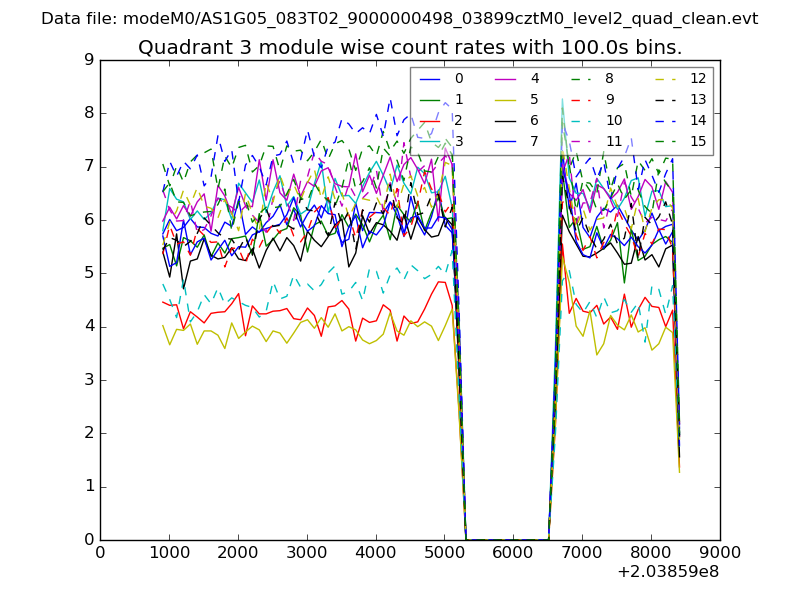
| Module-wise count rates for Quadrant C Data is divided into 100 sec bins |
 |
 |
| Module-wise count rates for Quadrant D Data is divided into 100 sec bins |
 |
 |
| Parameter | Plot |
|---|---|
| CZT HV Monitor | 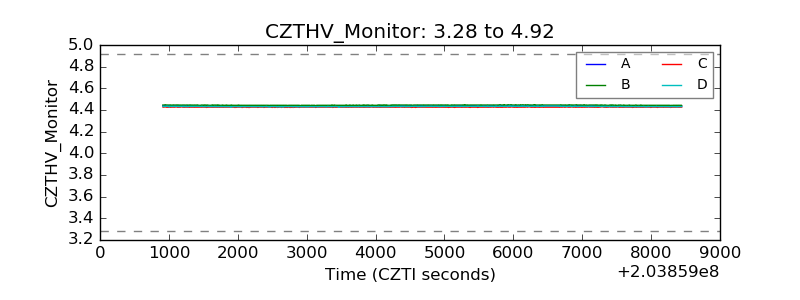 |
| D_VDD | 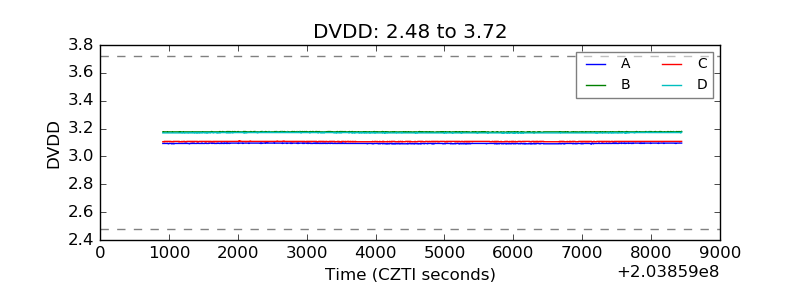 |
| Temperature 1 |  |
| Veto HV Monitor |  |
| Veto LLD | 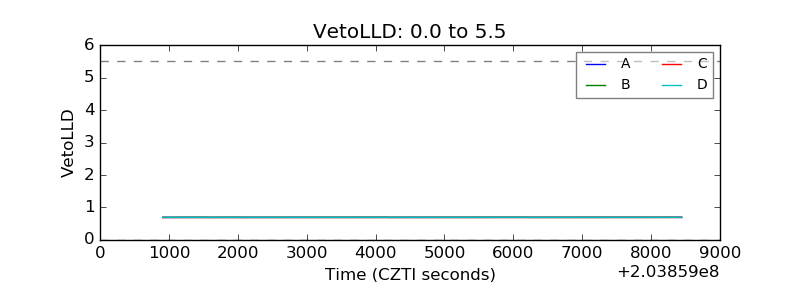 |
| Alpha Counter | 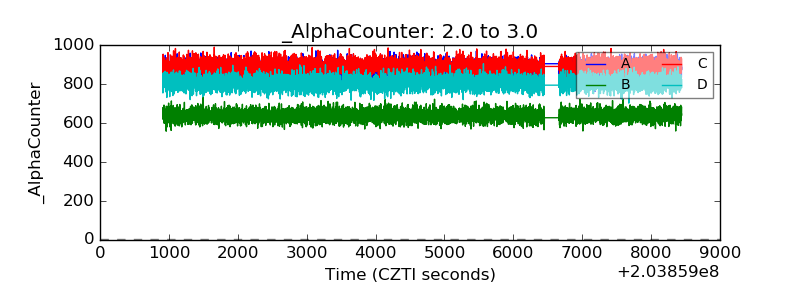 |
| _CPM_Rate | 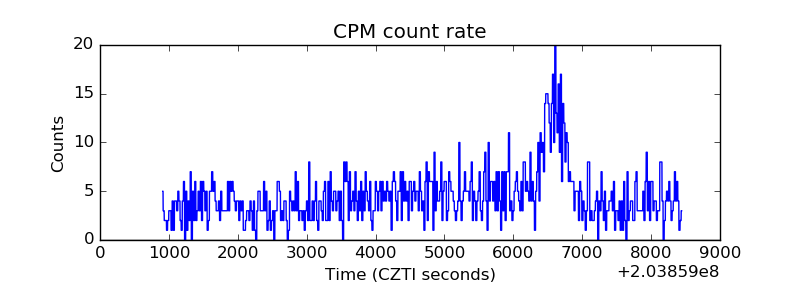 |
| CZT Counter |  |
| +2.5 Volts monitor |  |
| +5 Volts monitor |  |
| Veto Counter | 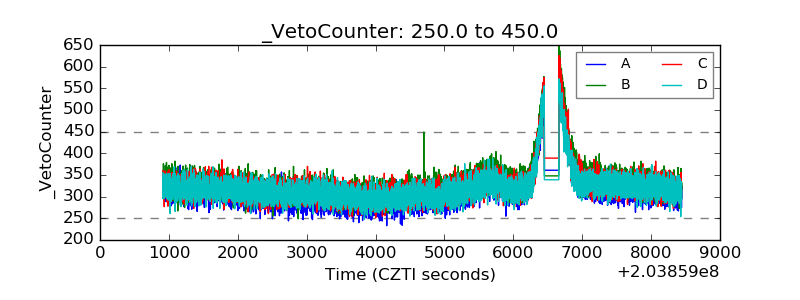 |