| Param | Original file | Final file |
|---|---|---|
| Filename | modeM0/AS1G05_083T02_9000000498_03901cztM0_level2.evt | modeM0/AS1G05_083T02_9000000498_03901cztM0_level2_quad_clean.evt |
| Size (bytes) | 257,532,480 | 55,889,280 |
| Size | 245.6 MB | 53.3 MB |
| Events in quadrant A | 1,928,720 | 361,805 |
| Events in quadrant B | 1,983,198 | 360,829 |
| Events in quadrant C | 1,659,079 | 358,433 |
| Events in quadrant D | 1,969,984 | 344,161 |
| Mode M9 | |||
|---|---|---|---|
| Quadrant | BADHDUFLAG | Total packets | Discarded packets |
| A | 0 | 2 | 0 |
| B | 0 | 2 | 0 |
| C | 0 | 2 | 0 |
| D | 0 | 2 | 0 |
| Mode SS | |||
|---|---|---|---|
| Quadrant | BADHDUFLAG | Total packets | Discarded packets |
| A | 0 | 78 | 0 |
| B | 0 | 78 | 0 |
| C | 0 | 78 | 0 |
| D | 0 | 78 | 0 |
| Mode M0 | |||
|---|---|---|---|
| Quadrant | BADHDUFLAG | Total packets | Discarded packets |
| A | 0 | 8512 | 14 |
| B | 0 | 8422 | 22 |
| C | 0 | 7889 | 3 |
| D | 0 | 8772 | 23 |
| Quadrant | Total seconds | Saturated seconds | Saturation percentage |
|---|---|---|---|
| A | 3775 | 114 | 3.019868% |
| B | 3771 | 79 | 2.094935% |
| C | 3780 | 50 | 1.322751% |
| D | 3771 | 107 | 2.837444% |
Noise dominated data is calculated using 1-second bins in cleaned event files. If a bin has >2000 counts, and if more than 50% of those come from <1% of pixels, then it is considered to be noise-dominated and hence unusable.
| Quadrant | # 1 sec bins | Bins with >0 counts | Bins with >2000 counts | High rate bins dominated by noise | Noise dominated (total time) | Noise dominated (detector-on time) | Marked lightcurve |
|---|---|---|---|---|---|---|---|
| A | 3991 | 3781 | 28 | 28 | 0.70% | 0.74% | 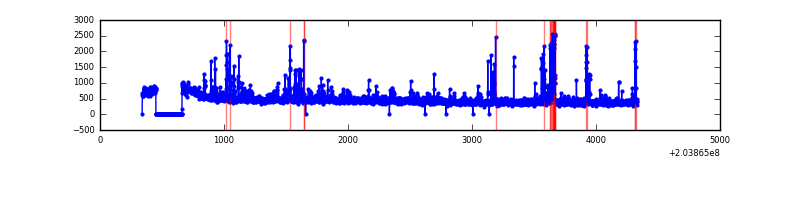 |
| B | 3991 | 3780 | 10 | 10 | 0.25% | 0.26% | 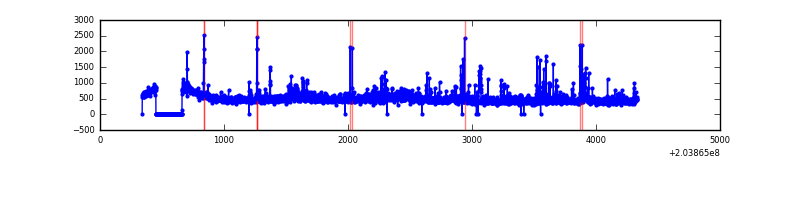 |
| C | 3991 | 3781 | 1 | 1 | 0.03% | 0.03% | 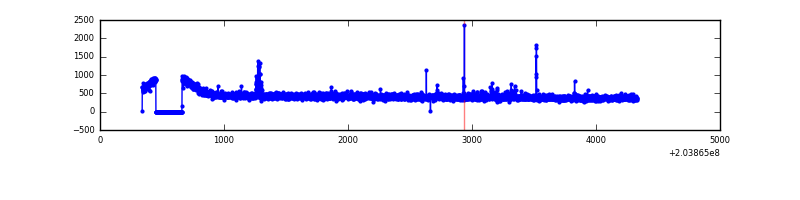 |
| D | 3990 | 3775 | 42 | 42 | 1.05% | 1.11% | 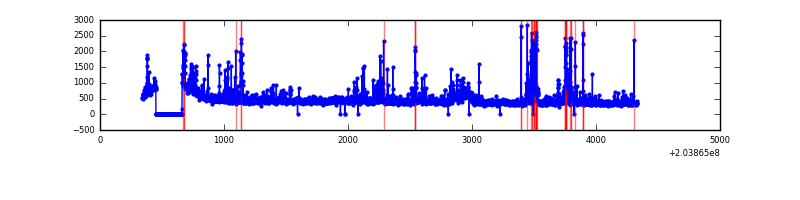 |
Top three noisy pixels from each quadrant. If the there are fewer than three noisy pixels in the level2.evt file, extra rows are filled as -1
| Pixel properties | Quadrant properties | ||||||
|---|---|---|---|---|---|---|---|
| Quadrant | DetID | PixID | Counts | Sigma | Mean | Median | Sigma |
| A | 2 | 79 | 107950 | 1228.98 | 421 | 411 | 87.5 |
| A | 0 | 50 | 72869 | 828.07 | 421 | 411 | 87.5 |
| A | 0 | 118 | 59218 | 672.06 | 421 | 411 | 87.5 |
| B | 7 | 221 | 167465 | 2017.87 | 423 | 412 | 82.8 |
| B | 15 | 204 | 57948 | 694.99 | 423 | 412 | 82.8 |
| B | 10 | 16 | 43514 | 520.64 | 423 | 412 | 82.8 |
| C | 12 | 4 | 27633 | 277.39 | 415 | 415 | 98.1 |
| C | 7 | 222 | 6046 | 57.39 | 415 | 415 | 98.1 |
| C | 13 | 61 | 3597 | 32.43 | 415 | 415 | 98.1 |
| D | 10 | 246 | 257175 | 2575.16 | 412 | 400 | 99.7 |
| D | 4 | 95 | 31049 | 307.37 | 412 | 400 | 99.7 |
| D | 2 | 232 | 29892 | 295.77 | 412 | 400 | 99.7 |
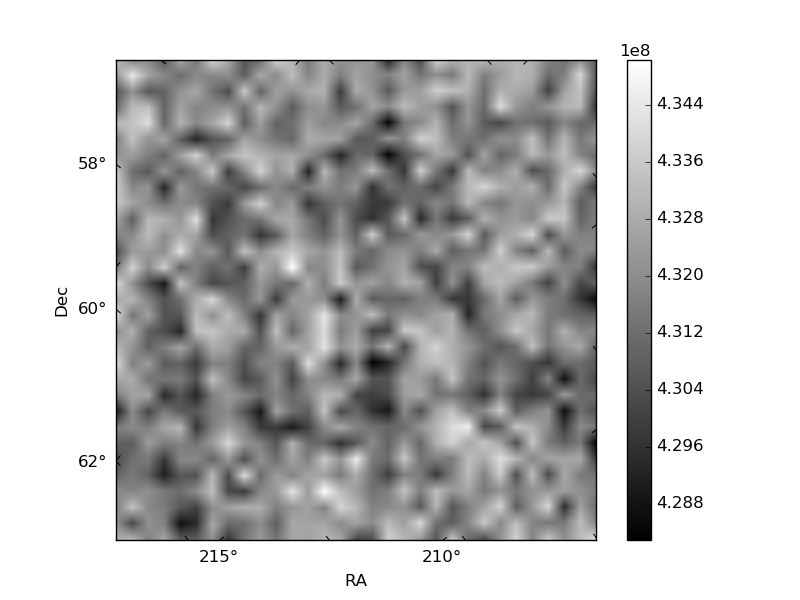
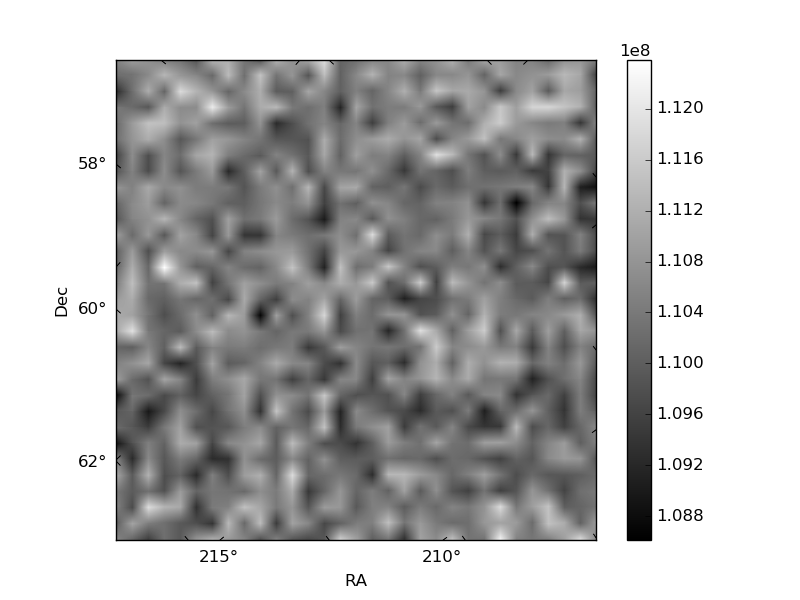
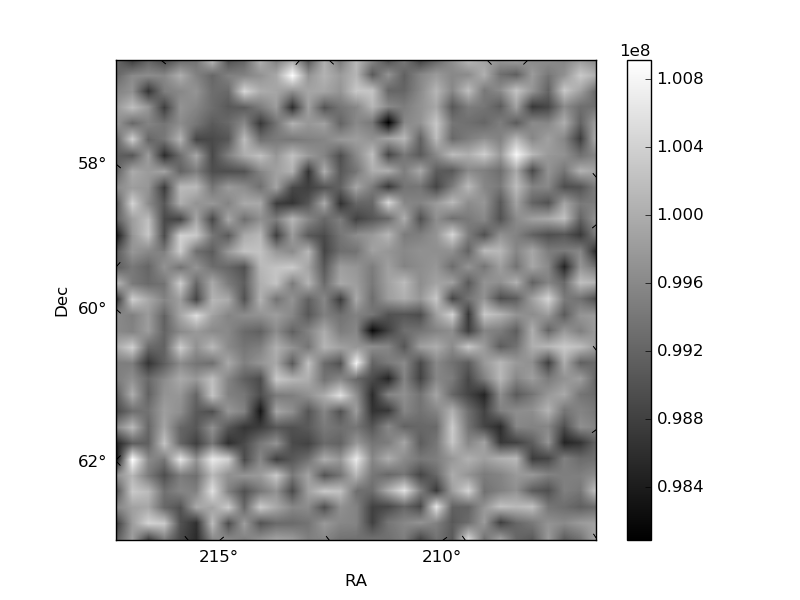
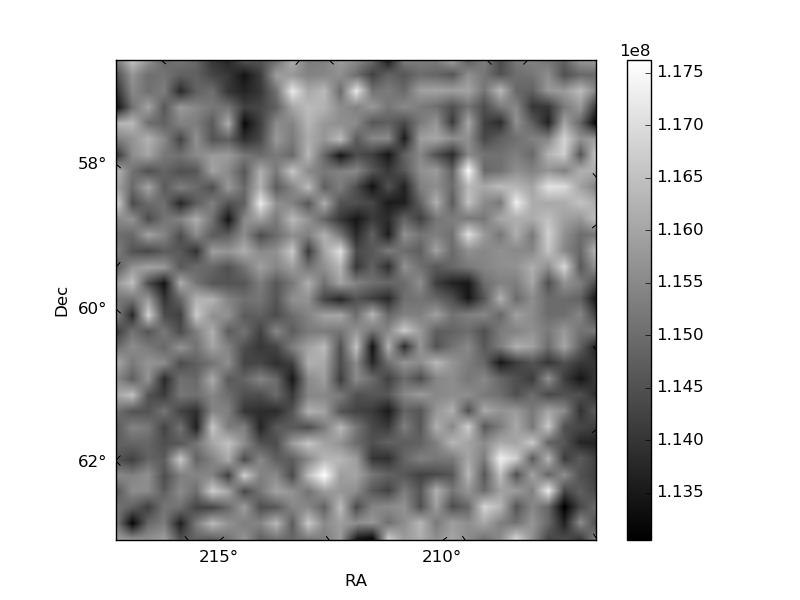
Histogram calculated using DETX and DETY for each event in the final _common_clean file
| Quadrant A | 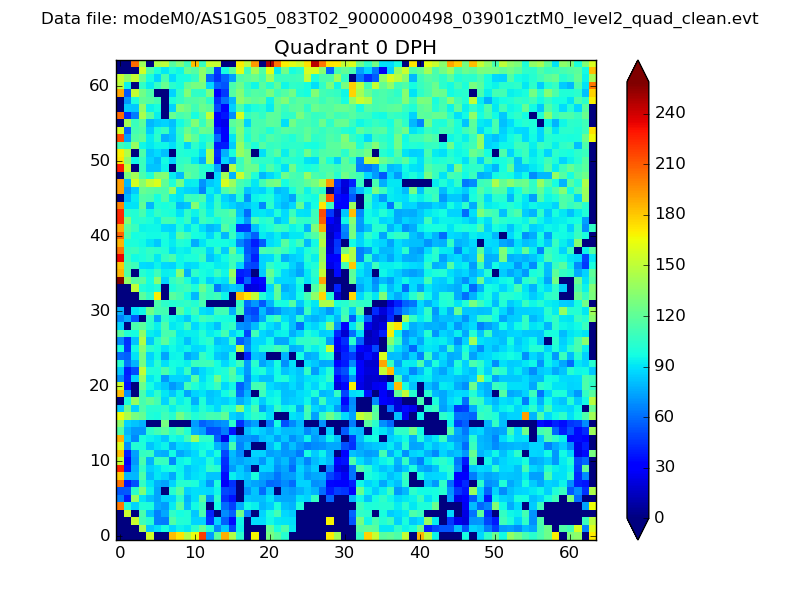 |
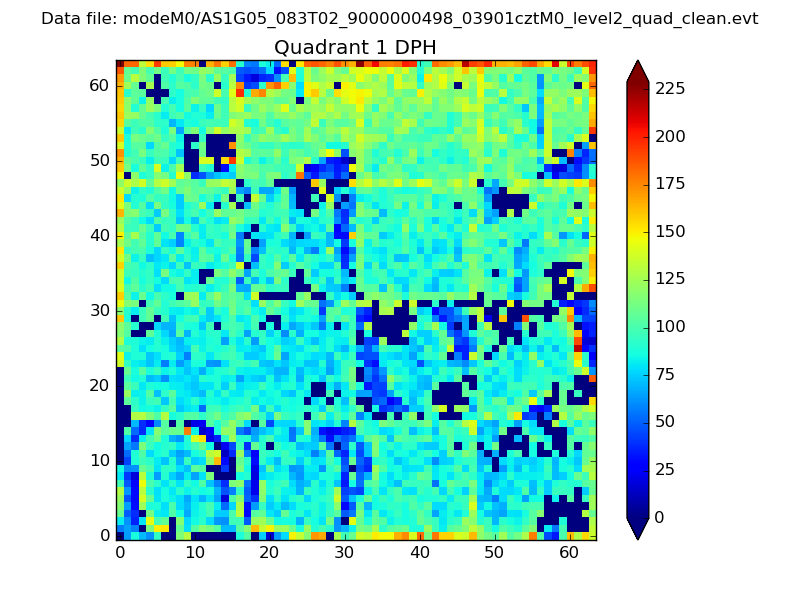 |
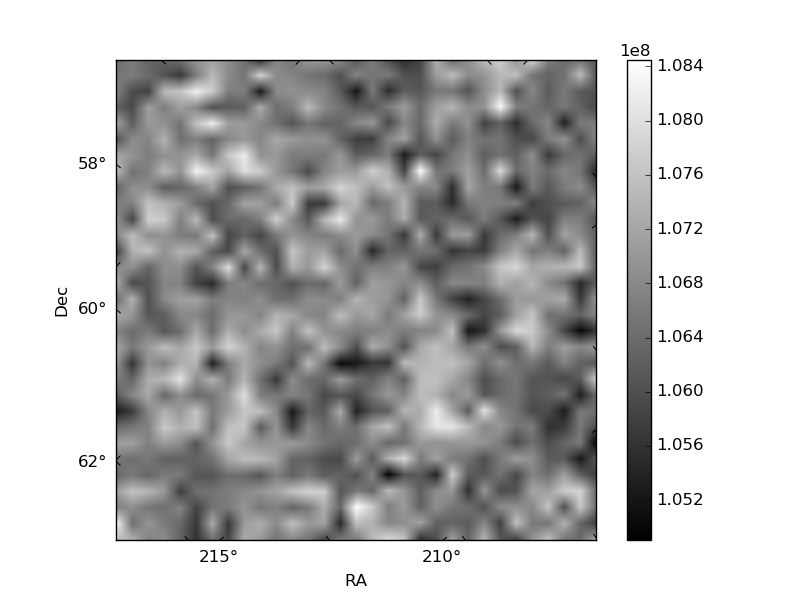
Quadrant B |
|---|---|---|---|
| Quadrant D | 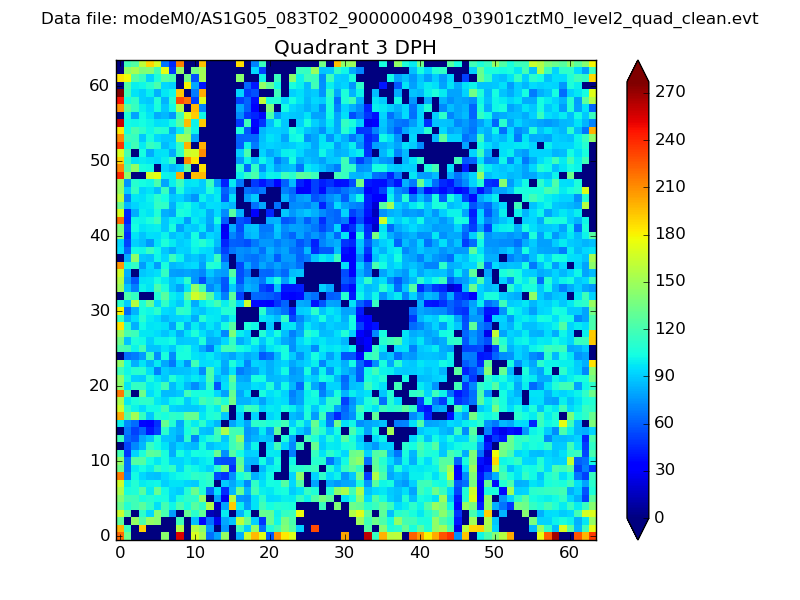 |
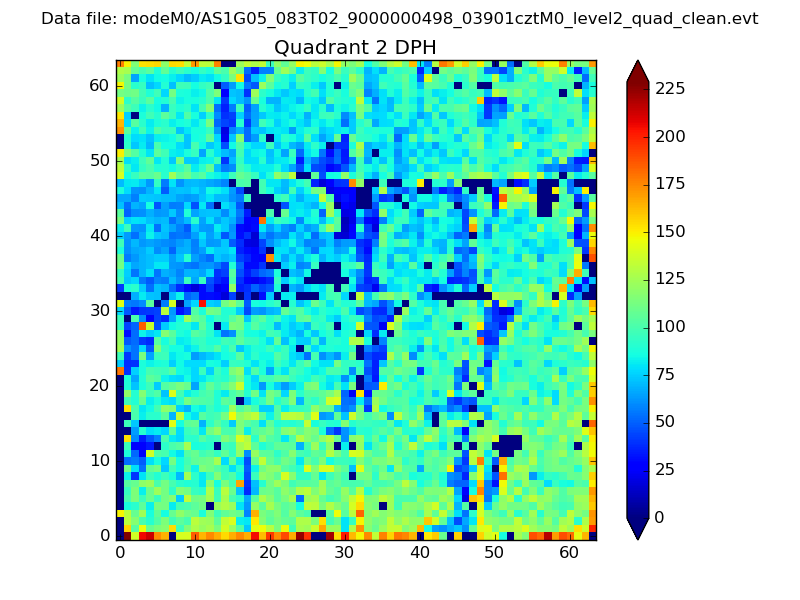 |
Quadrant C |
| Plot type | Count rate plots | Images |
|---|---|---|
| Comparison with Poisson distribution Blue bars denote a histogram of data divided into 1 sec bins. Red curve is a Poisson curve with rate = median count rate of data. |
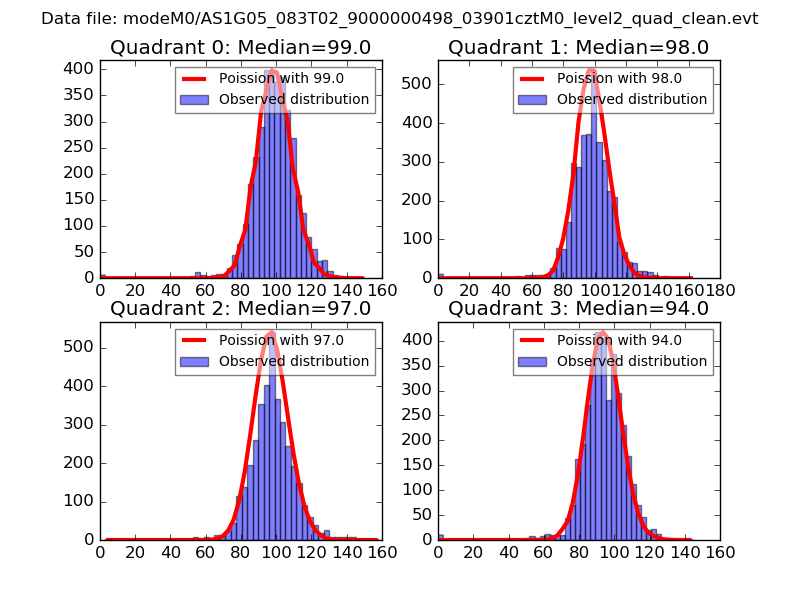 |
 |
| Quadrant-wise count rates Data is divided into 100 sec bins |
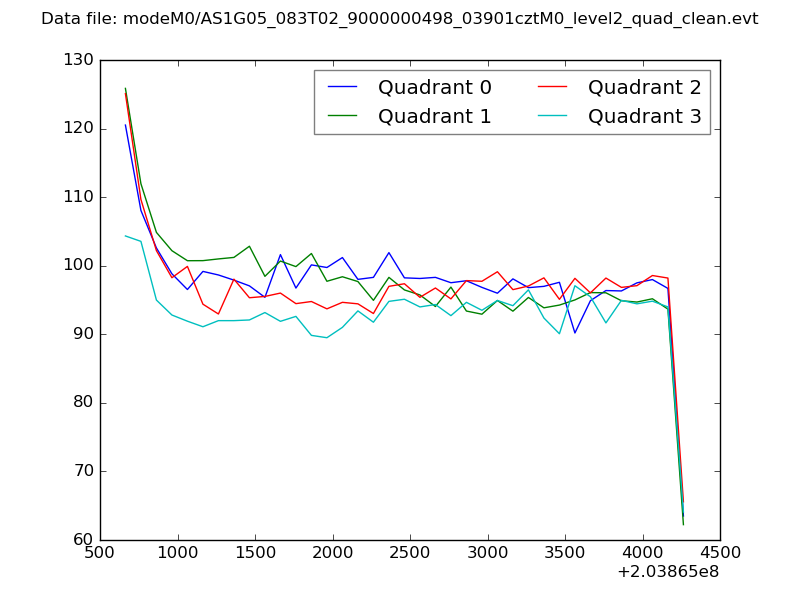 |
|
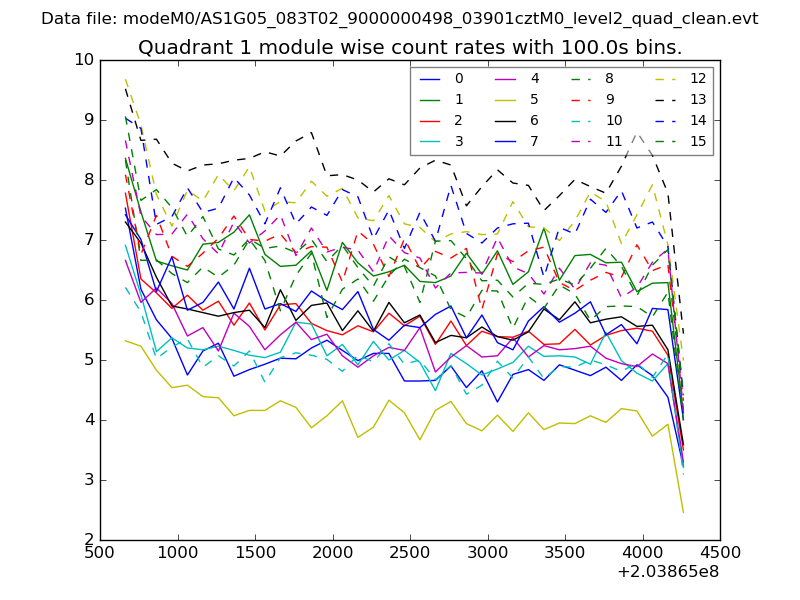
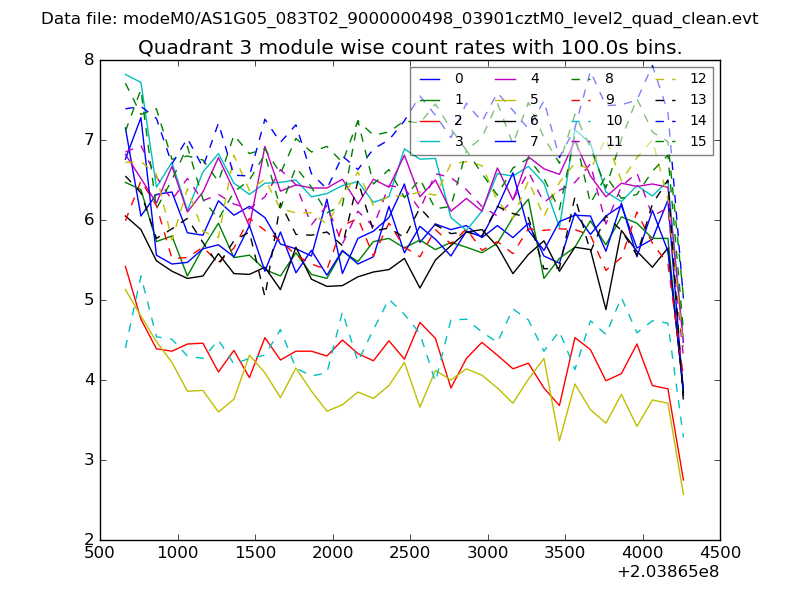
| Module-wise count rates for Quadrant A Data is divided into 100 sec bins |
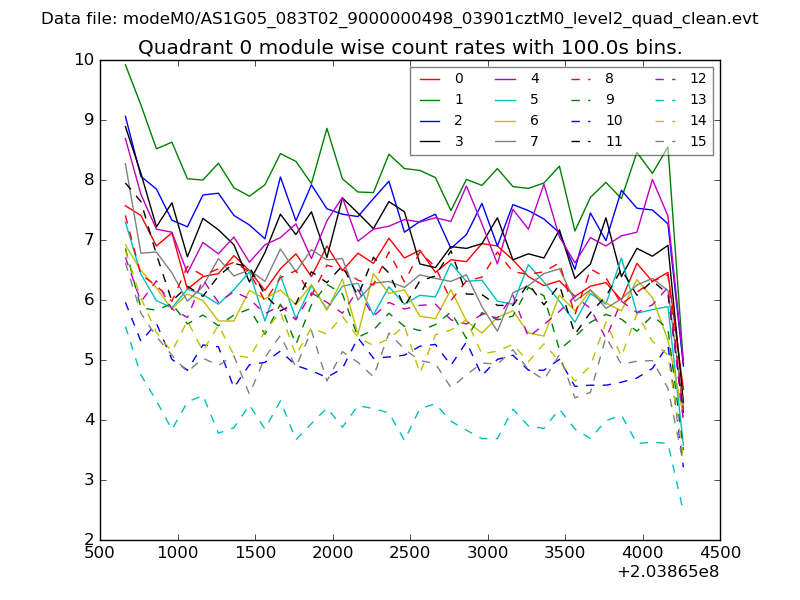 |
 |
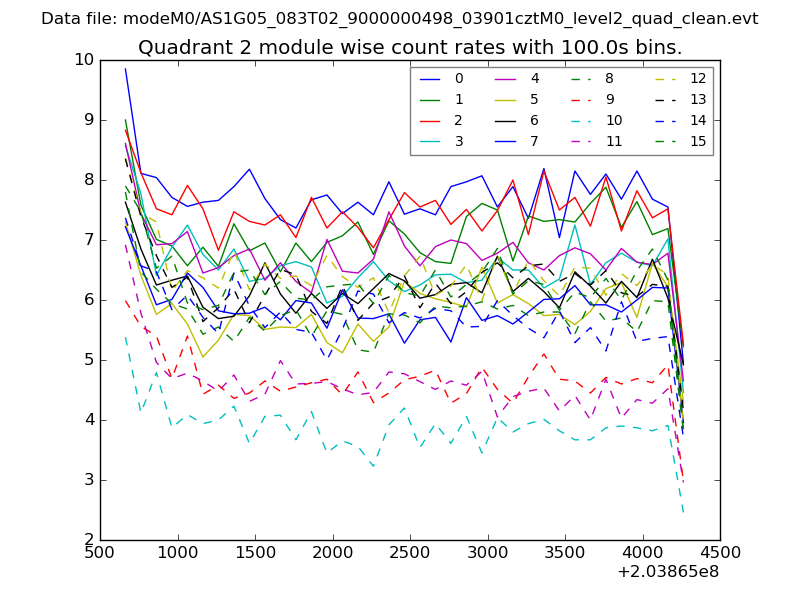
| Module-wise count rates for Quadrant B Data is divided into 100 sec bins |
 |
 |
| Module-wise count rates for Quadrant C Data is divided into 100 sec bins |
 |
 |
| Module-wise count rates for Quadrant D Data is divided into 100 sec bins |
 |
 |
| Parameter | Plot |
|---|---|
| CZT HV Monitor | 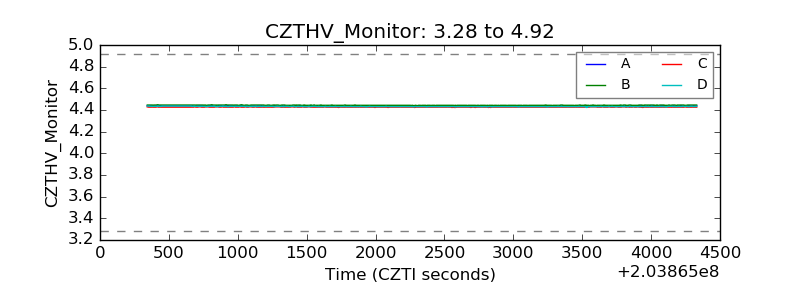 |
| D_VDD | 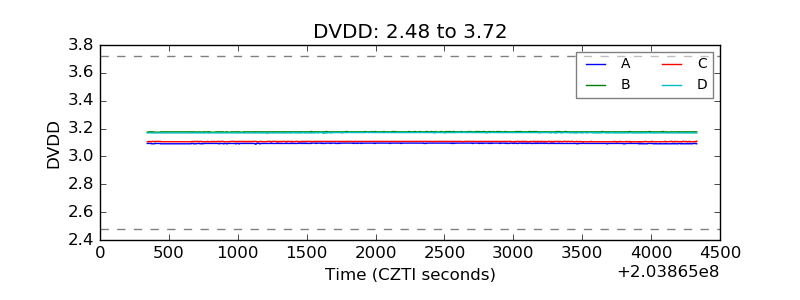 |
| Temperature 1 | 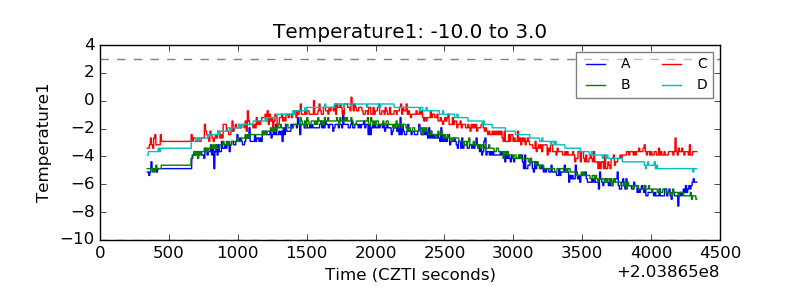 |
| Veto HV Monitor | 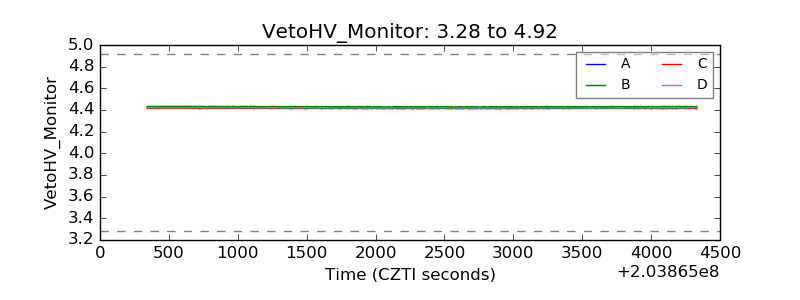 |
| Veto LLD | 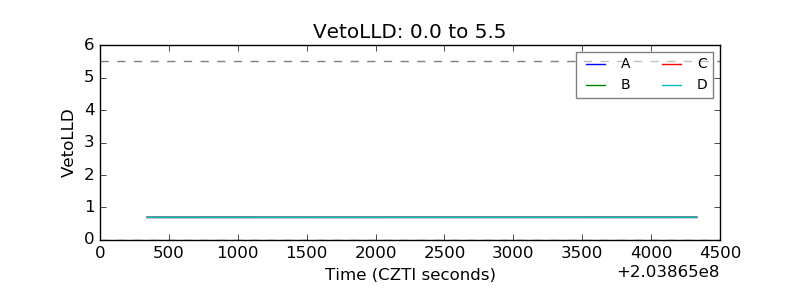 |
| Alpha Counter |  |
| _CPM_Rate | 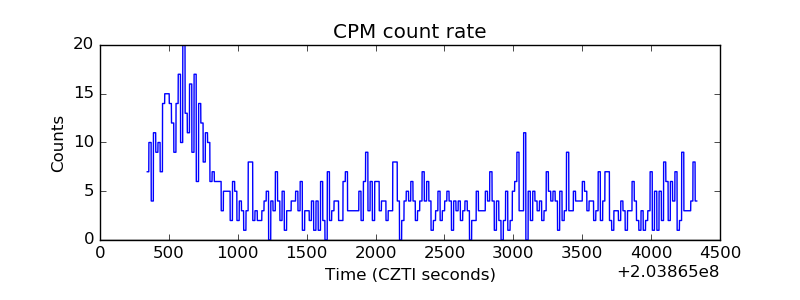 |
| CZT Counter | 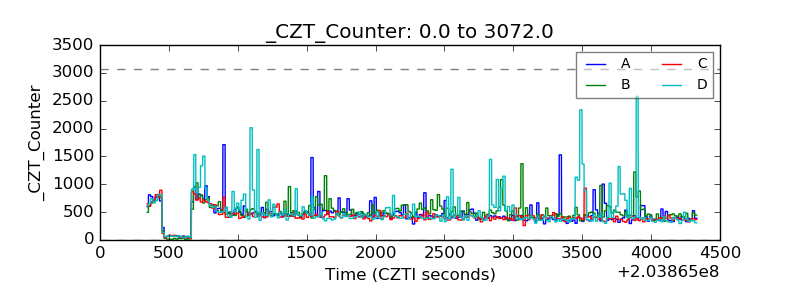 |
| +2.5 Volts monitor |  |
| +5 Volts monitor |  |
| Veto Counter | 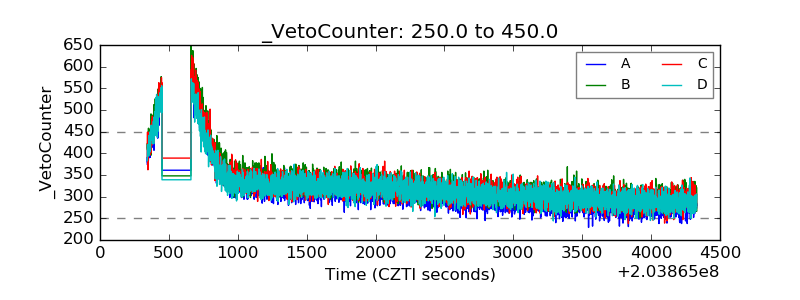 |