| Param | Original file | Final file |
|---|---|---|
| Filename | modeM0/AS1G05_083T02_9000000498_03902cztM0_level2.evt | modeM0/AS1G05_083T02_9000000498_03902cztM0_level2_quad_clean.evt |
| Size (bytes) | 350,412,480 | 53,392,320 |
| Size | 334.2 MB | 50.9 MB |
| Events in quadrant A | 2,397,307 | 328,240 |
| Events in quadrant B | 3,747,996 | 309,151 |
| Events in quadrant C | 2,046,514 | 329,210 |
| Events in quadrant D | 2,100,391 | 319,672 |
| Mode M9 | |||
|---|---|---|---|
| Quadrant | BADHDUFLAG | Total packets | Discarded packets |
| A | 0 | 4 | 0 |
| B | 0 | 4 | 0 |
| C | 0 | 4 | 0 |
| D | 0 | 4 | 0 |
| Mode SS | |||
|---|---|---|---|
| Quadrant | BADHDUFLAG | Total packets | Discarded packets |
| A | 0 | 96 | 0 |
| B | 0 | 96 | 0 |
| C | 0 | 96 | 0 |
| D | 0 | 96 | 0 |
| Mode M0 | |||
|---|---|---|---|
| Quadrant | BADHDUFLAG | Total packets | Discarded packets |
| A | 0 | 10324 | 1 |
| B | 0 | 14325 | 1 |
| C | 0 | 9605 | 1 |
| D | 0 | 9854 | 1 |
| Quadrant | Total seconds | Saturated seconds | Saturation percentage |
|---|---|---|---|
| A | 4697 | 104 | 2.214179% |
| B | 4697 | 401 | 8.537364% |
| C | 4697 | 55 | 1.170960% |
| D | 4697 | 69 | 1.469023% |
Noise dominated data is calculated using 1-second bins in cleaned event files. If a bin has >2000 counts, and if more than 50% of those come from <1% of pixels, then it is considered to be noise-dominated and hence unusable.
| Quadrant | # 1 sec bins | Bins with >0 counts | Bins with >2000 counts | High rate bins dominated by noise | Noise dominated (total time) | Noise dominated (detector-on time) | Marked lightcurve |
|---|---|---|---|---|---|---|---|
| A | 5127 | 4698 | 28 | 28 | 0.55% | 0.60% | 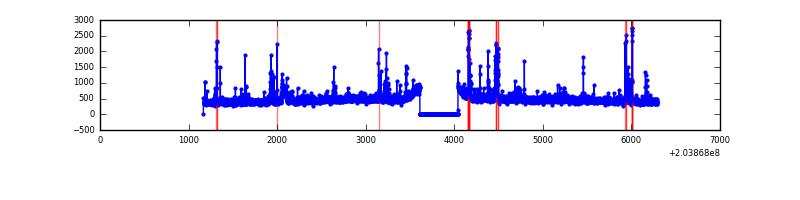 |
| B | 5126 | 4697 | 280 | 280 | 5.46% | 5.96% | 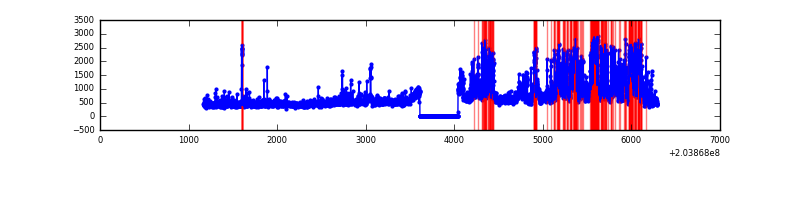 |
| C | 5126 | 4696 | 0 | 0 | 0.00% | 0.00% | 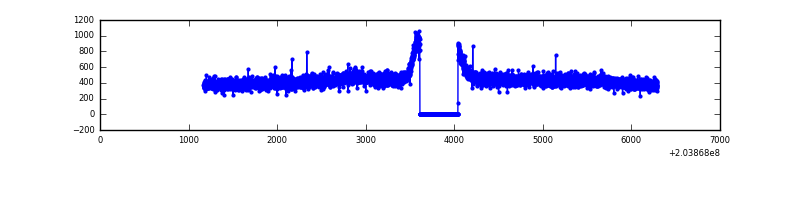 |
| D | 5127 | 4698 | 8 | 8 | 0.16% | 0.17% | 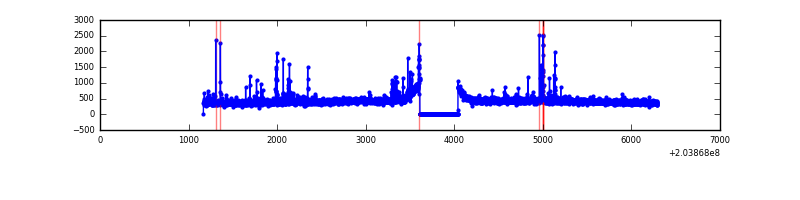 |
Top three noisy pixels from each quadrant. If the there are fewer than three noisy pixels in the level2.evt file, extra rows are filled as -1
| Pixel properties | Quadrant properties | ||||||
|---|---|---|---|---|---|---|---|
| Quadrant | DetID | PixID | Counts | Sigma | Mean | Median | Sigma |
| A | 0 | 118 | 97118 | 871.37 | 534 | 521 | 110.9 |
| A | 13 | 251 | 63986 | 572.5 | 534 | 521 | 110.9 |
| A | 8 | 15 | 62966 | 563.3 | 534 | 521 | 110.9 |
| B | 10 | 16 | 869286 | 8418.58 | 526 | 514 | 103.2 |
| B | 15 | 204 | 309307 | 2992.27 | 526 | 514 | 103.2 |
| B | 7 | 221 | 229814 | 2221.96 | 526 | 514 | 103.2 |
| C | 13 | 61 | 4482 | 31.88 | 523 | 524 | 124.1 |
| C | 12 | 4 | 2645 | 17.08 | 523 | 524 | 124.1 |
| C | 10 | 34 | 2118 | 12.84 | 523 | 524 | 124.1 |
| D | 13 | 239 | 42243 | 329.99 | 518 | 502 | 126.5 |
| D | 5 | 32 | 20047 | 154.52 | 518 | 502 | 126.5 |
| D | 13 | 248 | 17282 | 132.66 | 518 | 502 | 126.5 |
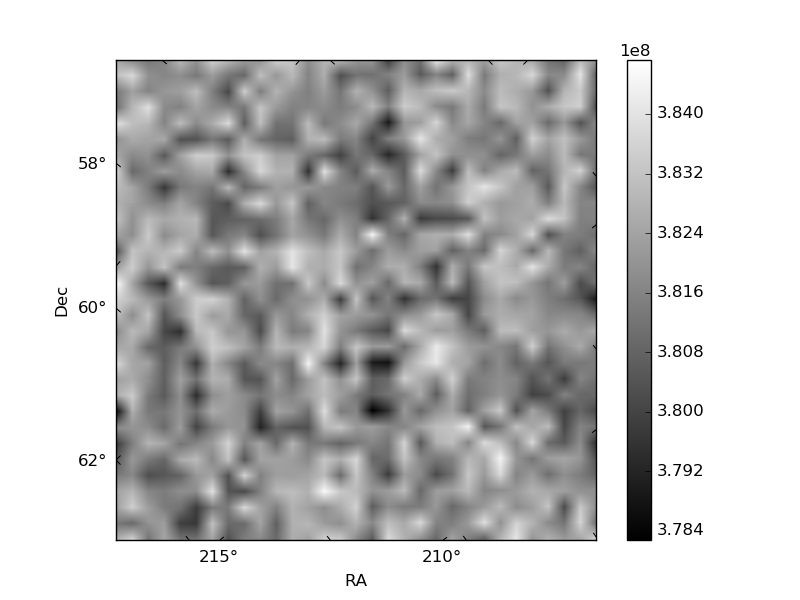
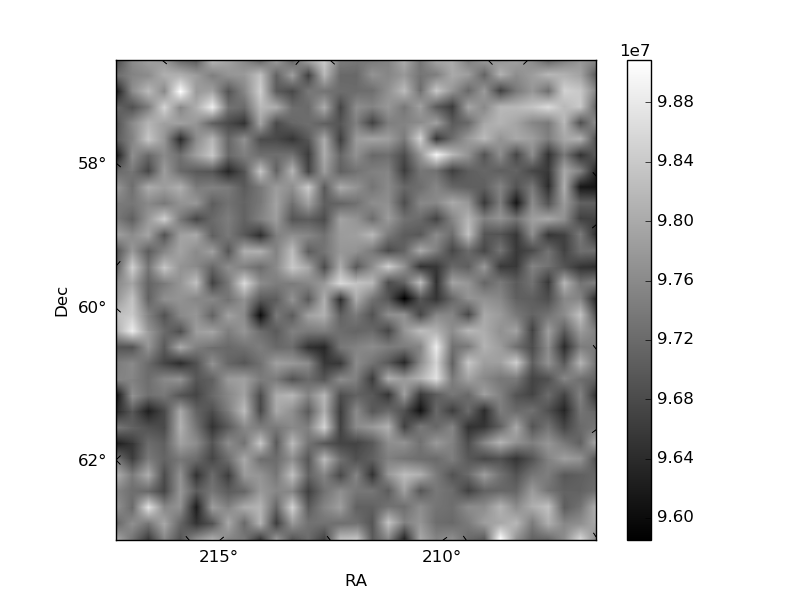
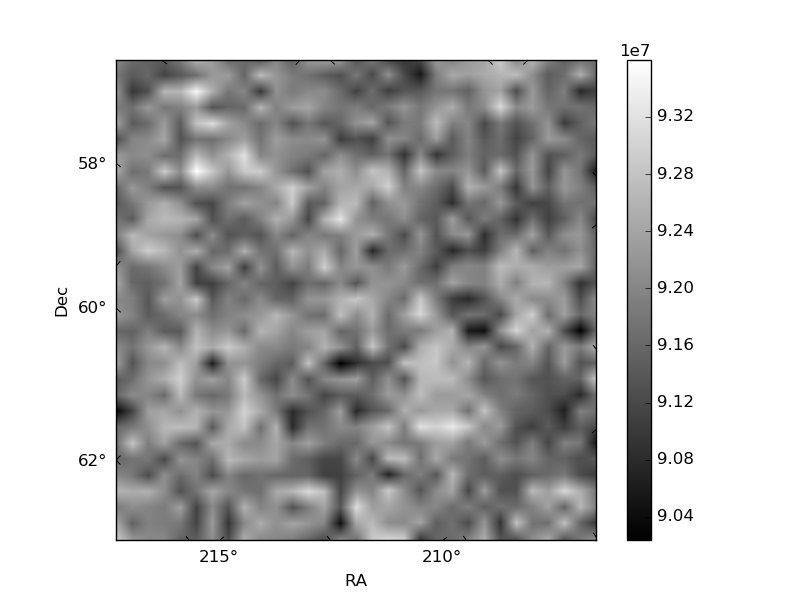
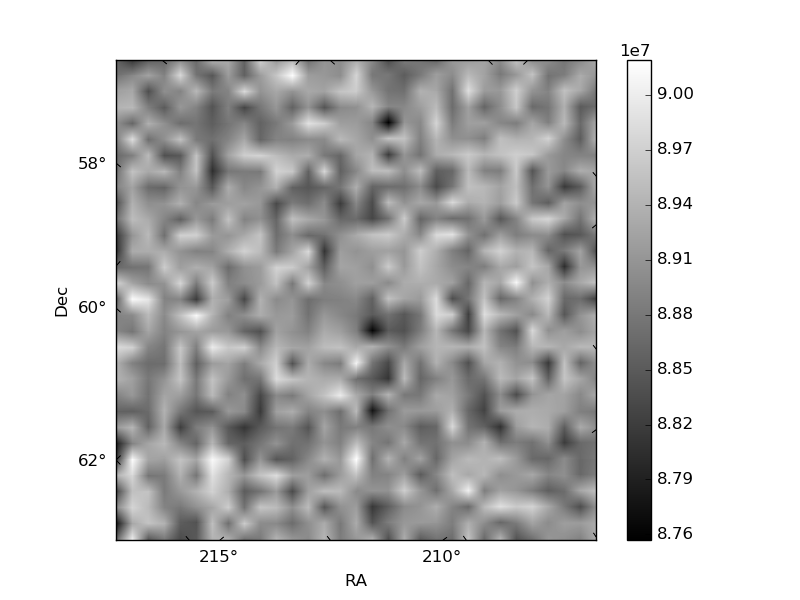
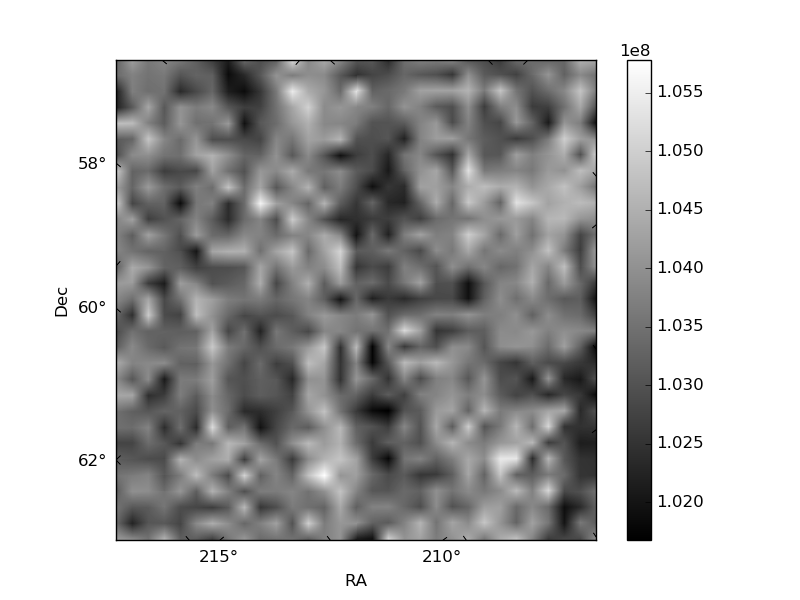
Histogram calculated using DETX and DETY for each event in the final _common_clean file
| Quadrant A | 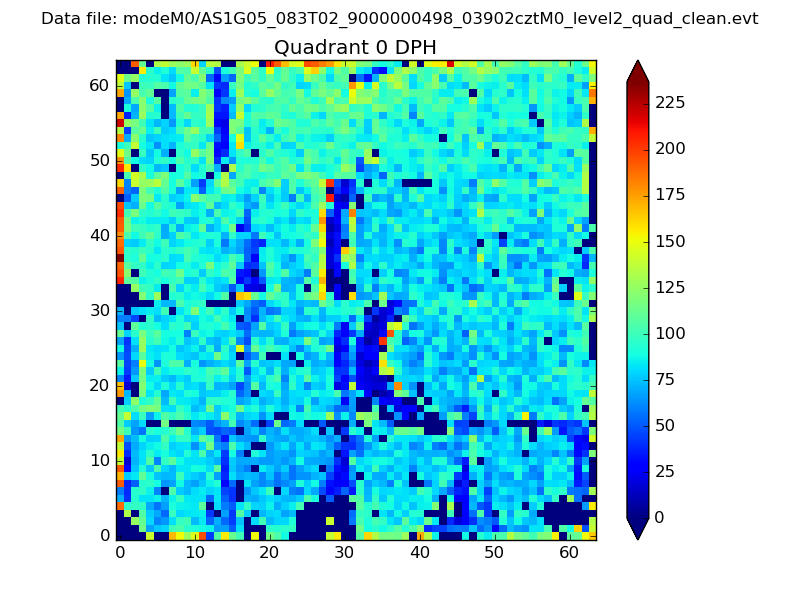 |
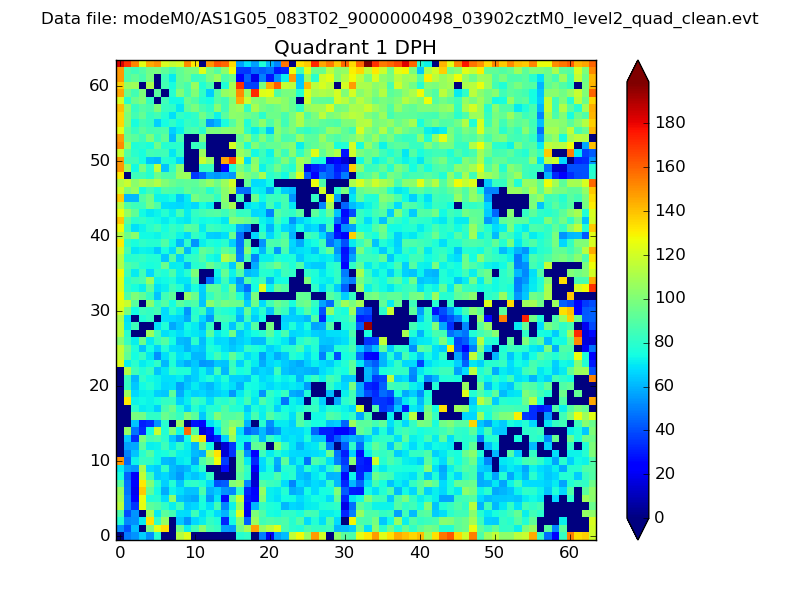 |
Quadrant B |
|---|---|---|---|
| Quadrant D | 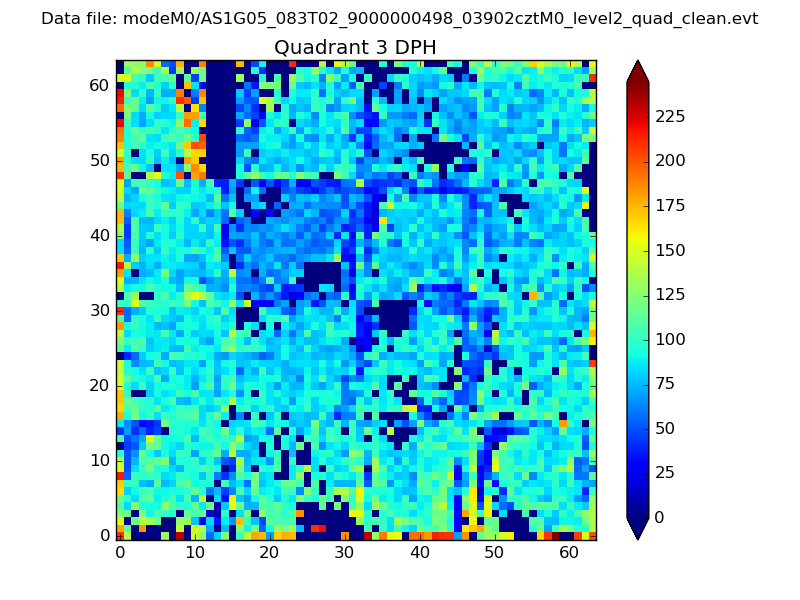 |
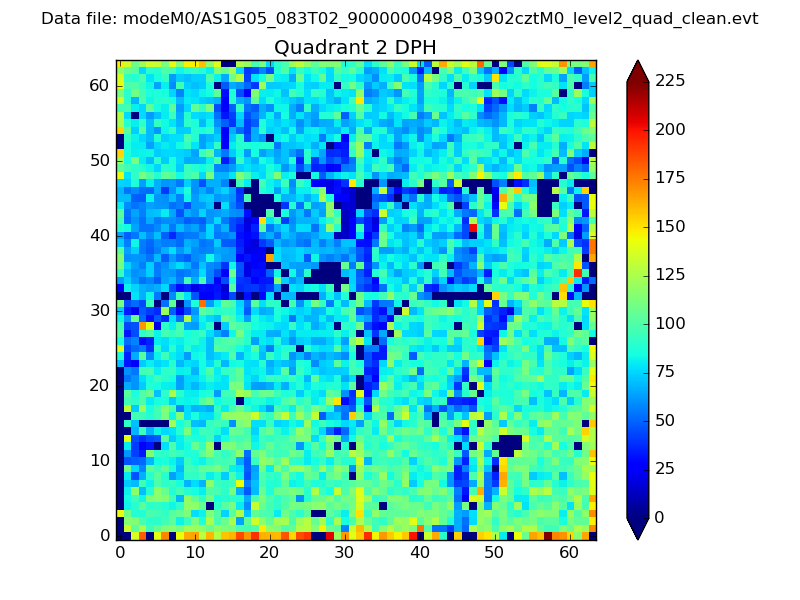 |
Quadrant C |
| Plot type | Count rate plots | Images |
|---|---|---|
| Comparison with Poisson distribution Blue bars denote a histogram of data divided into 1 sec bins. Red curve is a Poisson curve with rate = median count rate of data. |
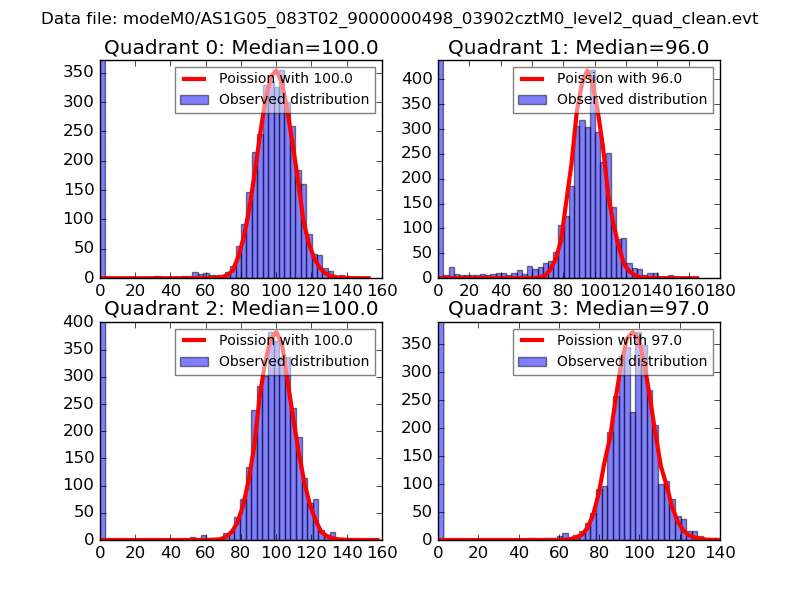 |
 |
| Quadrant-wise count rates Data is divided into 100 sec bins |
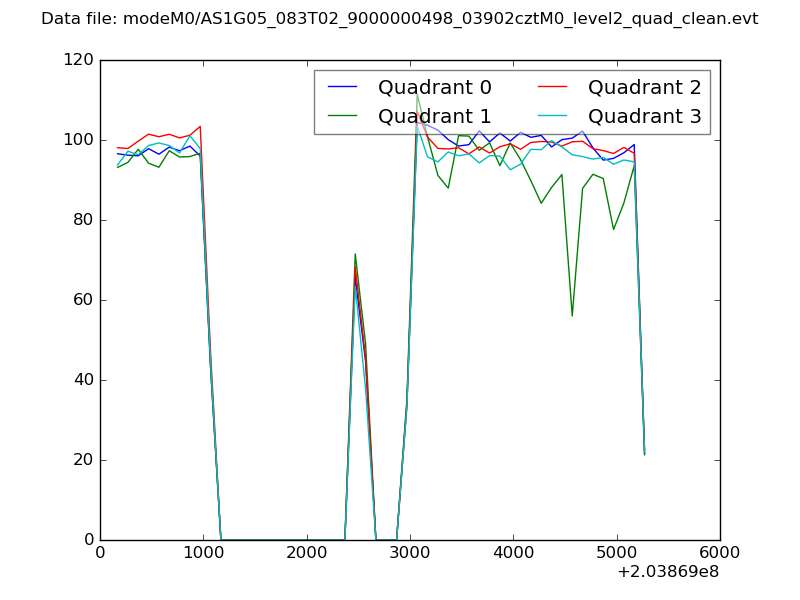 |
|
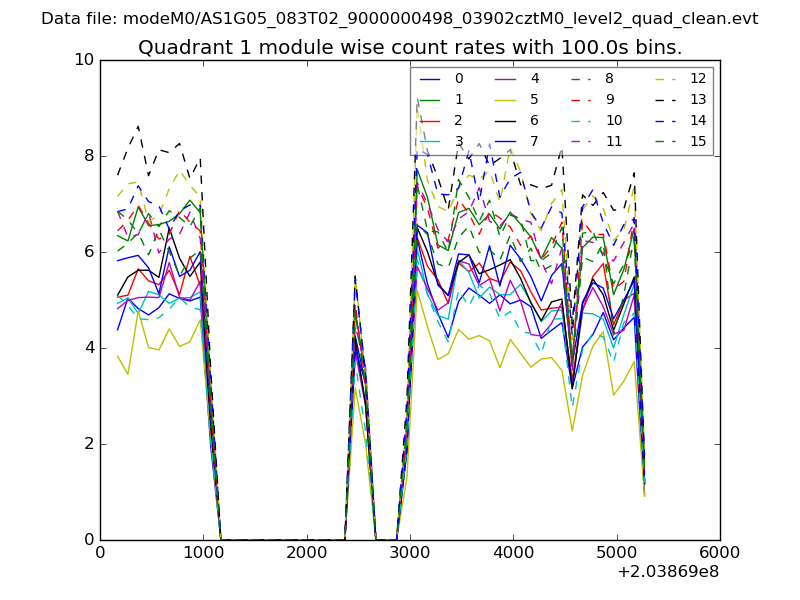
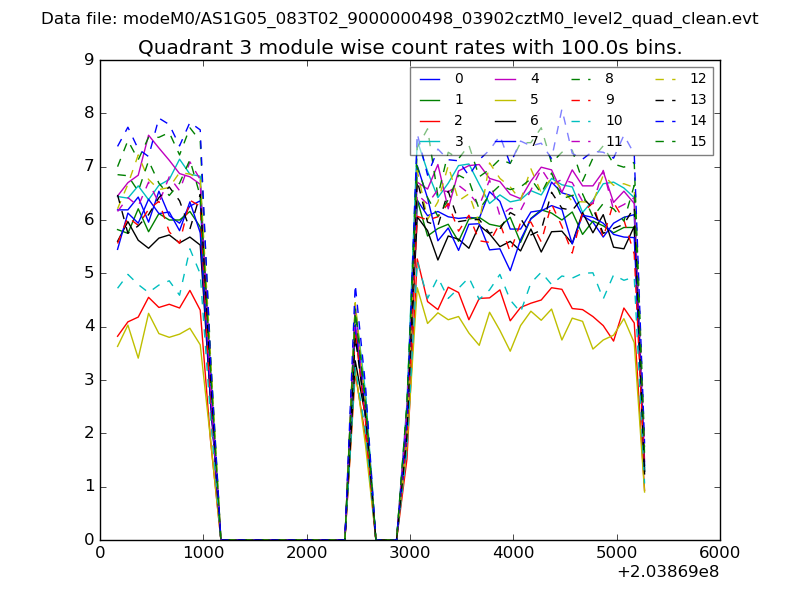
| Module-wise count rates for Quadrant A Data is divided into 100 sec bins |
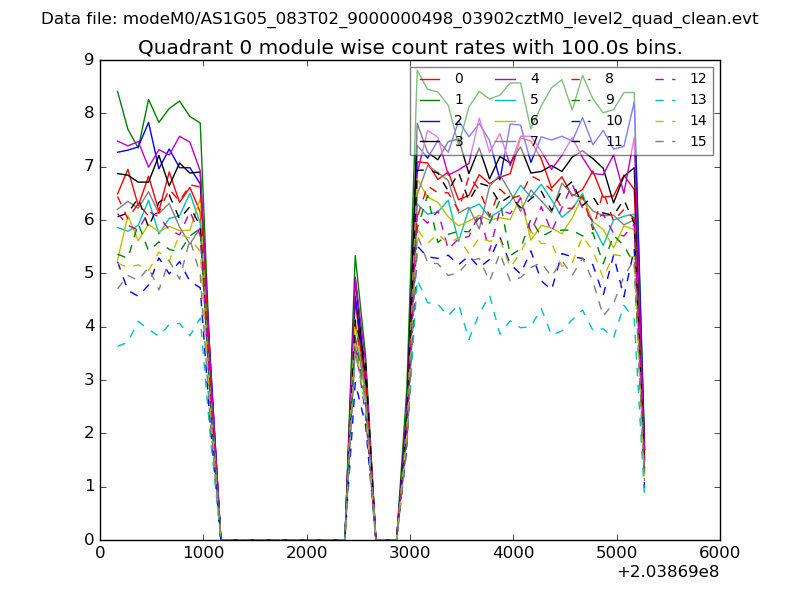 |
 |
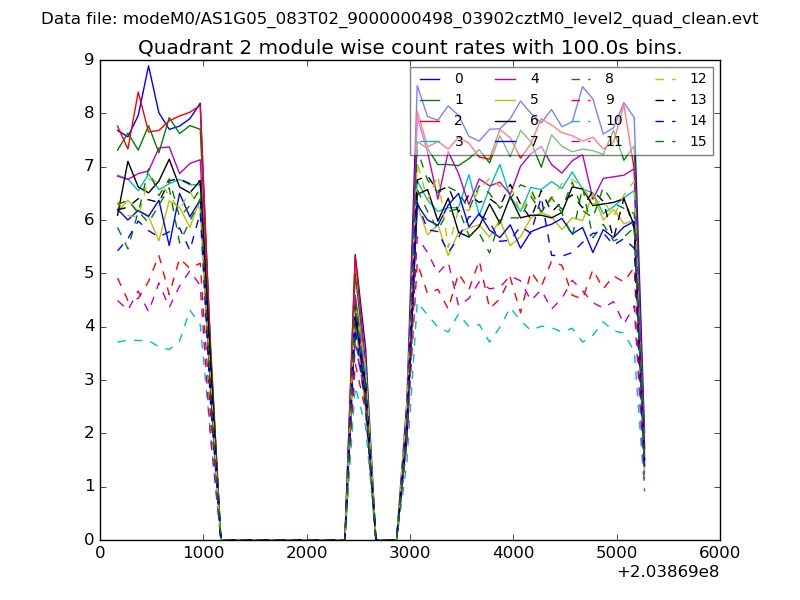
| Module-wise count rates for Quadrant B Data is divided into 100 sec bins |
 |
 |
| Module-wise count rates for Quadrant C Data is divided into 100 sec bins |
 |
 |
| Module-wise count rates for Quadrant D Data is divided into 100 sec bins |
 |
 |
| Parameter | Plot |
|---|---|
| CZT HV Monitor | 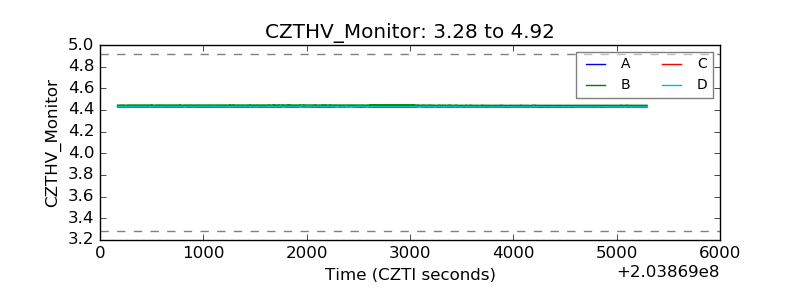 |
| D_VDD | 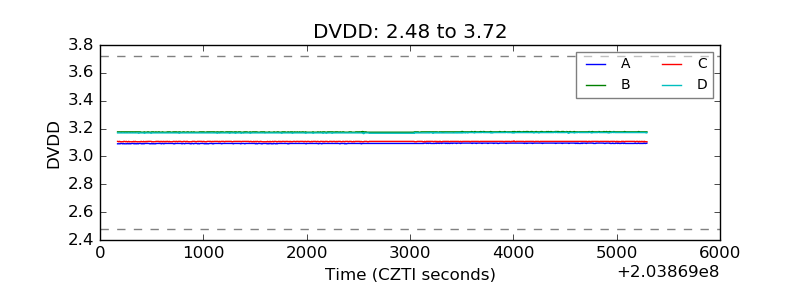 |
| Temperature 1 | 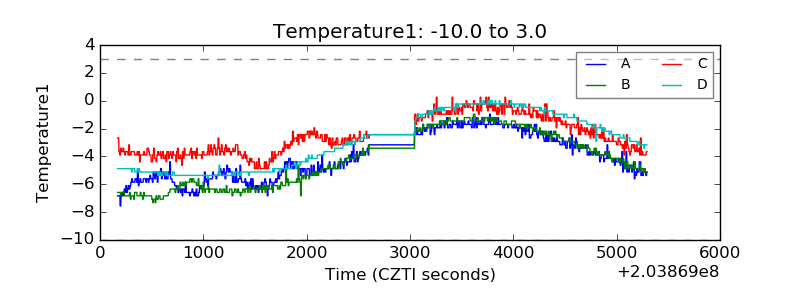 |
| Veto HV Monitor | 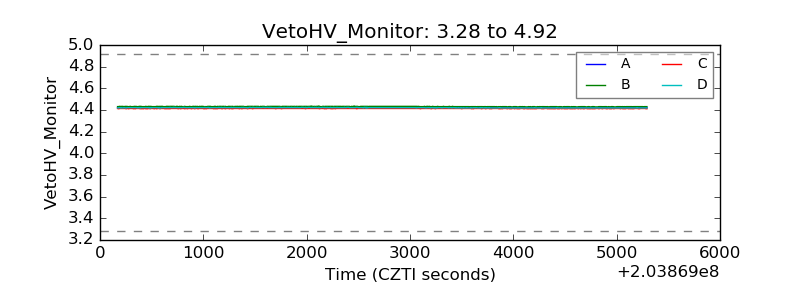 |
| Veto LLD | 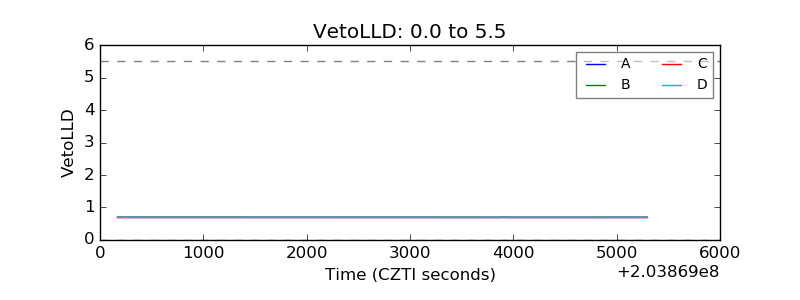 |
| Alpha Counter | 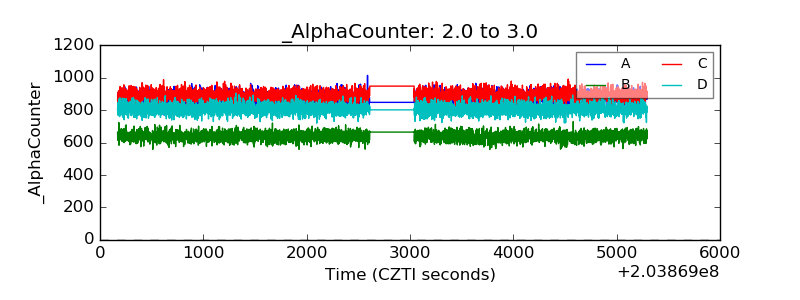 |
| _CPM_Rate | 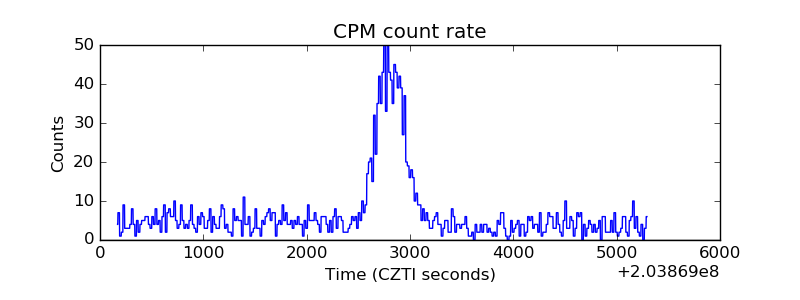 |
| CZT Counter | 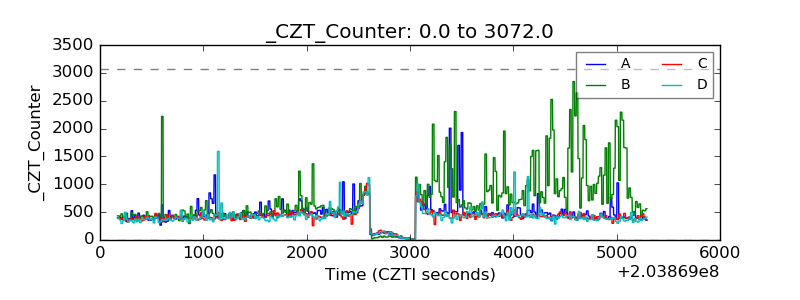 |
| +2.5 Volts monitor |  |
| +5 Volts monitor |  |
| Veto Counter | 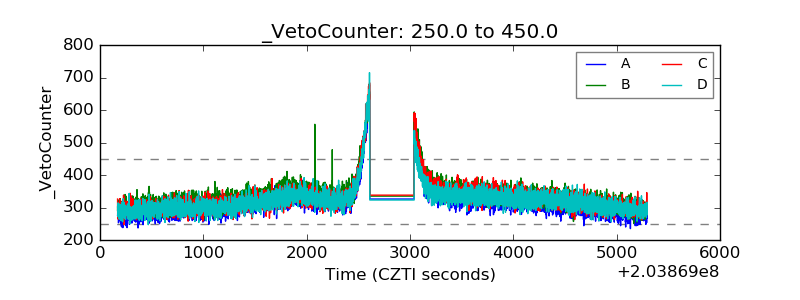 |