| Param | Original file | Final file |
|---|---|---|
| Filename | modeM0/AS1G05_167T01_9000000500cztM0_level2.fits | modeM0/AS1G05_167T01_9000000500cztM0_level2_quad_clean.evt |
| Size (bytes) | 115,966,080 | 153,247,680 |
| Size | 110.6 MB | 146.1 MB |
| Events in quadrant A | 694,862 | 993,252 |
| Events in quadrant B | 636,038 | 925,262 |
| Events in quadrant C | 690,436 | 949,264 |
| Events in quadrant D | 593,594 | 876,537 |
| Mode M9 | |||
|---|---|---|---|
| Quadrant | BADHDUFLAG | Total packets | Discarded packets |
| A | 0 | 21 | 0 |
| B | 0 | 21 | 0 |
| C | 0 | 21 | 0 |
| D | 0 | 21 | 0 |
| Mode SS | |||
|---|---|---|---|
| Quadrant | BADHDUFLAG | Total packets | Discarded packets |
| A | 0 | 264 | 0 |
| B | 0 | 264 | 0 |
| C | 0 | 264 | 0 |
| D | 0 | 264 | 0 |
| Mode M0 | |||
|---|---|---|---|
| Quadrant | BADHDUFLAG | Total packets | Discarded packets |
| A | 0 | 28899 | 0 |
| B | 0 | 44370 | 0 |
| C | 0 | 27130 | 0 |
| D | 0 | 28574 | 0 |
| Quadrant | Total seconds | Saturated seconds | Saturation percentage |
|---|---|---|---|
| A | 12974 | 151 | 1.163866% |
| B | 12973 | 1476 | 11.377476% |
| C | 12974 | 93 | 0.716818% |
| D | 12974 | 145 | 1.117620% |
Noise dominated data is calculated using 1-second bins in cleaned event files. If a bin has >2000 counts, and if more than 50% of those come from <1% of pixels, then it is considered to be noise-dominated and hence unusable.
| Quadrant | # 1 sec bins | Bins with >0 counts | Bins with >2000 counts | High rate bins dominated by noise | Noise dominated (total time) | Noise dominated (detector-on time) | Marked lightcurve |
|---|---|---|---|---|---|---|---|
| A | 15124 | 12972 | 0 | 0 | 0.00% | 0.00% |  |
| B | 15123 | 12972 | 0 | 0 | 0.00% | 0.00% |  |
| C | 15123 | 12972 | 0 | 0 | 0.00% | 0.00% |  |
| D | 15124 | 12972 | 0 | 0 | 0.00% | 0.00% |  |
Top three noisy pixels from each quadrant. If the there are fewer than three noisy pixels in the level2.evt file, extra rows are filled as -1
| Pixel properties | Quadrant properties | ||||||
|---|---|---|---|---|---|---|---|
| Quadrant | DetID | PixID | Counts | Sigma | Mean | Median | Sigma |
| A | 0 | 29 | 705 | 10.82 | 180 | 169 | 49.5 |
| A | 14 | 188 | 704 | 10.8 | 180 | 169 | 49.5 |
| A | 14 | 204 | 682 | 10.36 | 180 | 169 | 49.5 |
| B | 2 | 9 | 519 | 10.05 | 167 | 159 | 35.8 |
| B | 12 | 226 | 511 | 9.82 | 167 | 159 | 35.8 |
| B | 14 | 254 | 471 | 8.71 | 167 | 159 | 35.8 |
| C | 1 | 81 | 539 | 7.17 | 182 | 169 | 51.6 |
| C | 1 | 80 | 524 | 6.88 | 182 | 169 | 51.6 |
| C | 12 | 241 | 487 | 6.16 | 182 | 169 | 51.6 |
| D | 11 | 82 | 557 | 8.59 | 168 | 153 | 47.0 |
| D | 7 | 3 | 462 | 6.57 | 168 | 153 | 47.0 |
| D | 3 | 14 | 457 | 6.46 | 168 | 153 | 47.0 |
Histogram calculated using DETX and DETY for each event in the final _common_clean file
| Quadrant A | 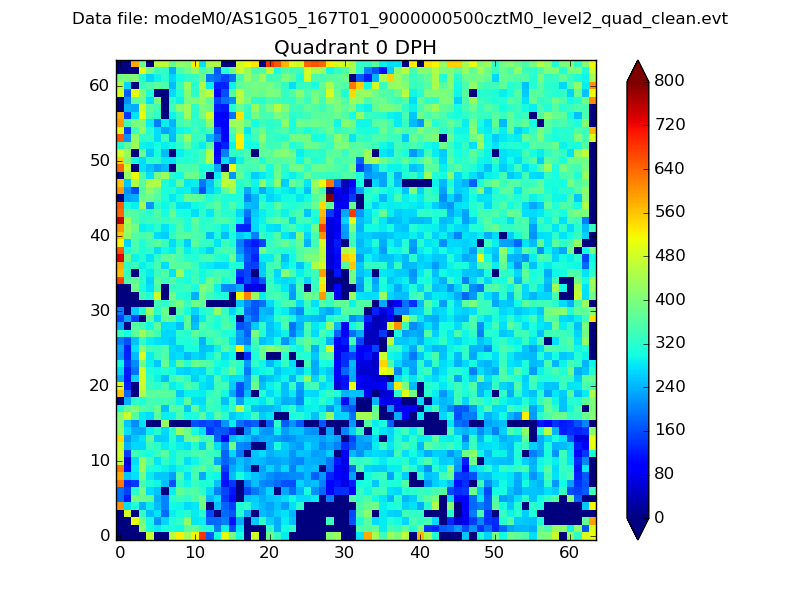 |
 |
Quadrant B |
|---|---|---|---|
| Quadrant D |  |
 |
Quadrant C |
| Plot type | Count rate plots | Images |
|---|---|---|
| Comparison with Poisson distribution Blue bars denote a histogram of data divided into 1 sec bins. Red curve is a Poisson curve with rate = median count rate of data. |
 |
 |
| Quadrant-wise count rates Data is divided into 100 sec bins |
 |
|
| Module-wise count rates for Quadrant A Data is divided into 100 sec bins |
 |
 |
| Module-wise count rates for Quadrant B Data is divided into 100 sec bins |
 |
 |
| Module-wise count rates for Quadrant C Data is divided into 100 sec bins |
 |
 |
| Module-wise count rates for Quadrant D Data is divided into 100 sec bins |
 |
 |
| Parameter | Plot |
|---|---|
| CZT HV Monitor |  |
| D_VDD |  |
| Temperature 1 |  |
| Veto HV Monitor |  |
| Veto LLD |  |
| Alpha Counter |  |
| _CPM_Rate |  |
| CZT Counter |  |
| +2.5 Volts monitor |  |
| +5 Volts monitor |  |
| _ROLL_ROT |  |
| _Roll_DEC |  |
| _Roll_RA | 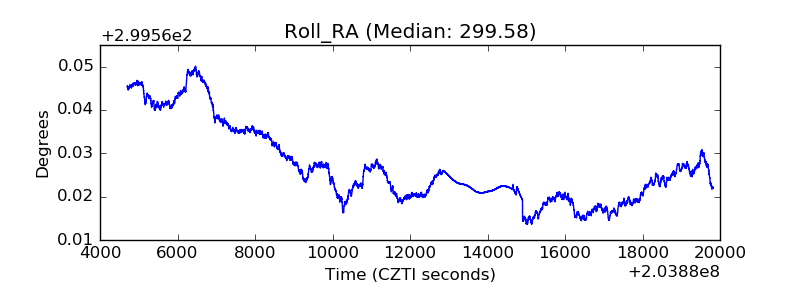 |
| Veto Counter |  |