| Param | Original file | Final file |
|---|---|---|
| Filename | modeM0/AS1G05_167T01_9000000500_03903cztM0_level2.evt | modeM0/AS1G05_167T01_9000000500_03903cztM0_level2_quad_clean.evt |
| Size (bytes) | 541,186,560 | 90,391,680 |
| Size | 516.1 MB | 86.2 MB |
| Events in quadrant A | 3,366,918 | 584,701 |
| Events in quadrant B | 6,209,966 | 557,500 |
| Events in quadrant C | 3,119,196 | 576,513 |
| Events in quadrant D | 3,247,794 | 559,745 |
| Mode M9 | |||
|---|---|---|---|
| Quadrant | BADHDUFLAG | Total packets | Discarded packets |
| A | 0 | 10 | 0 |
| B | 0 | 10 | 0 |
| C | 0 | 10 | 0 |
| D | 0 | 10 | 0 |
| Mode SS | |||
|---|---|---|---|
| Quadrant | BADHDUFLAG | Total packets | Discarded packets |
| A | 0 | 132 | 0 |
| B | 0 | 132 | 0 |
| C | 0 | 132 | 0 |
| D | 0 | 132 | 0 |
| Mode M0 | |||
|---|---|---|---|
| Quadrant | BADHDUFLAG | Total packets | Discarded packets |
| A | 0 | 14647 | 2 |
| B | 0 | 23088 | 1 |
| C | 0 | 13929 | 1 |
| D | 0 | 14420 | 1 |
| Quadrant | Total seconds | Saturated seconds | Saturation percentage |
|---|---|---|---|
| A | 6584 | 80 | 1.215067% |
| B | 6584 | 589 | 8.945930% |
| C | 6584 | 64 | 0.972053% |
| D | 6584 | 66 | 1.002430% |
Noise dominated data is calculated using 1-second bins in cleaned event files. If a bin has >2000 counts, and if more than 50% of those come from <1% of pixels, then it is considered to be noise-dominated and hence unusable.
| Quadrant | # 1 sec bins | Bins with >0 counts | Bins with >2000 counts | High rate bins dominated by noise | Noise dominated (total time) | Noise dominated (detector-on time) | Marked lightcurve |
|---|---|---|---|---|---|---|---|
| A | 7569 | 6585 | 36 | 36 | 0.48% | 0.55% | 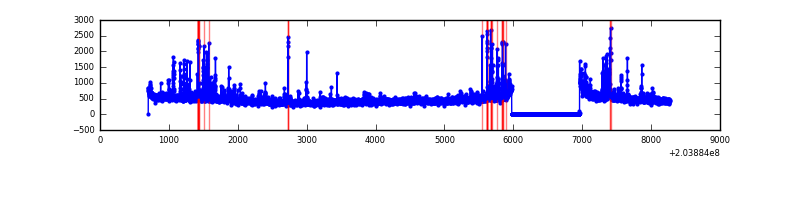 |
| B | 7569 | 6585 | 354 | 354 | 4.68% | 5.38% | 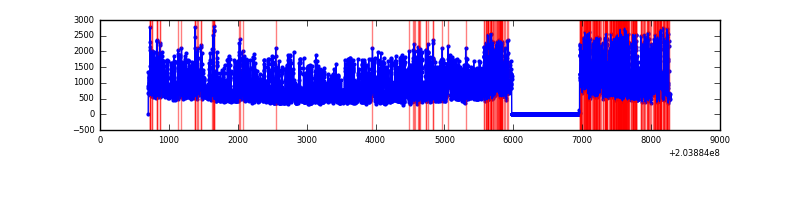 |
| C | 7569 | 6585 | 23 | 23 | 0.30% | 0.35% | 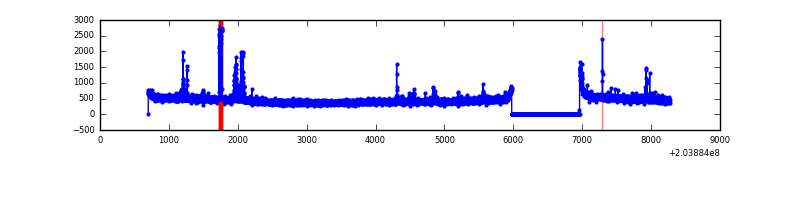 |
| D | 7569 | 6585 | 50 | 50 | 0.66% | 0.76% | 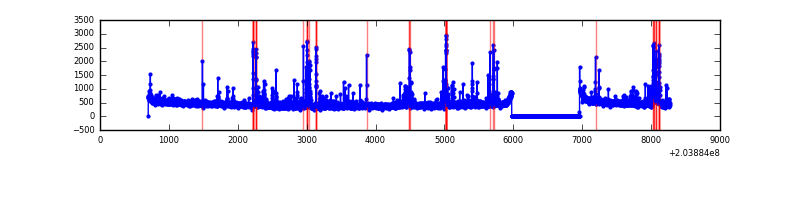 |
Top three noisy pixels from each quadrant. If the there are fewer than three noisy pixels in the level2.evt file, extra rows are filled as -1
| Pixel properties | Quadrant properties | ||||||
|---|---|---|---|---|---|---|---|
| Quadrant | DetID | PixID | Counts | Sigma | Mean | Median | Sigma |
| A | 0 | 50 | 147548 | 930.02 | 767 | 751 | 157.8 |
| A | 0 | 118 | 113056 | 711.5 | 767 | 751 | 157.8 |
| A | 2 | 79 | 52185 | 325.86 | 767 | 751 | 157.8 |
| B | 7 | 221 | 2879370 | 19876.48 | 758 | 741 | 144.8 |
| B | 15 | 204 | 212451 | 1461.82 | 758 | 741 | 144.8 |
| B | 0 | 219 | 51460 | 350.21 | 758 | 741 | 144.8 |
| C | 9 | 247 | 58127 | 325.73 | 752 | 759 | 176.1 |
| C | 7 | 222 | 57469 | 322.0 | 752 | 759 | 176.1 |
| C | 12 | 4 | 42760 | 238.48 | 752 | 759 | 176.1 |
| D | 13 | 239 | 162871 | 899.62 | 746 | 725 | 180.2 |
| D | 13 | 223 | 96720 | 532.6 | 746 | 725 | 180.2 |
| D | 1 | 20 | 89088 | 490.26 | 746 | 725 | 180.2 |
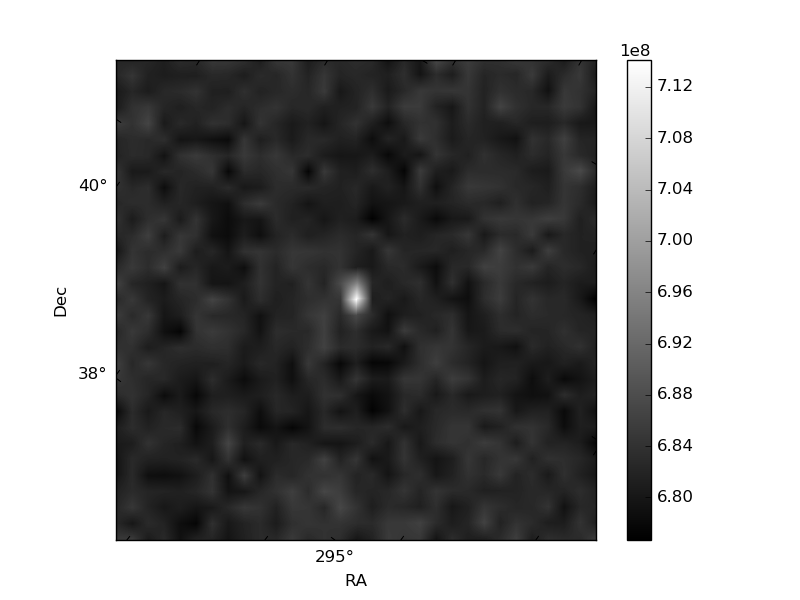
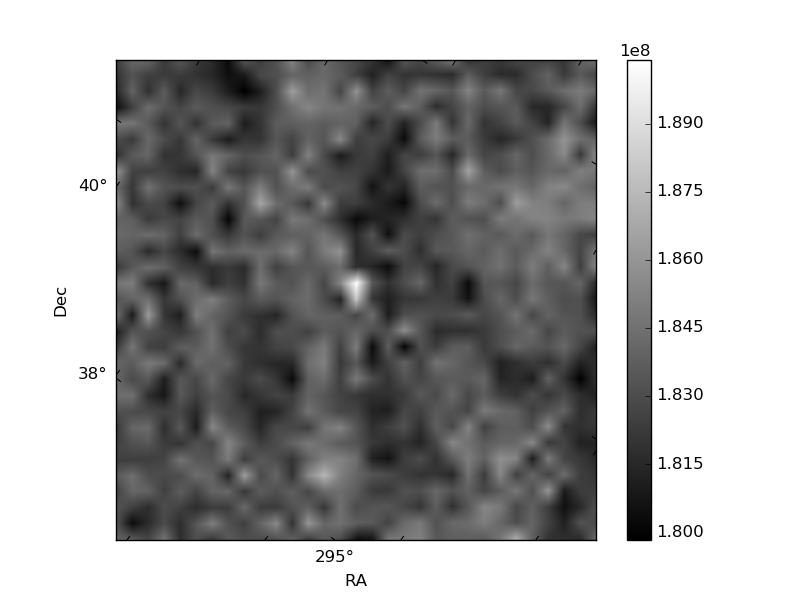
Histogram calculated using DETX and DETY for each event in the final _common_clean file
| Quadrant A | 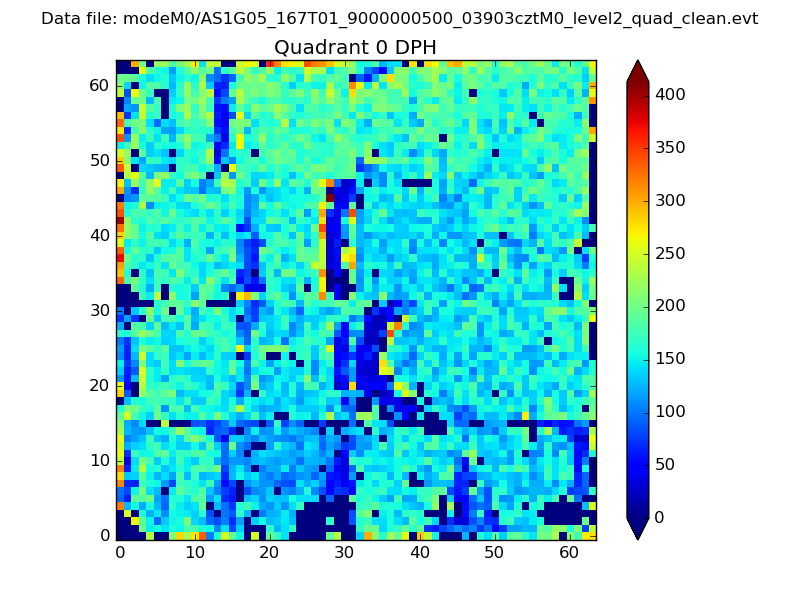 |
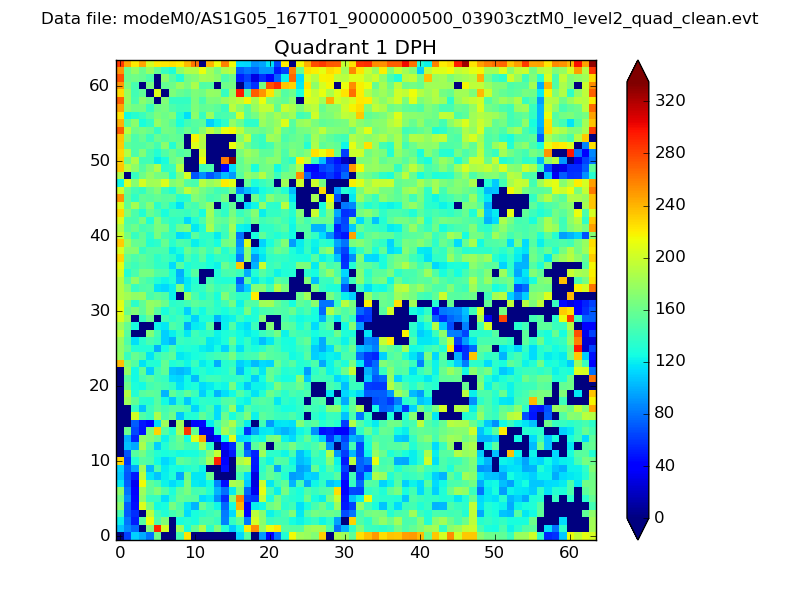 |
Quadrant B |
|---|---|---|---|
| Quadrant D | 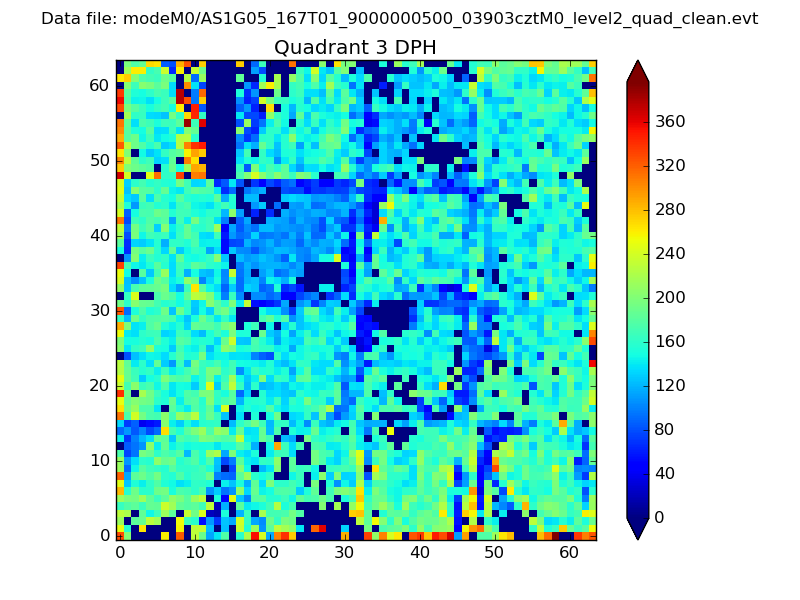 |
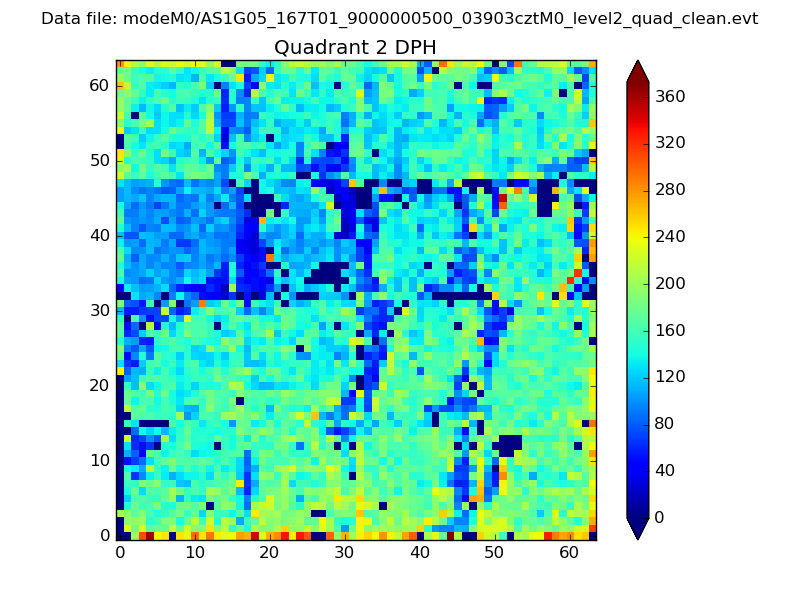 |
Quadrant C |
| Plot type | Count rate plots | Images |
|---|---|---|
| Comparison with Poisson distribution Blue bars denote a histogram of data divided into 1 sec bins. Red curve is a Poisson curve with rate = median count rate of data. |
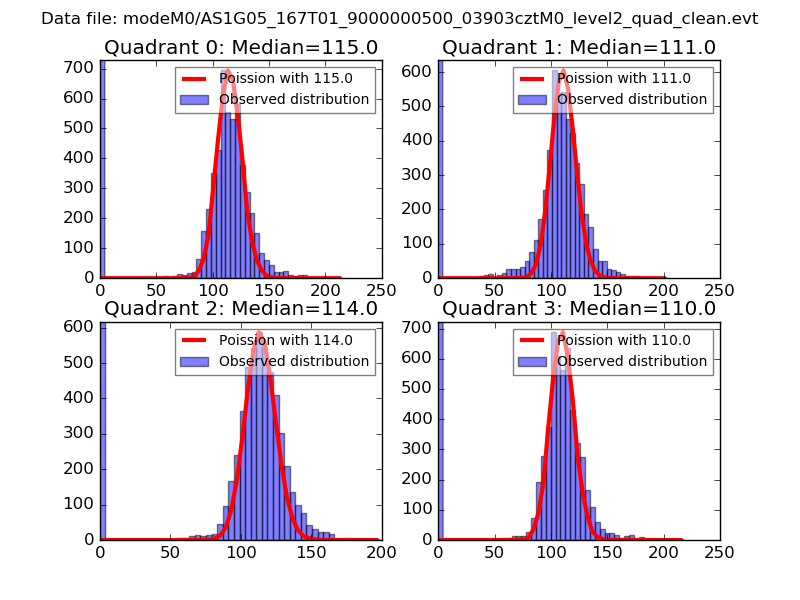 |
 |
| Quadrant-wise count rates Data is divided into 100 sec bins |
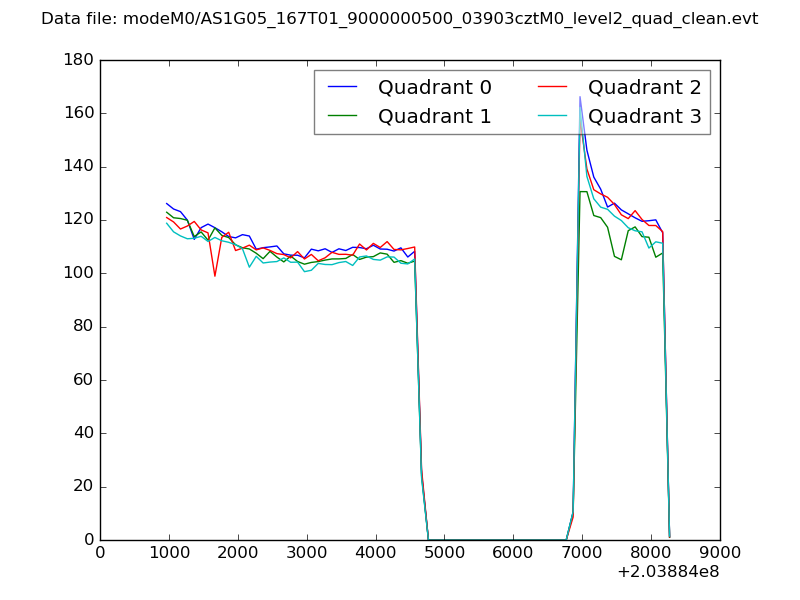 |
|
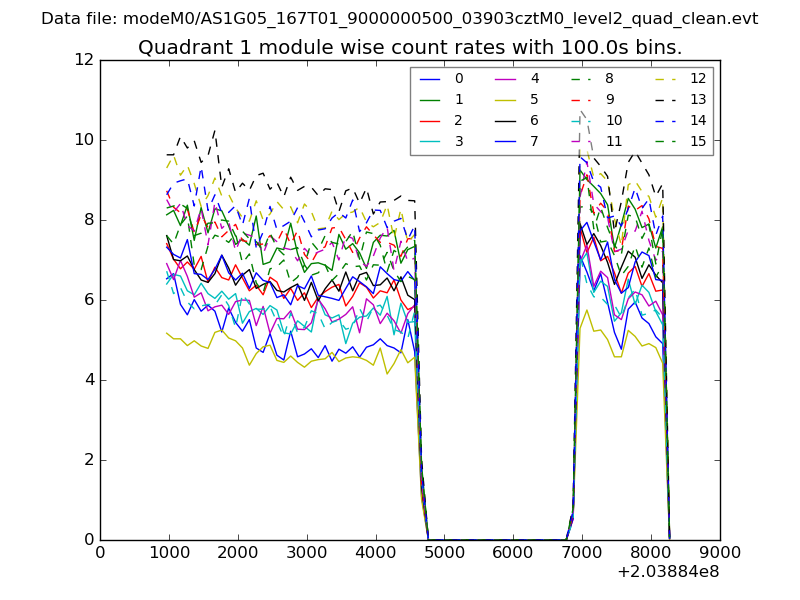
| Module-wise count rates for Quadrant A Data is divided into 100 sec bins |
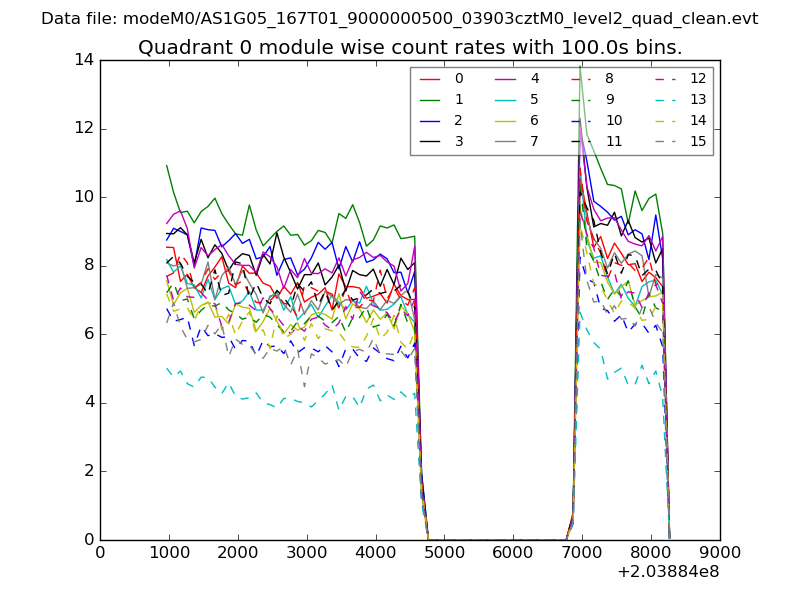 |
 |
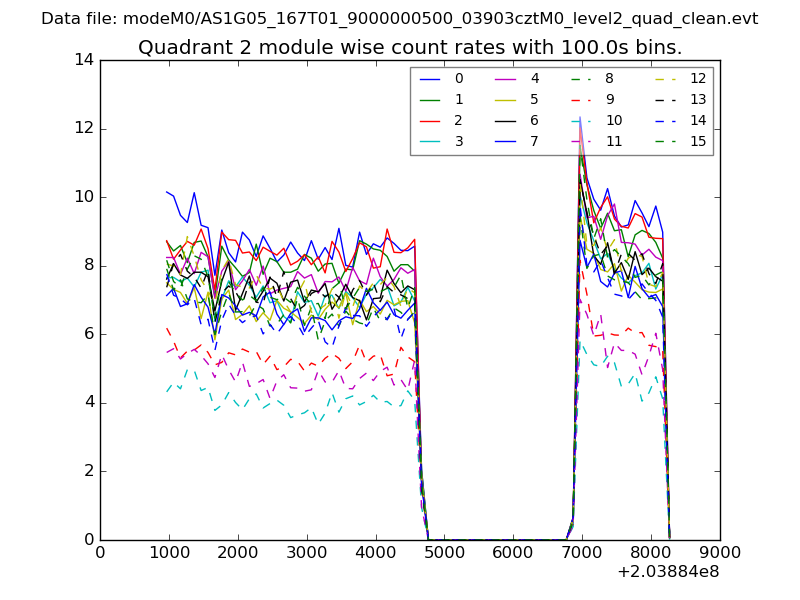
| Module-wise count rates for Quadrant B Data is divided into 100 sec bins |
 |
 |
| Module-wise count rates for Quadrant C Data is divided into 100 sec bins |
 |
 |
| Module-wise count rates for Quadrant D Data is divided into 100 sec bins |
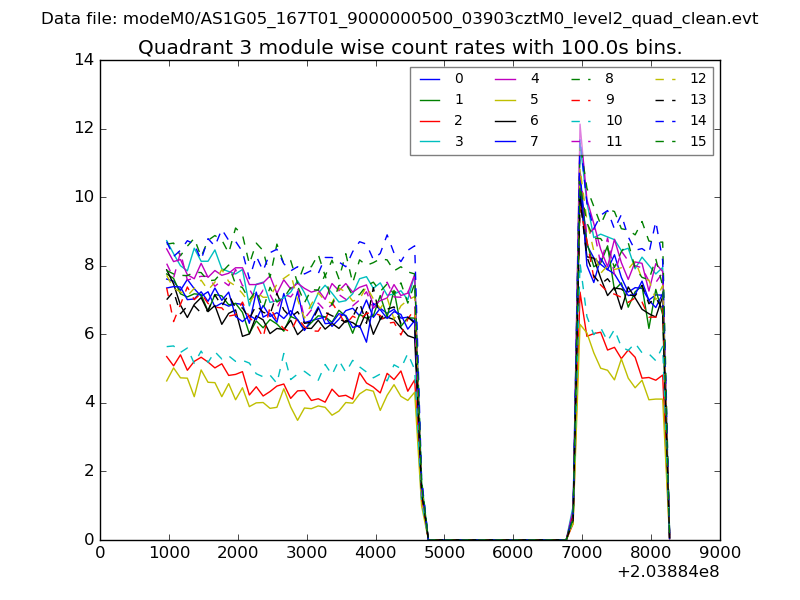 |
 |
| Parameter | Plot |
|---|---|
| CZT HV Monitor | 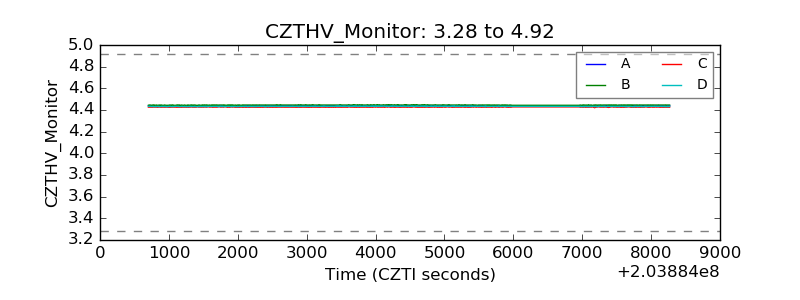 |
| D_VDD | 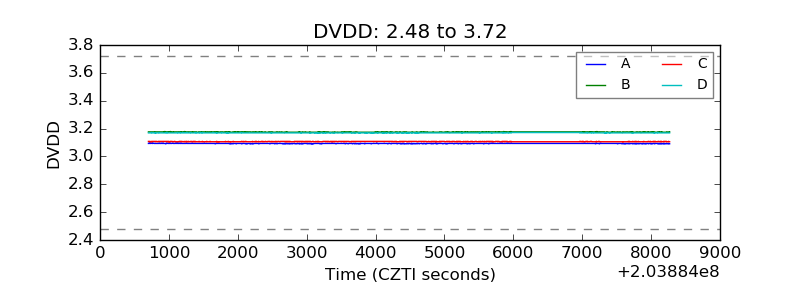 |
| Temperature 1 | 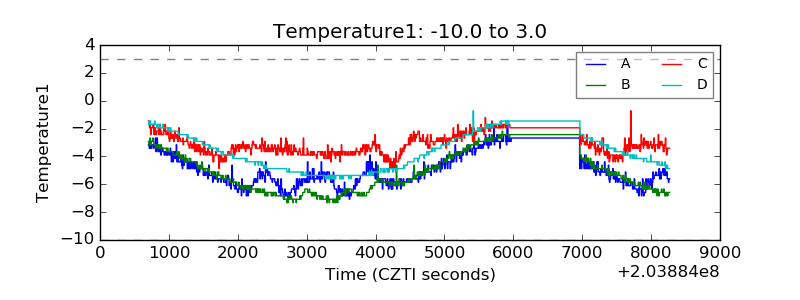 |
| Veto HV Monitor | 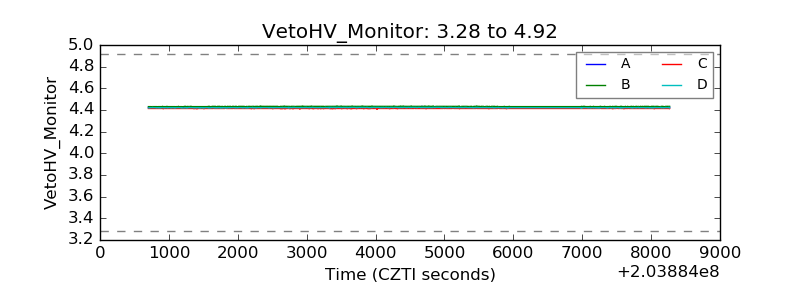 |
| Veto LLD | 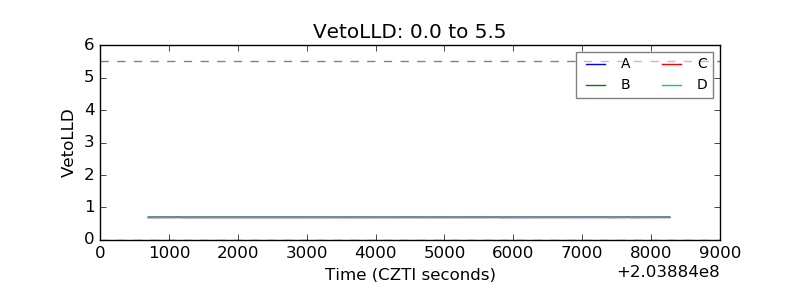 |
| Alpha Counter | 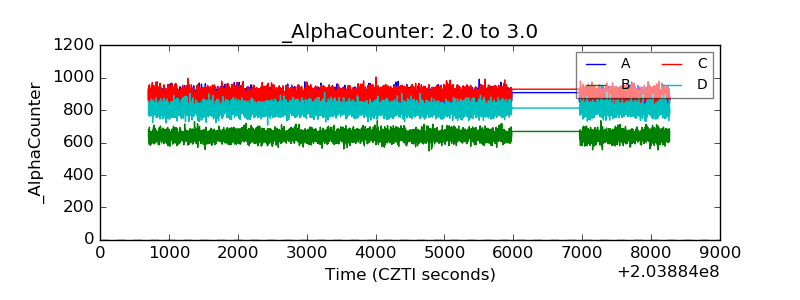 |
| _CPM_Rate | 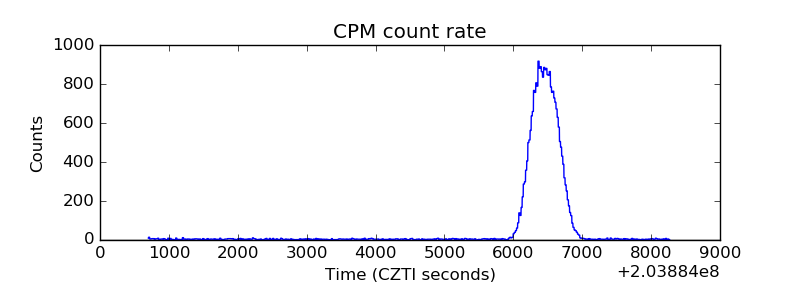 |
| CZT Counter | 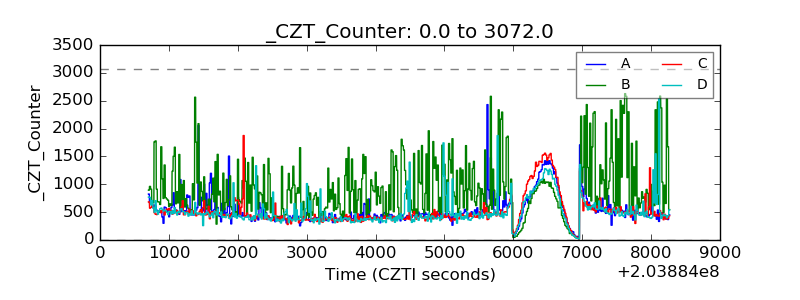 |
| +2.5 Volts monitor |  |
| +5 Volts monitor |  |
| Veto Counter | 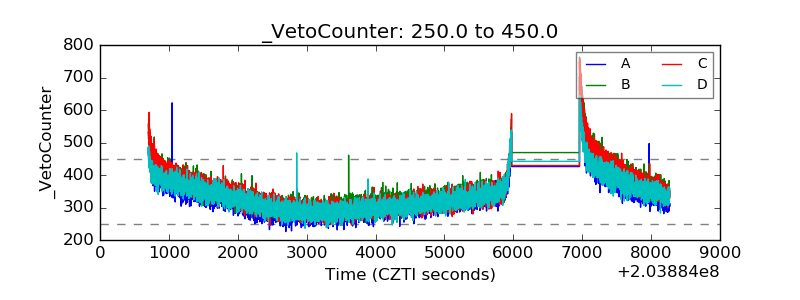 |