| Param | Original file | Final file |
|---|---|---|
| Filename | modeM0/AS1G05_167T01_9000000500_03905cztM0_level2.evt | modeM0/AS1G05_167T01_9000000500_03905cztM0_level2_quad_clean.evt |
| Size (bytes) | 558,780,480 | 89,470,080 |
| Size | 532.9 MB | 85.3 MB |
| Events in quadrant A | 3,448,251 | 582,758 |
| Events in quadrant B | 6,720,546 | 543,477 |
| Events in quadrant C | 2,998,470 | 577,114 |
| Events in quadrant D | 3,317,876 | 555,880 |
| Mode M9 | |||
|---|---|---|---|
| Quadrant | BADHDUFLAG | Total packets | Discarded packets |
| A | 0 | 21 | 0 |
| B | 0 | 21 | 0 |
| C | 0 | 21 | 0 |
| D | 0 | 21 | 0 |
| Mode SS | |||
|---|---|---|---|
| Quadrant | BADHDUFLAG | Total packets | Discarded packets |
| A | 0 | 134 | 0 |
| B | 0 | 134 | 0 |
| C | 0 | 134 | 0 |
| D | 0 | 134 | 0 |
| Mode M0 | |||
|---|---|---|---|
| Quadrant | BADHDUFLAG | Total packets | Discarded packets |
| A | 0 | 14862 | 3 |
| B | 0 | 24385 | 5 |
| C | 0 | 13500 | 2 |
| D | 0 | 14598 | 2 |
| Quadrant | Total seconds | Saturated seconds | Saturation percentage |
|---|---|---|---|
| A | 6445 | 99 | 1.536074% |
| B | 6444 | 1236 | 19.180633% |
| C | 6445 | 59 | 0.915438% |
| D | 6445 | 92 | 1.427463% |
Noise dominated data is calculated using 1-second bins in cleaned event files. If a bin has >2000 counts, and if more than 50% of those come from <1% of pixels, then it is considered to be noise-dominated and hence unusable.
| Quadrant | # 1 sec bins | Bins with >0 counts | Bins with >2000 counts | High rate bins dominated by noise | Noise dominated (total time) | Noise dominated (detector-on time) | Marked lightcurve |
|---|---|---|---|---|---|---|---|
| A | 8595 | 6447 | 49 | 49 | 0.57% | 0.76% | 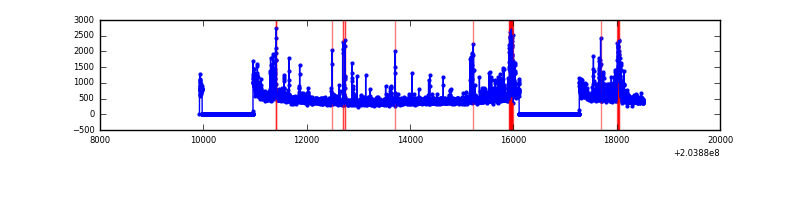 |
| B | 8595 | 6447 | 1115 | 1115 | 12.97% | 17.29% | 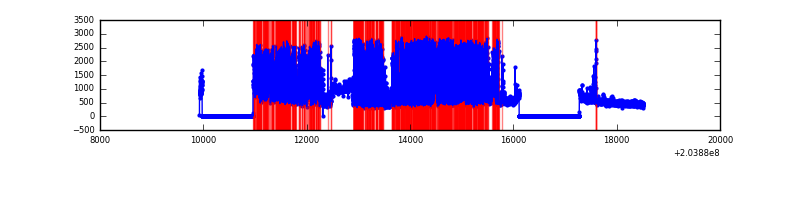 |
| C | 8595 | 6447 | 13 | 13 | 0.15% | 0.20% | 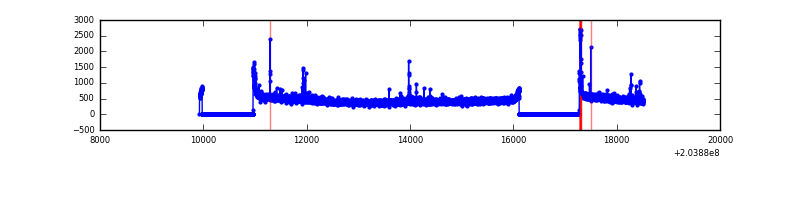 |
| D | 8595 | 6447 | 75 | 75 | 0.87% | 1.16% | 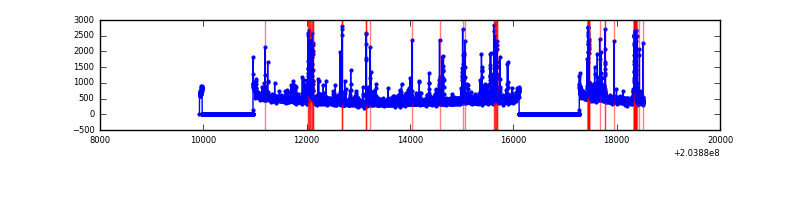 |
Top three noisy pixels from each quadrant. If the there are fewer than three noisy pixels in the level2.evt file, extra rows are filled as -1
| Pixel properties | Quadrant properties | ||||||
|---|---|---|---|---|---|---|---|
| Quadrant | DetID | PixID | Counts | Sigma | Mean | Median | Sigma |
| A | 0 | 118 | 187098 | 1205.54 | 752 | 739 | 154.6 |
| A | 0 | 50 | 142631 | 917.88 | 752 | 739 | 154.6 |
| A | 0 | 199 | 109361 | 702.66 | 752 | 739 | 154.6 |
| B | 7 | 221 | 3668362 | 26711.23 | 720 | 703 | 137.3 |
| B | 15 | 204 | 143284 | 1038.4 | 720 | 703 | 137.3 |
| B | 10 | 16 | 76541 | 552.32 | 720 | 703 | 137.3 |
| C | 10 | 65 | 41213 | 234.04 | 741 | 749 | 172.9 |
| C | 7 | 222 | 34088 | 192.83 | 741 | 749 | 172.9 |
| C | 12 | 4 | 19016 | 105.65 | 741 | 749 | 172.9 |
| D | 1 | 20 | 211878 | 1196.72 | 731 | 713 | 176.5 |
| D | 13 | 223 | 115426 | 650.1 | 731 | 713 | 176.5 |
| D | 13 | 239 | 79846 | 448.46 | 731 | 713 | 176.5 |
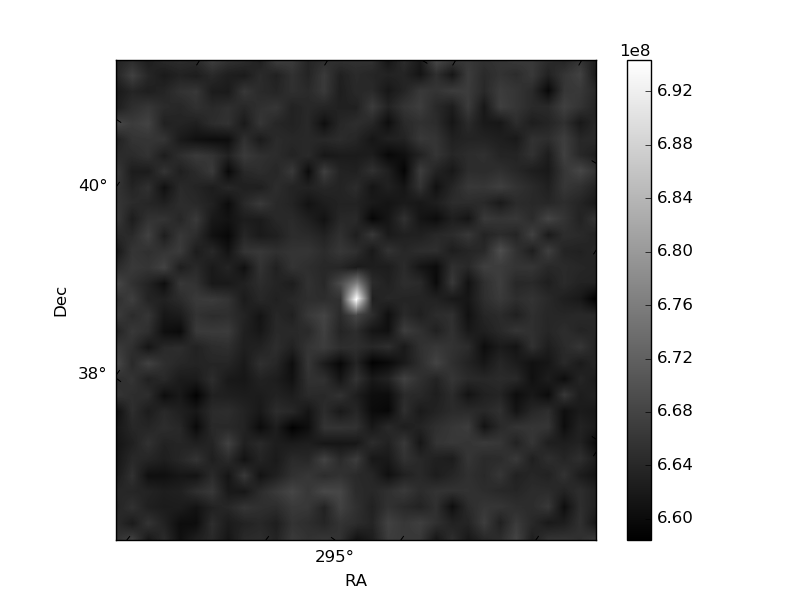
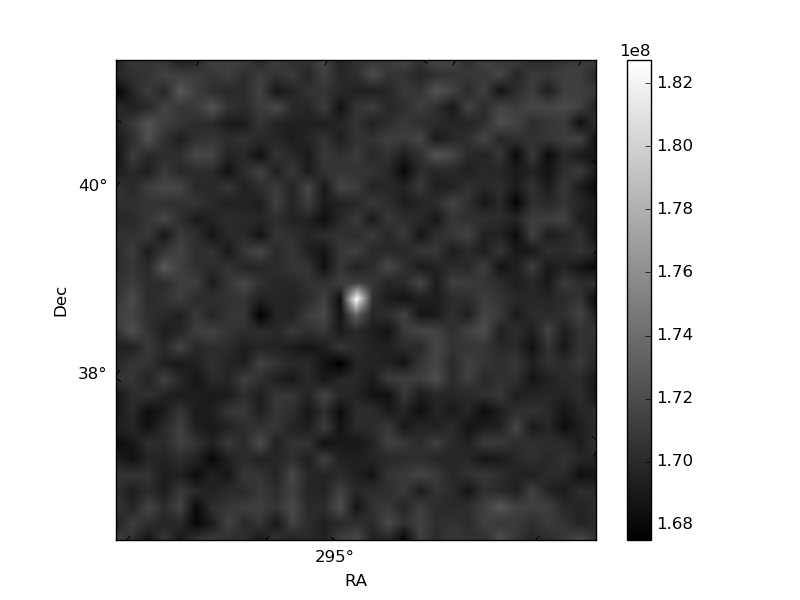
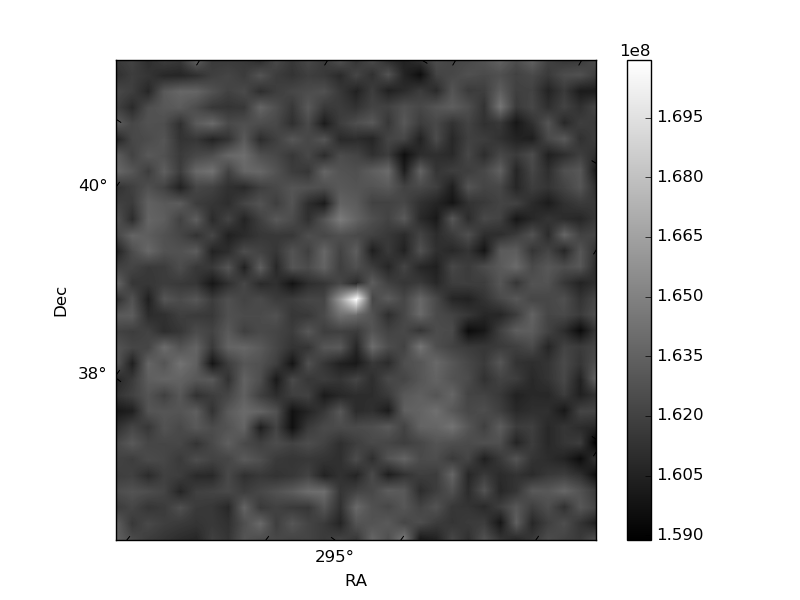
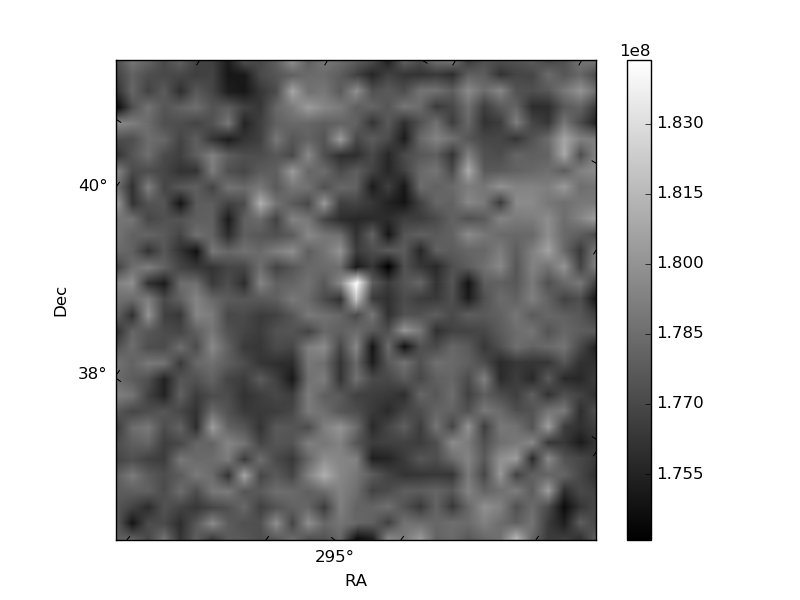
Histogram calculated using DETX and DETY for each event in the final _common_clean file
| Quadrant A | 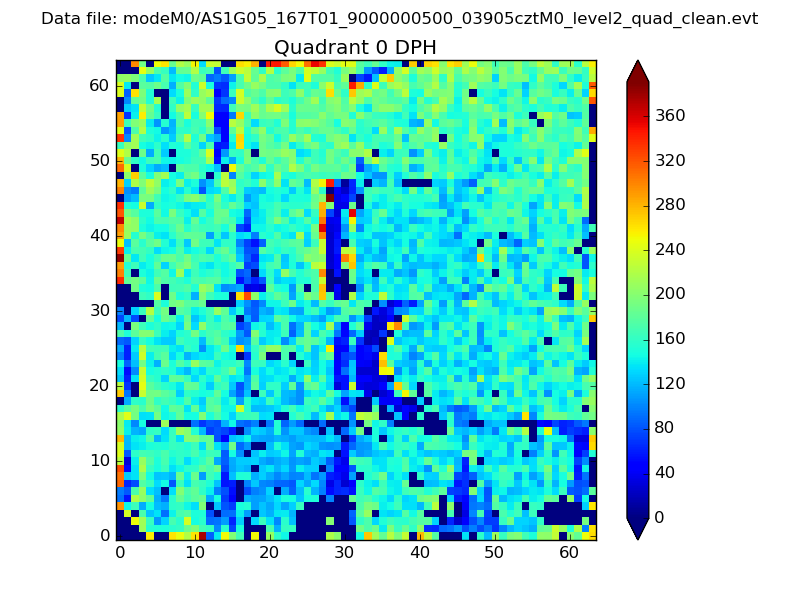 |
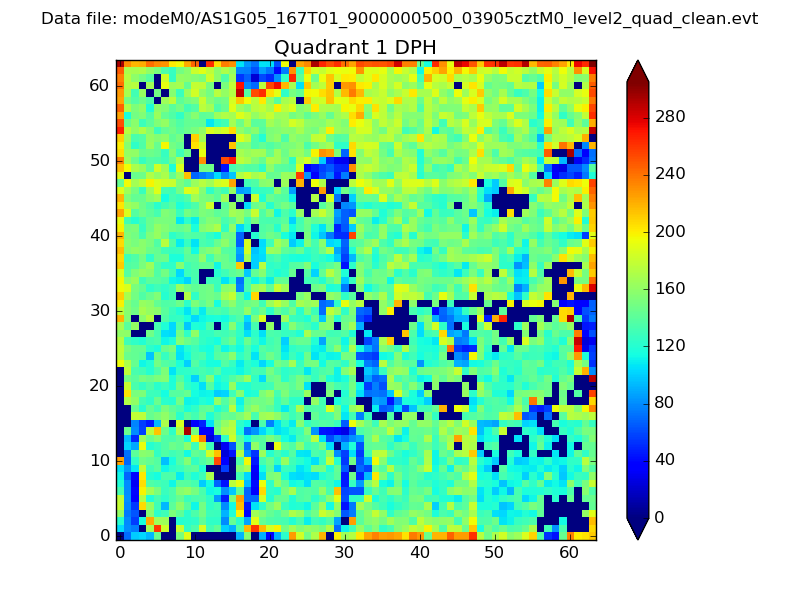 |
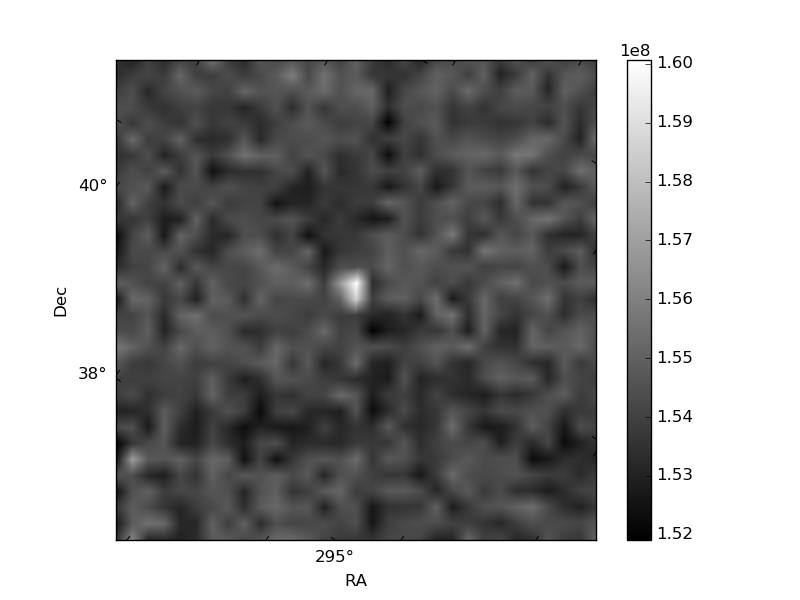
Quadrant B |
|---|---|---|---|
| Quadrant D | 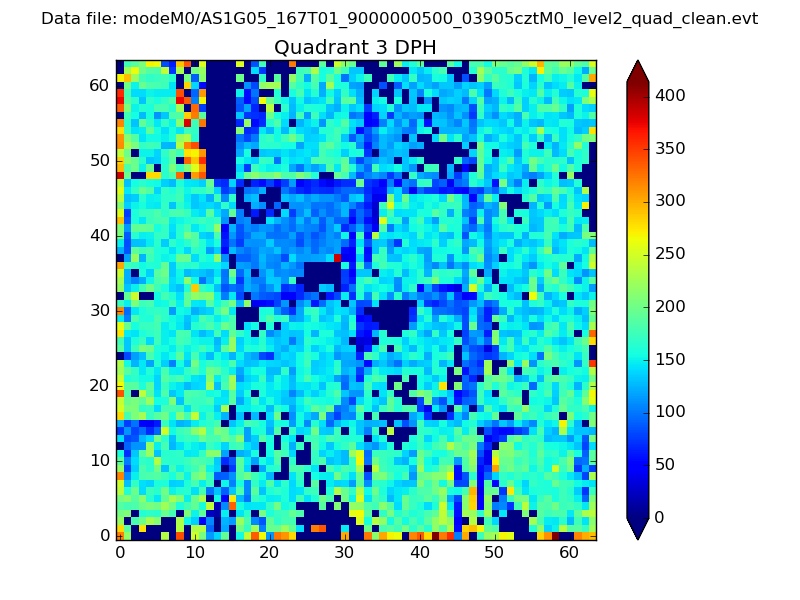 |
 |
Quadrant C |
| Plot type | Count rate plots | Images |
|---|---|---|
| Comparison with Poisson distribution Blue bars denote a histogram of data divided into 1 sec bins. Red curve is a Poisson curve with rate = median count rate of data. |
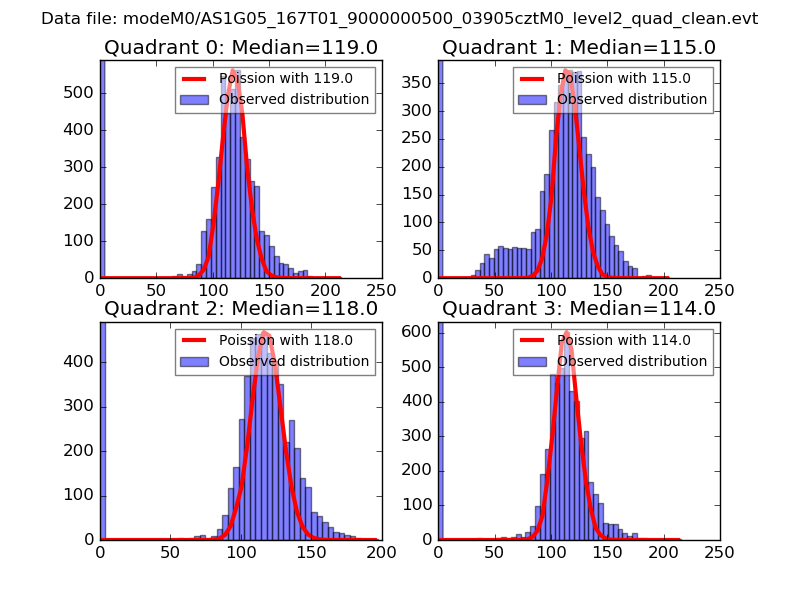 |
 |
| Quadrant-wise count rates Data is divided into 100 sec bins |
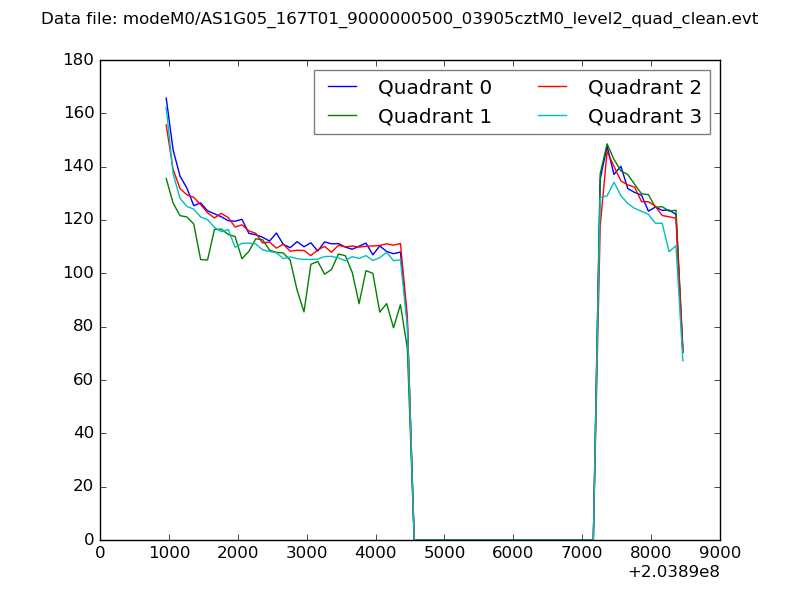 |
|
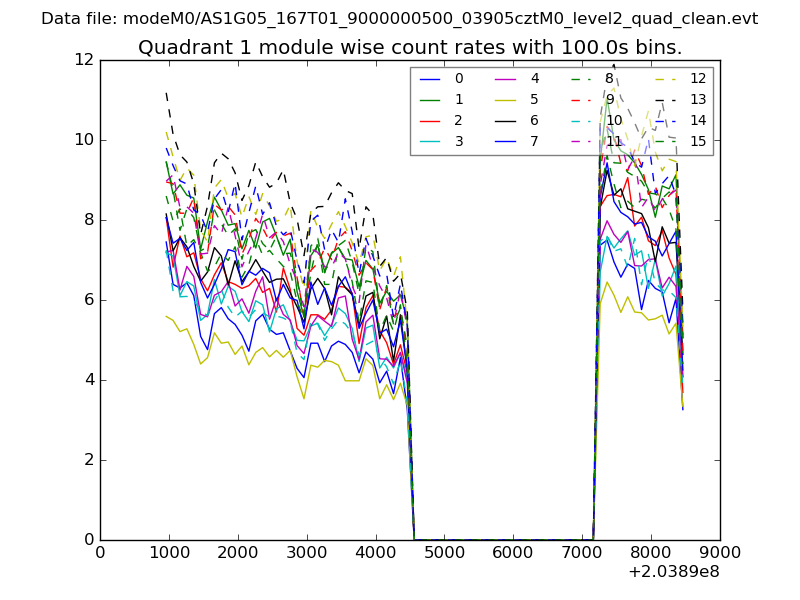
| Module-wise count rates for Quadrant A Data is divided into 100 sec bins |
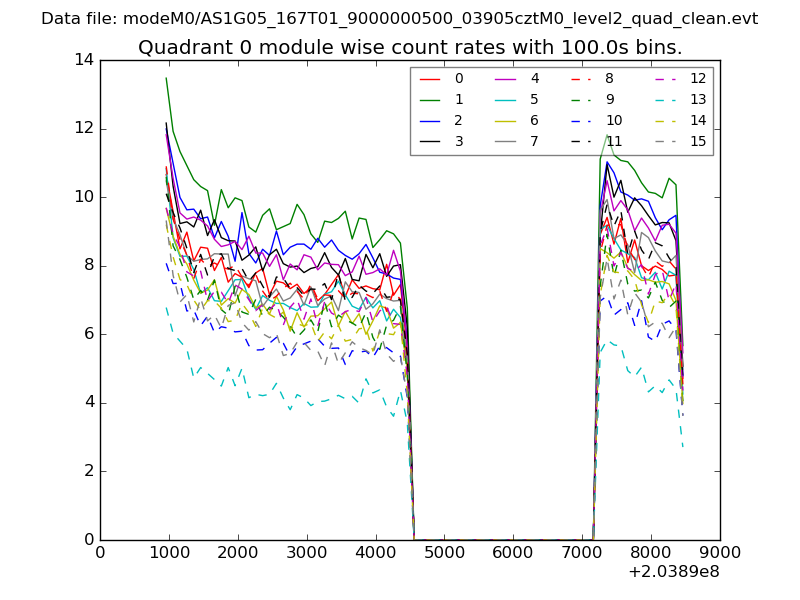 |
 |
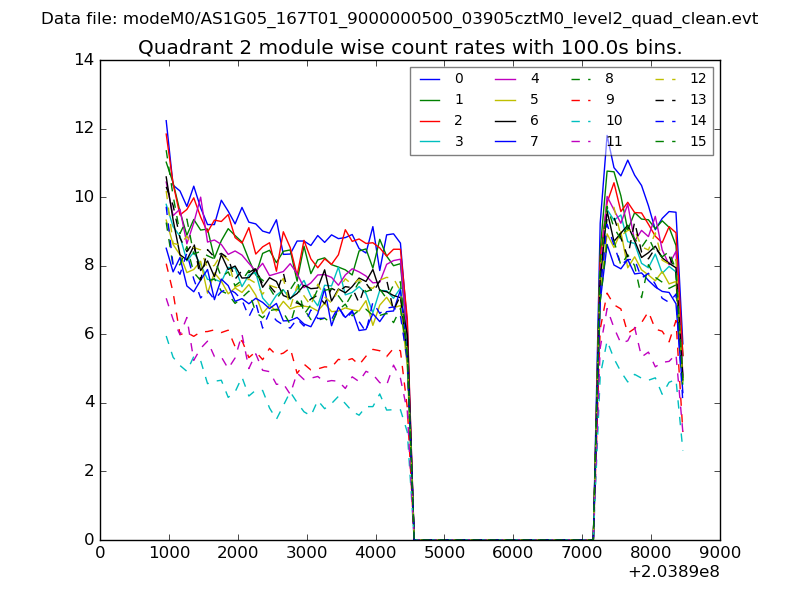
| Module-wise count rates for Quadrant B Data is divided into 100 sec bins |
 |
 |
| Module-wise count rates for Quadrant C Data is divided into 100 sec bins |
 |
 |
| Module-wise count rates for Quadrant D Data is divided into 100 sec bins |
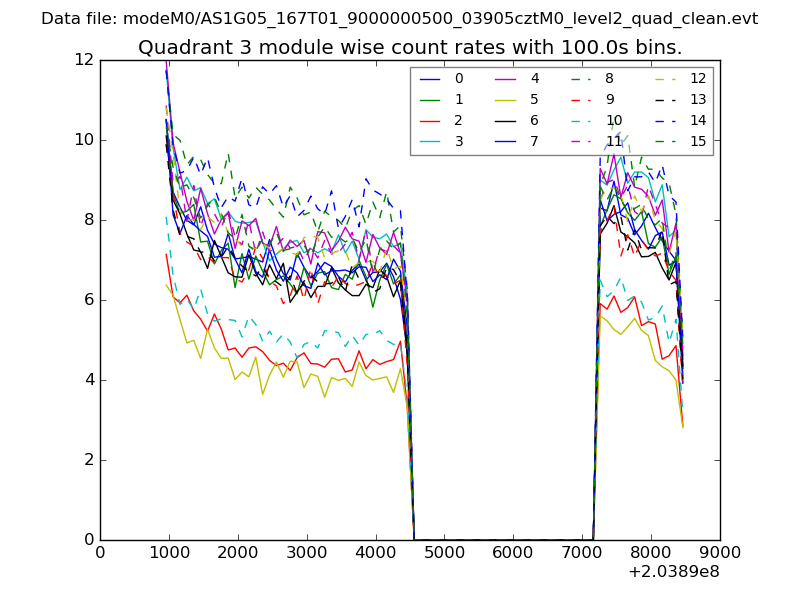 |
 |
| Parameter | Plot |
|---|---|
| CZT HV Monitor | 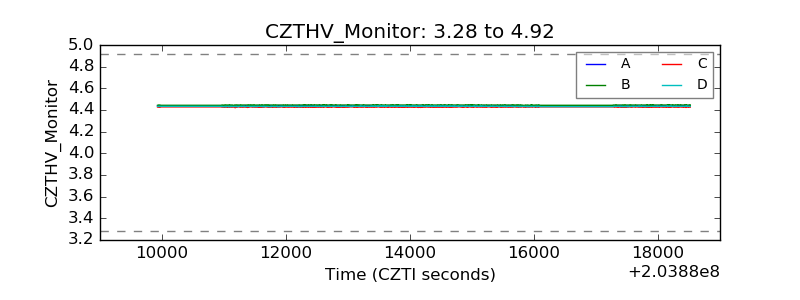 |
| D_VDD | 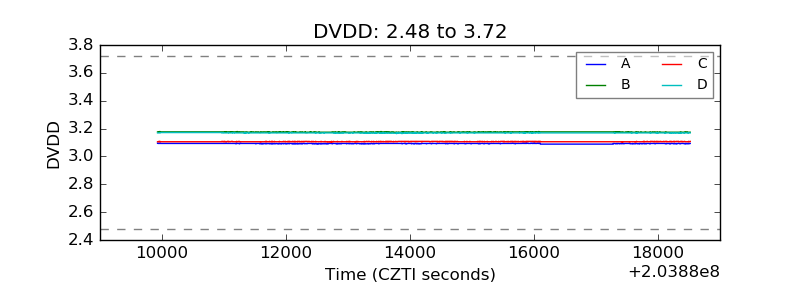 |
| Temperature 1 | 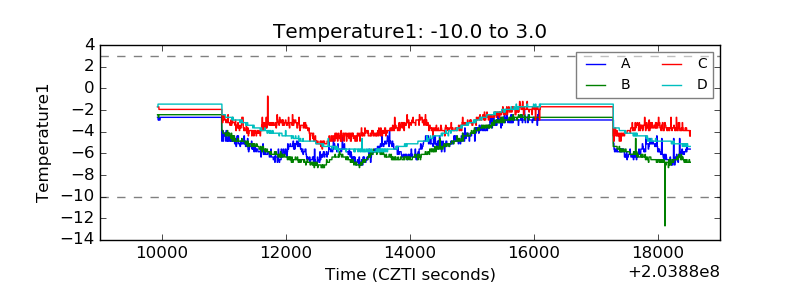 |
| Veto HV Monitor | 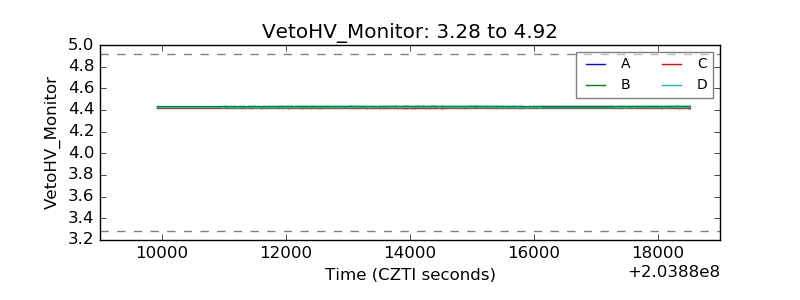 |
| Veto LLD | 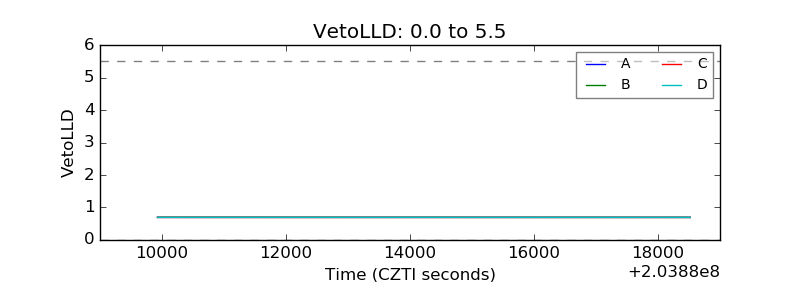 |
| Alpha Counter | 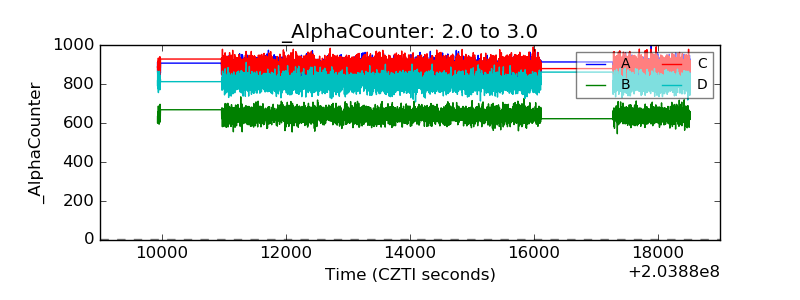 |
| _CPM_Rate | 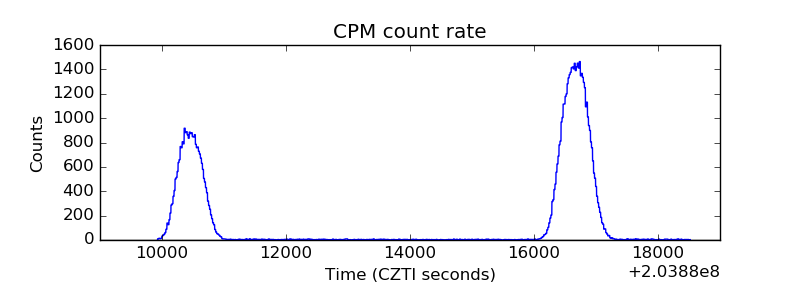 |
| CZT Counter | 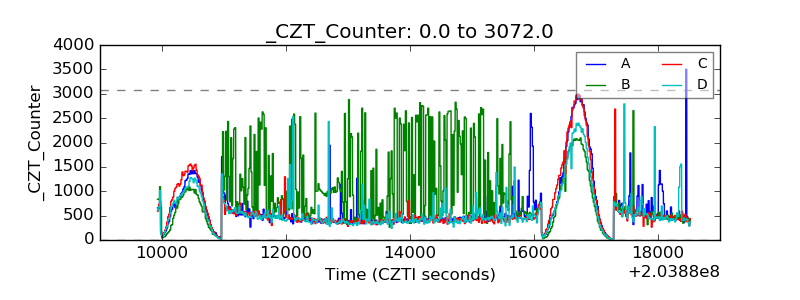 |
| +2.5 Volts monitor |  |
| +5 Volts monitor |  |
| Veto Counter | 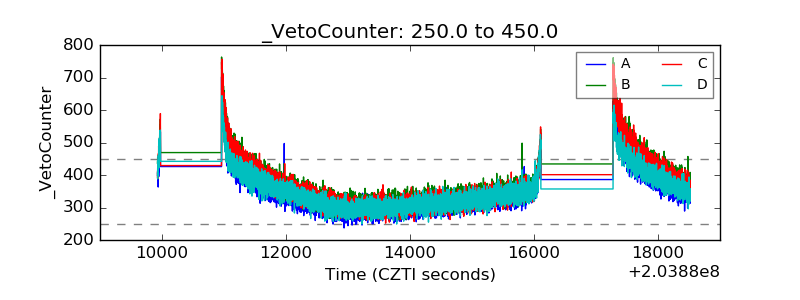 |