| Param | Original file | Final file |
|---|---|---|
| Filename | modeM0/AS1G05_167T01_9000000500_03906cztM0_level2.evt | modeM0/AS1G05_167T01_9000000500_03906cztM0_level2_quad_clean.evt |
| Size (bytes) | 174,922,560 | 46,785,600 |
| Size | 166.8 MB | 44.6 MB |
| Events in quadrant A | 1,342,750 | 312,947 |
| Events in quadrant B | 1,220,713 | 316,184 |
| Events in quadrant C | 1,227,213 | 308,962 |
| Events in quadrant D | 1,331,111 | 295,363 |
| Mode M9 | |||
|---|---|---|---|
| Quadrant | BADHDUFLAG | Total packets | Discarded packets |
| A | 0 | 2 | 0 |
| B | 0 | 2 | 0 |
| C | 0 | 2 | 0 |
| D | 0 | 3 | 0 |
| Mode SS | |||
|---|---|---|---|
| Quadrant | BADHDUFLAG | Total packets | Discarded packets |
| A | 0 | 52 | 0 |
| B | 0 | 52 | 0 |
| C | 0 | 52 | 0 |
| D | 0 | 52 | 0 |
| Mode M0 | |||
|---|---|---|---|
| Quadrant | BADHDUFLAG | Total packets | Discarded packets |
| A | 0 | 5833 | 1 |
| B | 0 | 5439 | 1 |
| C | 0 | 5464 | 1 |
| D | 0 | 5906 | 1 |
| Quadrant | Total seconds | Saturated seconds | Saturation percentage |
|---|---|---|---|
| A | 2549 | 11 | 0.431542% |
| B | 2549 | 10 | 0.392311% |
| C | 2549 | 22 | 0.863084% |
| D | 2549 | 56 | 2.196940% |
Noise dominated data is calculated using 1-second bins in cleaned event files. If a bin has >2000 counts, and if more than 50% of those come from <1% of pixels, then it is considered to be noise-dominated and hence unusable.
| Quadrant | # 1 sec bins | Bins with >0 counts | Bins with >2000 counts | High rate bins dominated by noise | Noise dominated (total time) | Noise dominated (detector-on time) | Marked lightcurve |
|---|---|---|---|---|---|---|---|
| A | 2549 | 2549 | 12 | 12 | 0.47% | 0.47% | 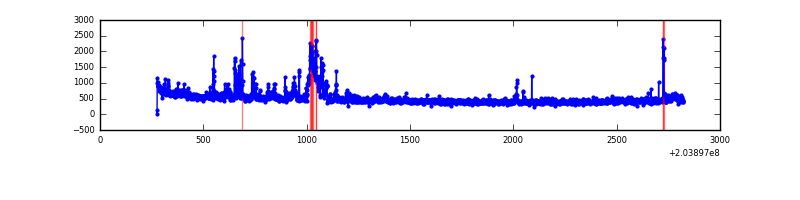 |
| B | 2549 | 2549 | 4 | 4 | 0.16% | 0.16% | 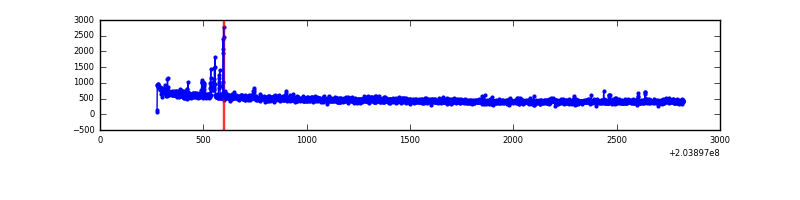 |
| C | 2549 | 2549 | 18 | 18 | 0.71% | 0.71% | 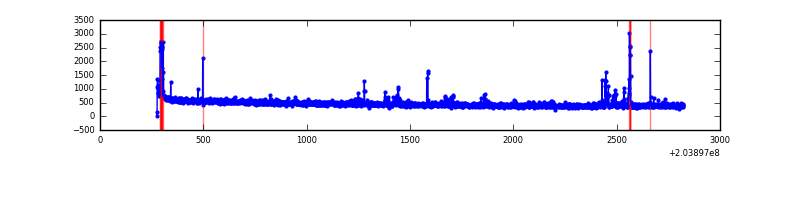 |
| D | 2549 | 2549 | 58 | 58 | 2.28% | 2.28% | 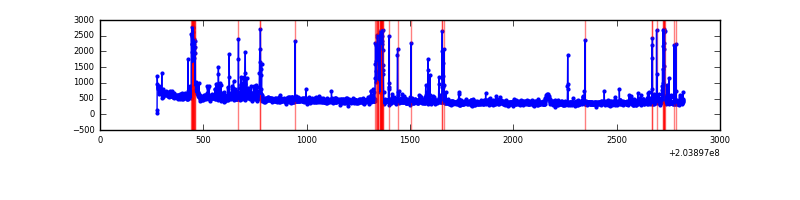 |
Top three noisy pixels from each quadrant. If the there are fewer than three noisy pixels in the level2.evt file, extra rows are filled as -1
| Pixel properties | Quadrant properties | ||||||
|---|---|---|---|---|---|---|---|
| Quadrant | DetID | PixID | Counts | Sigma | Mean | Median | Sigma |
| A | 0 | 118 | 112115 | 1851.96 | 289 | 285 | 60.4 |
| A | 0 | 199 | 56674 | 933.83 | 289 | 285 | 60.4 |
| A | 8 | 15 | 24034 | 393.29 | 289 | 285 | 60.4 |
| B | 15 | 204 | 33129 | 563.55 | 298 | 292 | 58.3 |
| B | 10 | 16 | 30630 | 520.67 | 298 | 292 | 58.3 |
| B | 12 | 111 | 4485 | 71.96 | 298 | 292 | 58.3 |
| C | 12 | 4 | 39283 | 570.54 | 287 | 289 | 68.3 |
| C | 10 | 65 | 31185 | 452.05 | 287 | 289 | 68.3 |
| C | 7 | 222 | 29167 | 422.53 | 287 | 289 | 68.3 |
| D | 1 | 20 | 85606 | 1242.77 | 279 | 271 | 68.7 |
| D | 13 | 223 | 78953 | 1145.88 | 279 | 271 | 68.7 |
| D | 4 | 95 | 26325 | 379.44 | 279 | 271 | 68.7 |
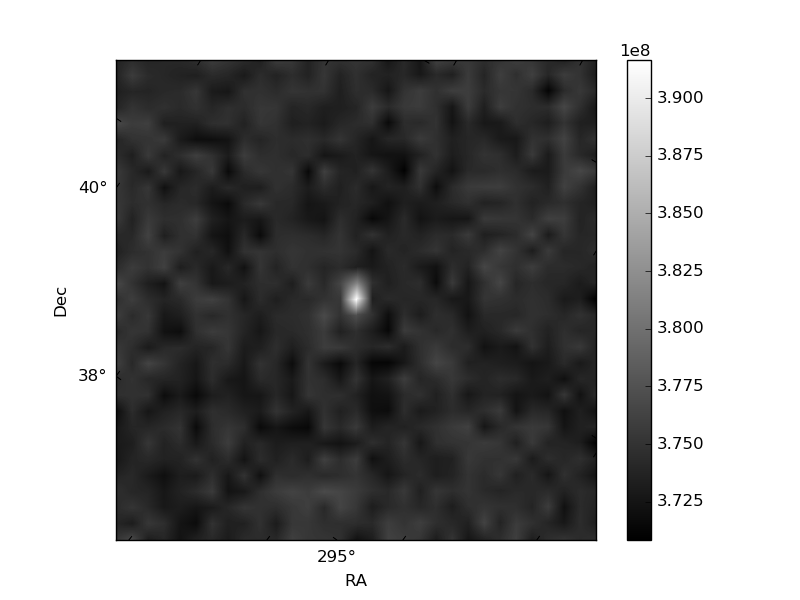
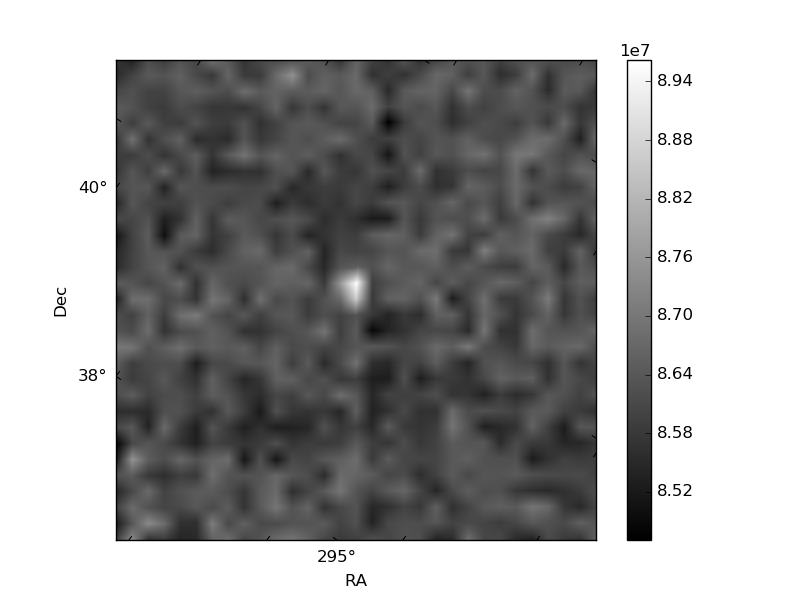
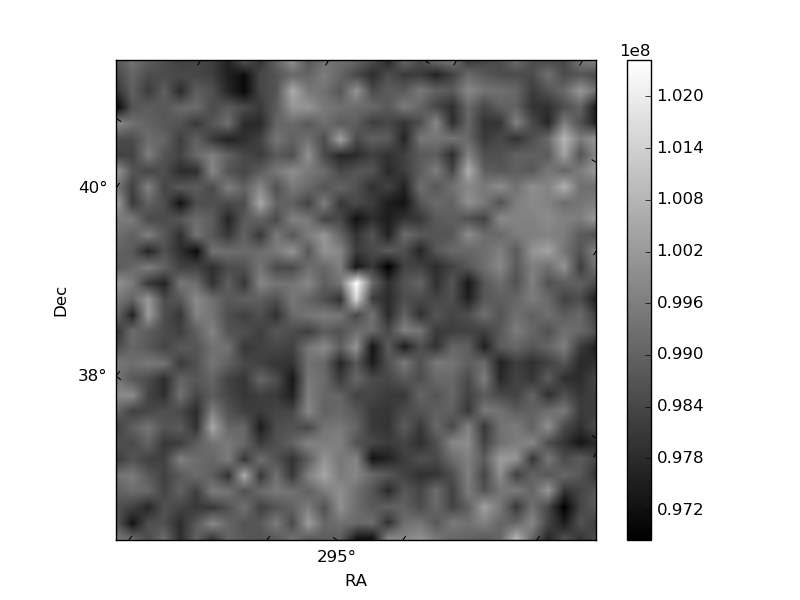
Histogram calculated using DETX and DETY for each event in the final _common_clean file
| Quadrant A | 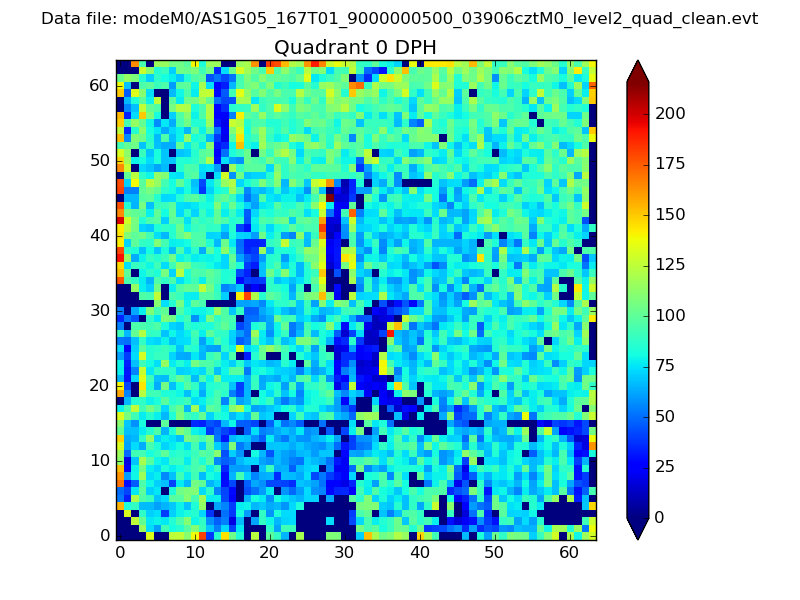 |
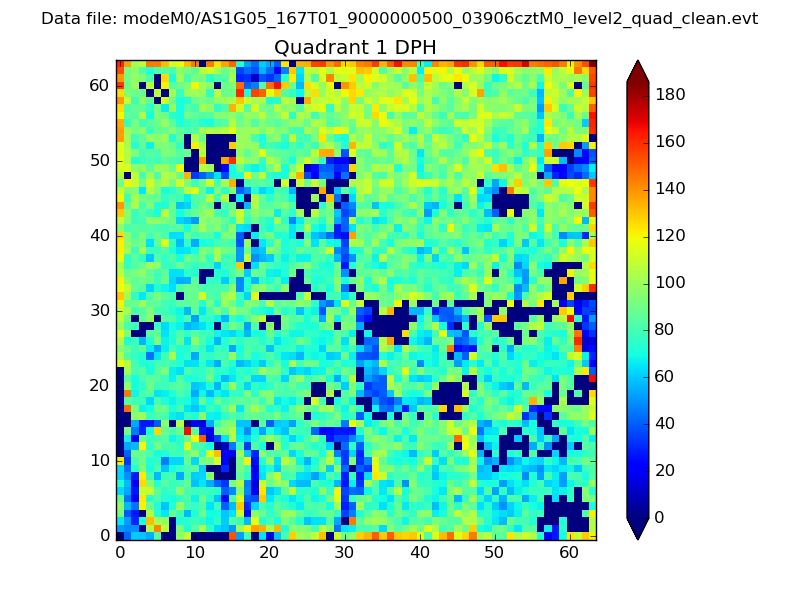 |
Quadrant B |
|---|---|---|---|
| Quadrant D | 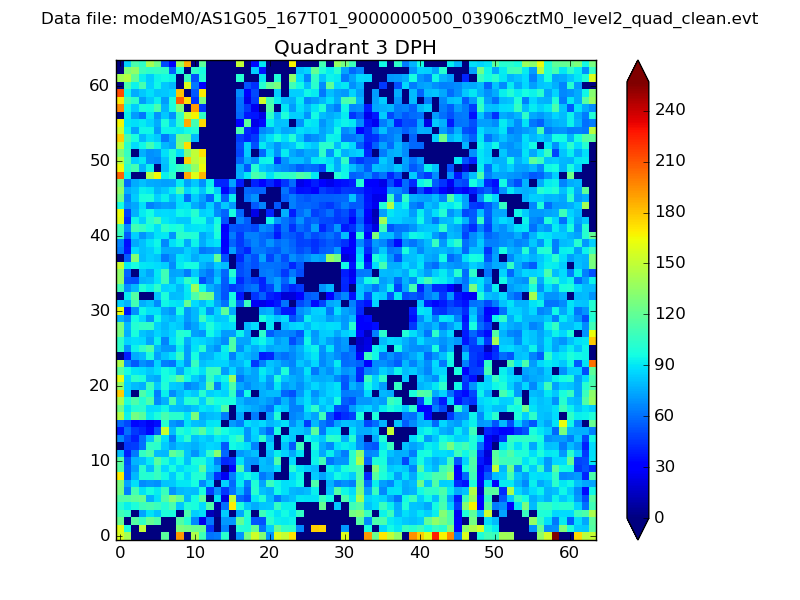 |
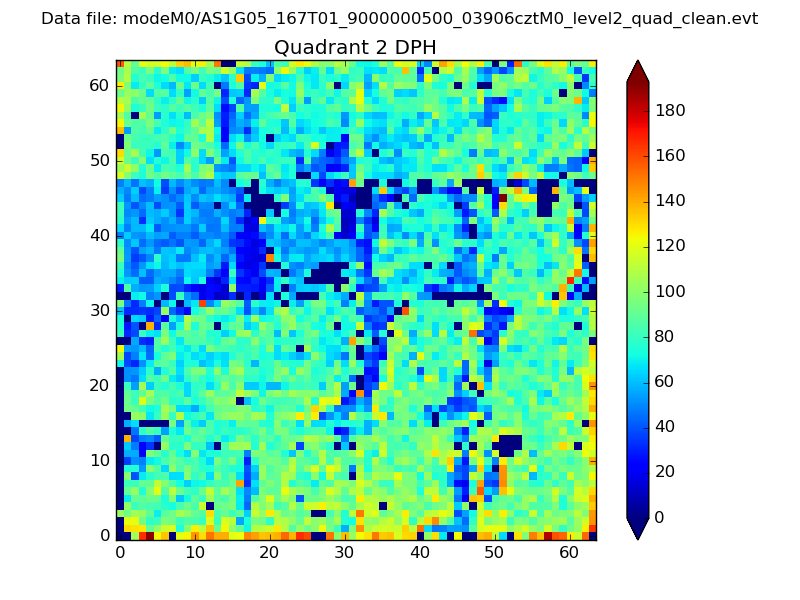 |
Quadrant C |
| Plot type | Count rate plots | Images |
|---|---|---|
| Comparison with Poisson distribution Blue bars denote a histogram of data divided into 1 sec bins. Red curve is a Poisson curve with rate = median count rate of data. |
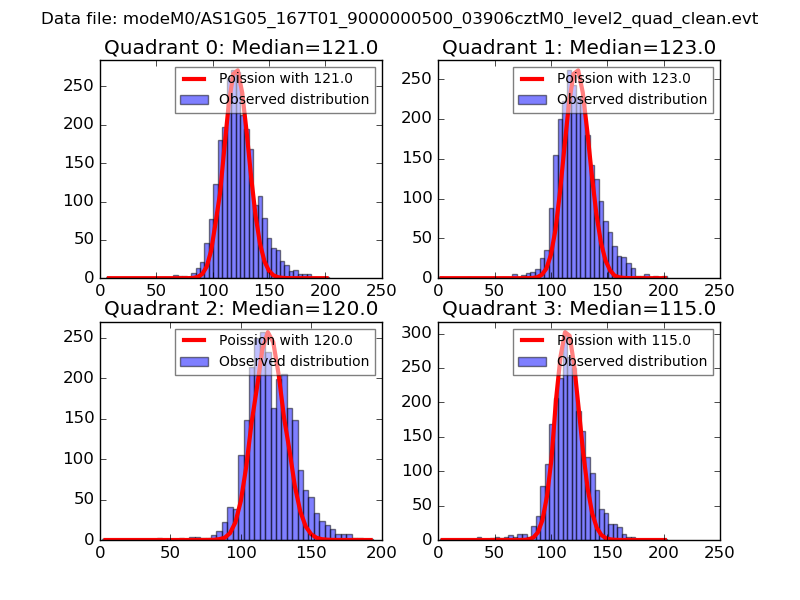 |
 |
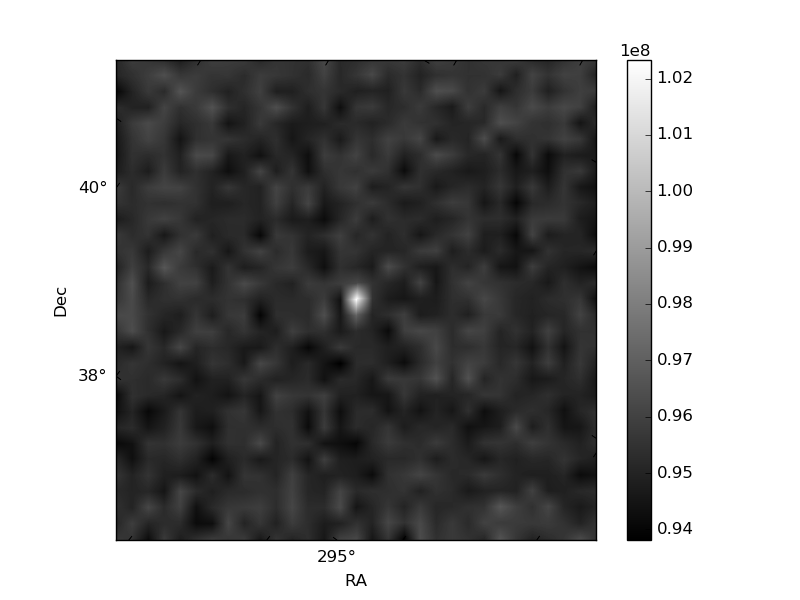
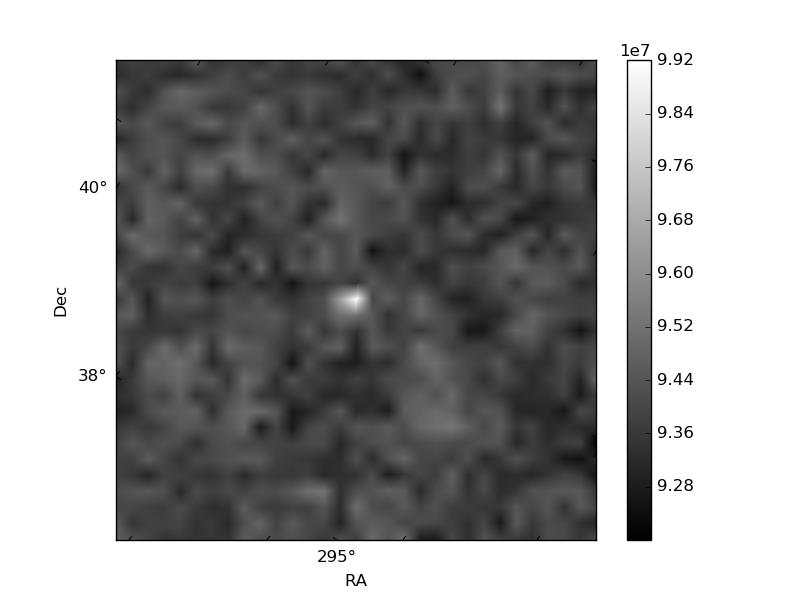
| Quadrant-wise count rates Data is divided into 100 sec bins |
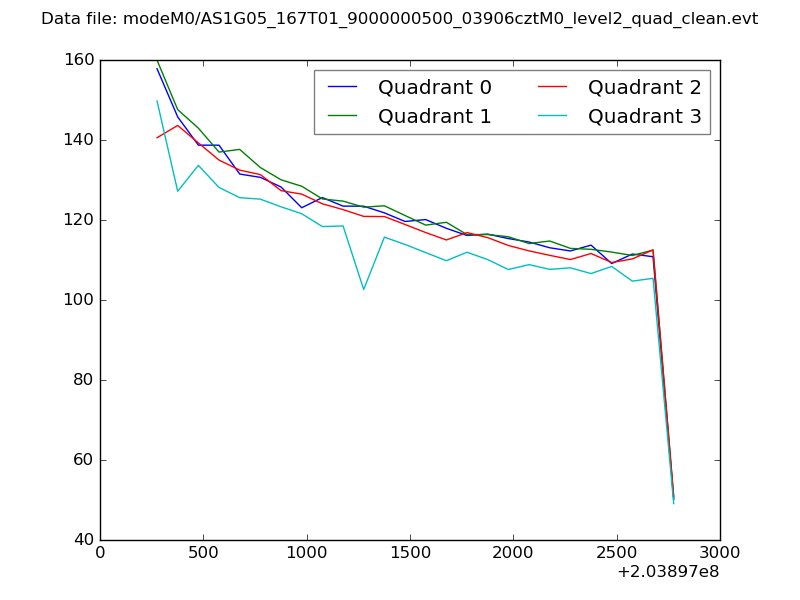 |
|
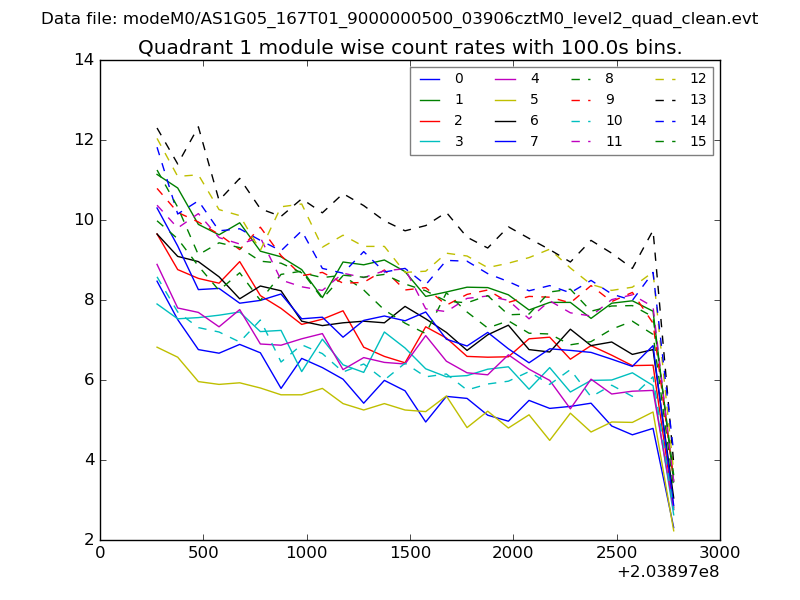
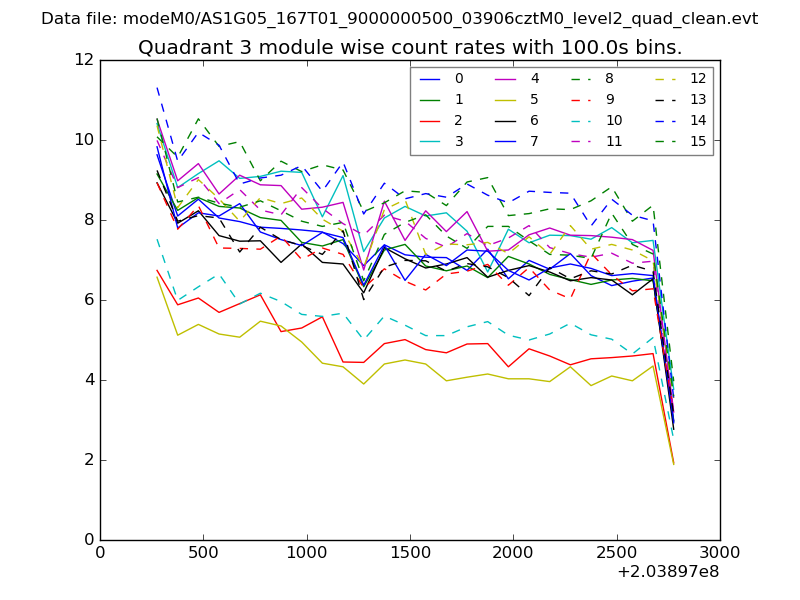
| Module-wise count rates for Quadrant A Data is divided into 100 sec bins |
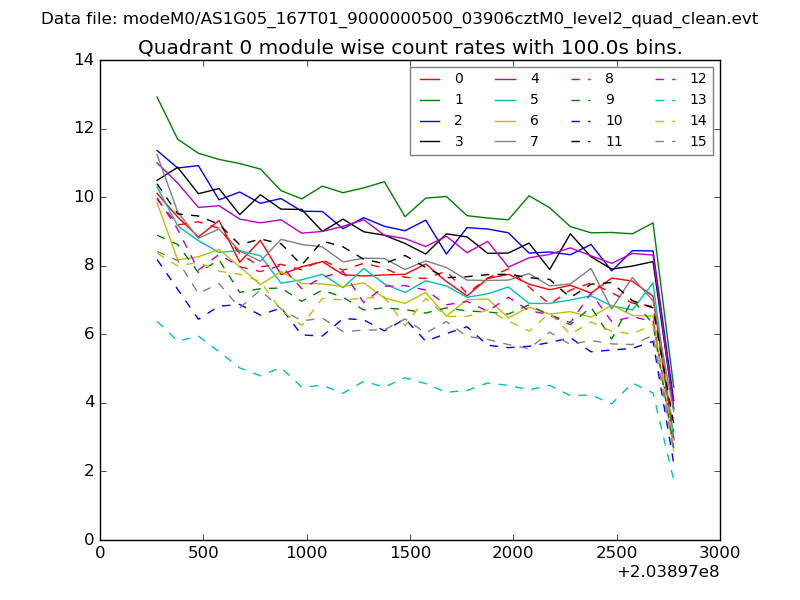 |
 |
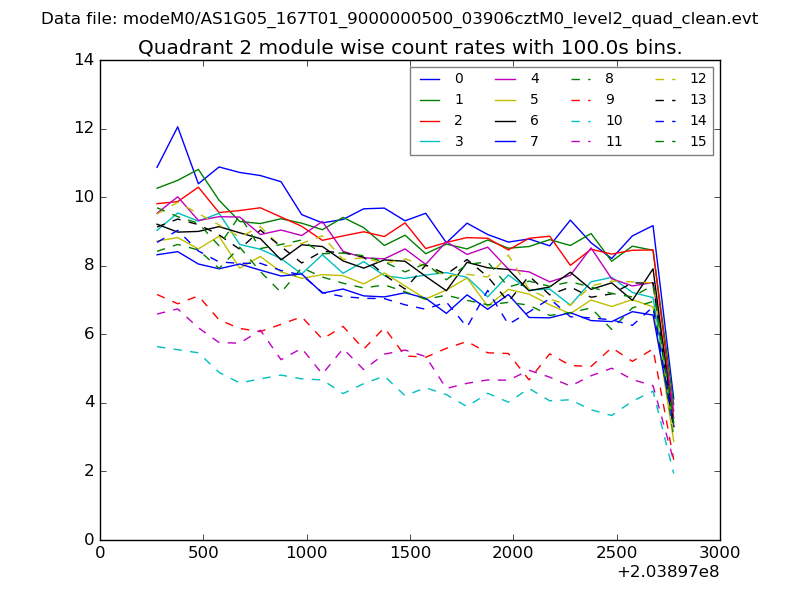
| Module-wise count rates for Quadrant B Data is divided into 100 sec bins |
 |
 |
| Module-wise count rates for Quadrant C Data is divided into 100 sec bins |
 |
 |
| Module-wise count rates for Quadrant D Data is divided into 100 sec bins |
 |
 |
| Parameter | Plot |
|---|---|
| CZT HV Monitor | 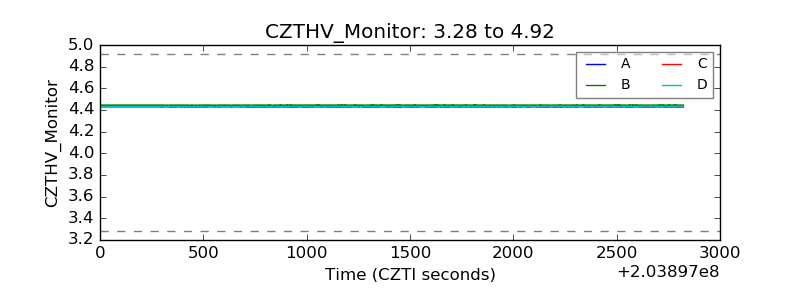 |
| D_VDD | 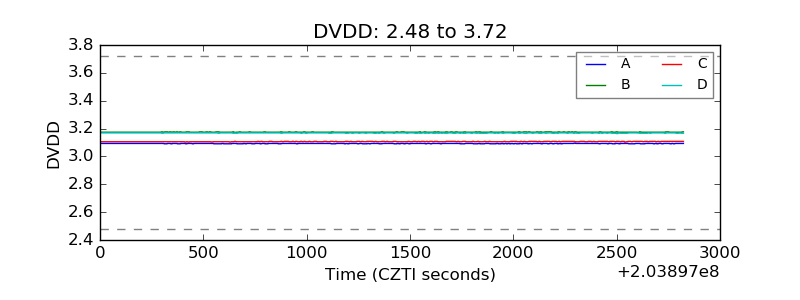 |
| Temperature 1 | 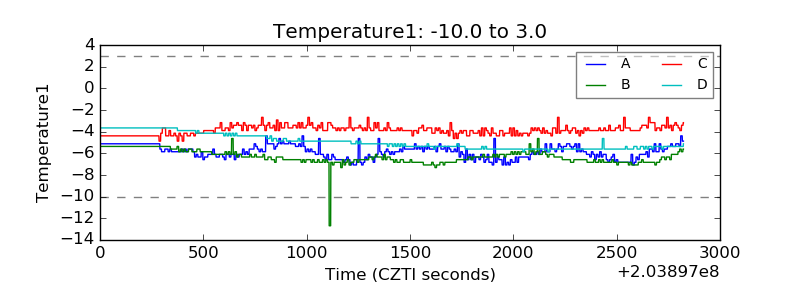 |
| Veto HV Monitor | 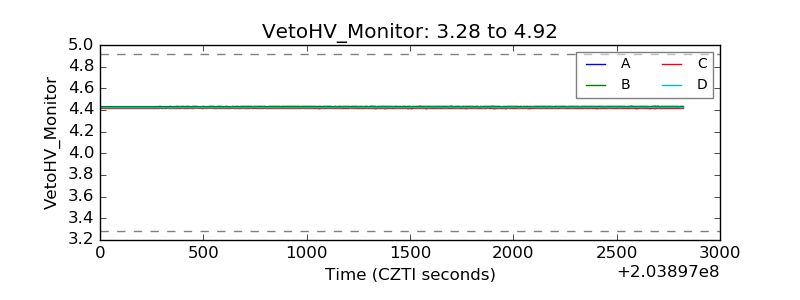 |
| Veto LLD | 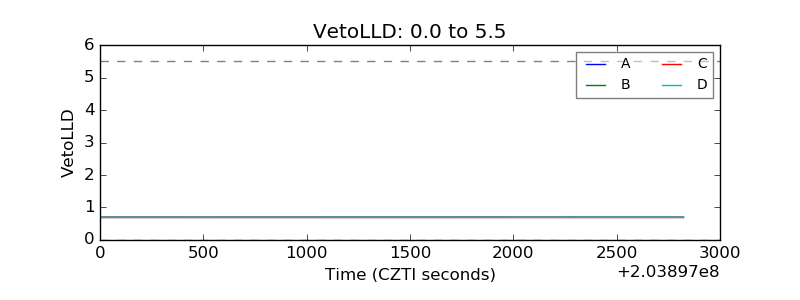 |
| Alpha Counter | 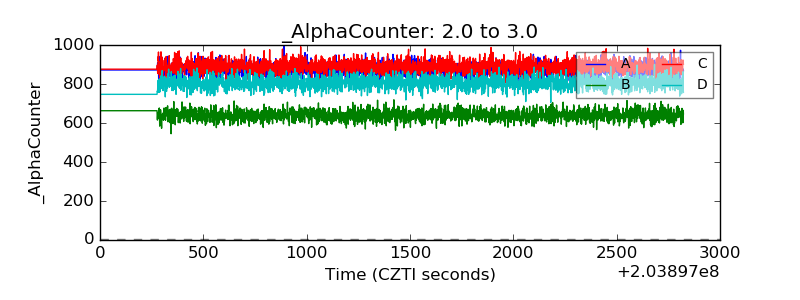 |
| _CPM_Rate | 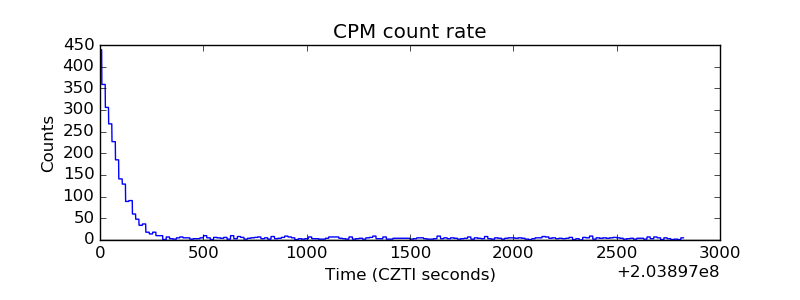 |
| CZT Counter | 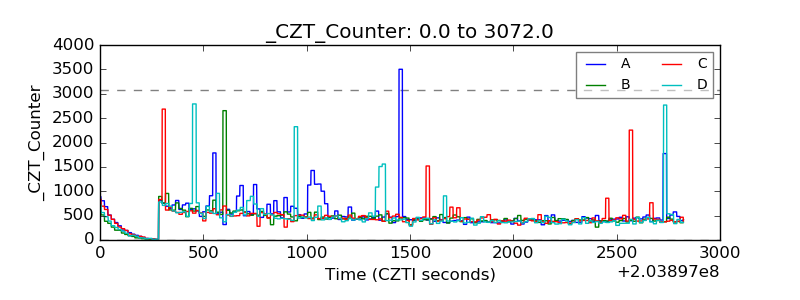 |
| +2.5 Volts monitor |  |
| +5 Volts monitor |  |
| Veto Counter | 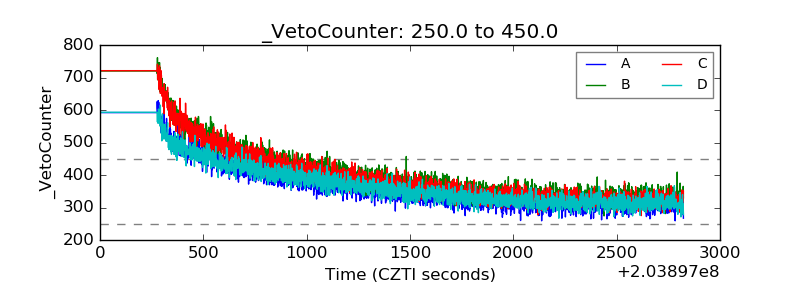 |