| Param | Original file | Final file |
|---|---|---|
| Filename | modeM0/AS1G05_172T01_9000000502cztM0_level2.fits | modeM0/AS1G05_172T01_9000000502cztM0_level2_quad_clean.evt |
| Size (bytes) | 1,923,045,120 | 2,088,771,840 |
| Size | 1.8 GB | 1.9 GB |
| Events in quadrant A | 11,458,044 | 12,643,314 |
| Events in quadrant B | 11,149,116 | 12,755,609 |
| Events in quadrant C | 11,427,392 | 12,305,096 |
| Events in quadrant D | 9,581,040 | 10,942,096 |
| Mode SS | |||
|---|---|---|---|
| Quadrant | BADHDUFLAG | Total packets | Discarded packets |
| A | 0 | 4340 | 0 |
| B | 0 | 4340 | 0 |
| C | 0 | 4338 | 0 |
| D | 0 | 4334 | 0 |
| Mode M9 | |||
|---|---|---|---|
| Quadrant | BADHDUFLAG | Total packets | Discarded packets |
| A | 0 | 307 | 0 |
| B | 0 | 307 | 0 |
| C | 0 | 307 | 0 |
| D | 0 | 308 | 0 |
| Mode M0 | |||
|---|---|---|---|
| Quadrant | BADHDUFLAG | Total packets | Discarded packets |
| A | 0 | 472552 | 0 |
| B | 0 | 477360 | 0 |
| C | 0 | 438080 | 0 |
| D | 0 | 555928 | 0 |
| Quadrant | Total seconds | Saturated seconds | Saturation percentage |
|---|---|---|---|
| A | 213418 | 4456 | 2.087921% |
| B | 213415 | 3597 | 1.685449% |
| C | 213410 | 1683 | 0.788623% |
| D | 213373 | 10595 | 4.965483% |
Noise dominated data is calculated using 1-second bins in cleaned event files. If a bin has >2000 counts, and if more than 50% of those come from <1% of pixels, then it is considered to be noise-dominated and hence unusable.
| Quadrant | # 1 sec bins | Bins with >0 counts | Bins with >2000 counts | High rate bins dominated by noise | Noise dominated (total time) | Noise dominated (detector-on time) | Marked lightcurve |
|---|---|---|---|---|---|---|---|
| A | 245172 | 213485 | 0 | 0 | 0.00% | 0.00% |  |
| B | 245172 | 213501 | 0 | 0 | 0.00% | 0.00% |  |
| C | 245172 | 213504 | 0 | 0 | 0.00% | 0.00% | 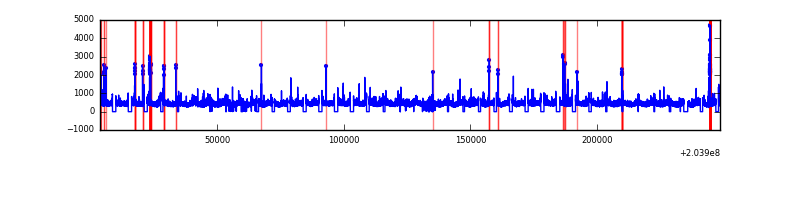 |
| D | 245172 | 213415 | 0 | 0 | 0.00% | 0.00% |  |
Top three noisy pixels from each quadrant. If the there are fewer than three noisy pixels in the level2.evt file, extra rows are filled as -1
| Pixel properties | Quadrant properties | ||||||
|---|---|---|---|---|---|---|---|
| Quadrant | DetID | PixID | Counts | Sigma | Mean | Median | Sigma |
| A | 0 | 29 | 11247 | 11.02 | 2981 | 2787 | 767.9 |
| A | 7 | 110 | 9669 | 8.96 | 2981 | 2787 | 767.9 |
| A | 0 | 30 | 8723 | 7.73 | 2981 | 2787 | 767.9 |
| B | 2 | 9 | 9646 | 11.73 | 2947 | 2803 | 583.5 |
| B | 12 | 226 | 8220 | 9.28 | 2947 | 2803 | 583.5 |
| B | 14 | 254 | 7759 | 8.49 | 2947 | 2803 | 583.5 |
| C | 1 | 80 | 8147 | 6.69 | 3019 | 2789 | 800.5 |
| C | 1 | 81 | 7974 | 6.48 | 3019 | 2789 | 800.5 |
| C | 2 | 191 | 7708 | 6.15 | 3019 | 2789 | 800.5 |
| D | 11 | 82 | 8363 | 8.0 | 2740 | 2481 | 735.2 |
| D | 3 | 14 | 7347 | 6.62 | 2740 | 2481 | 735.2 |
| D | 6 | 83 | 7087 | 6.27 | 2740 | 2481 | 735.2 |
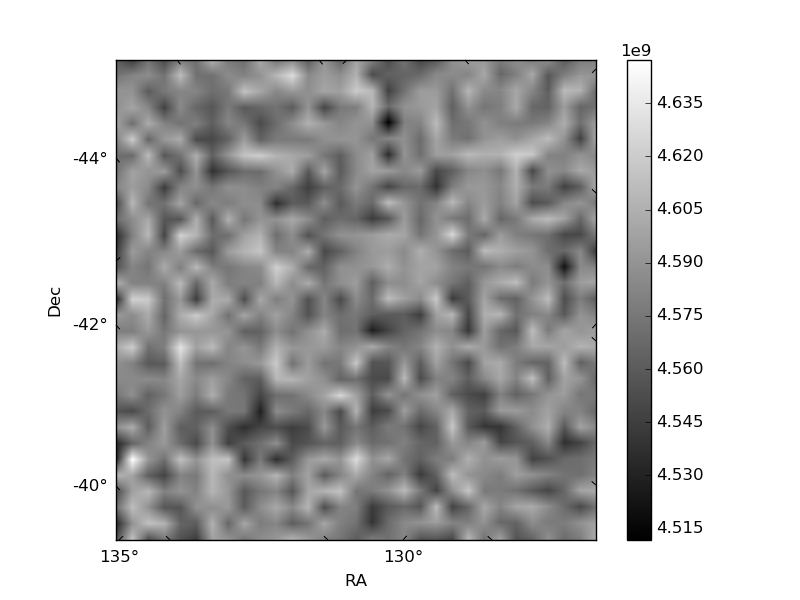
Histogram calculated using DETX and DETY for each event in the final _common_clean file
| Quadrant A | 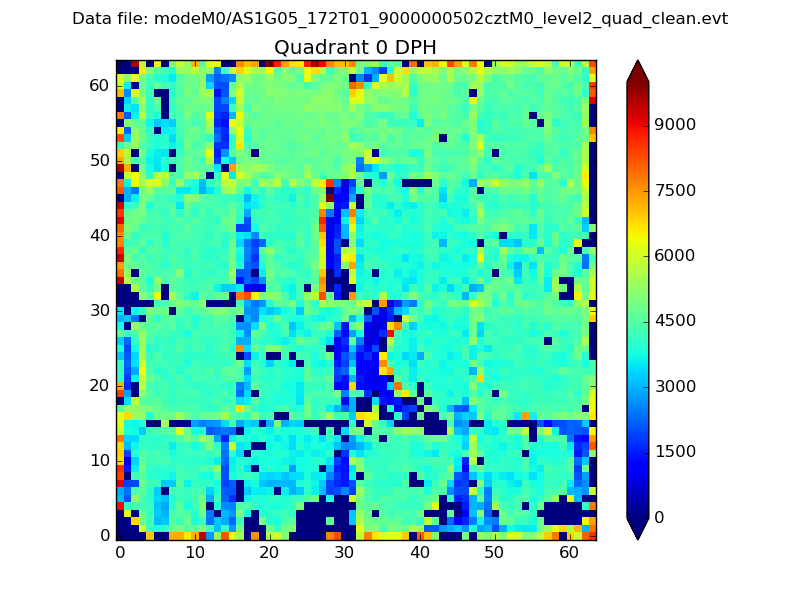 |
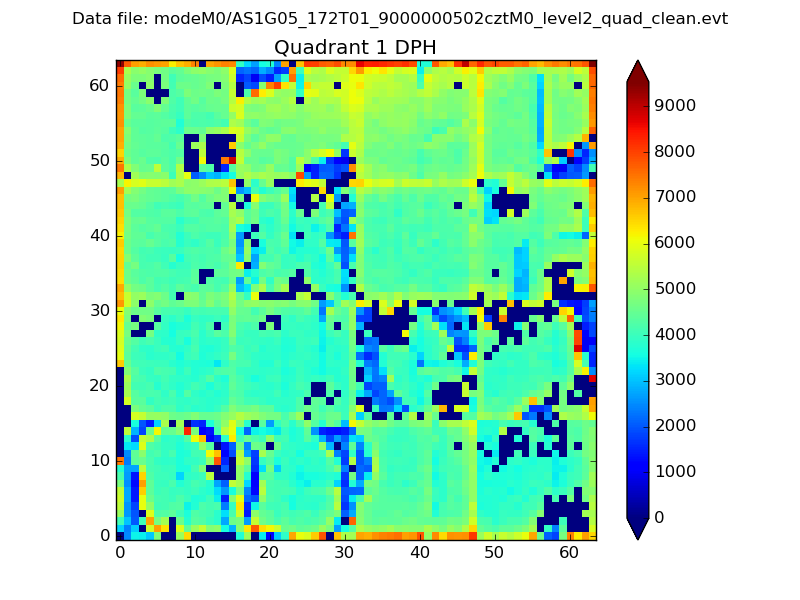 |
Quadrant B |
|---|---|---|---|
| Quadrant D |  |
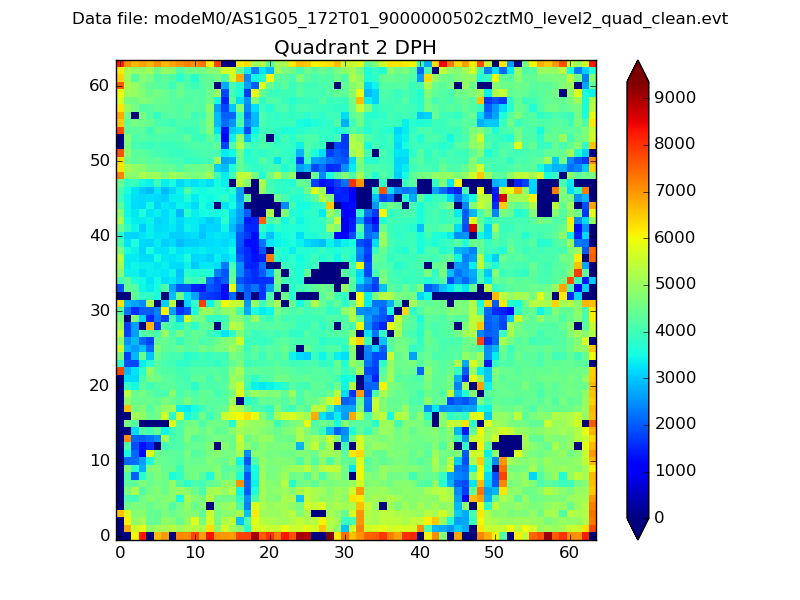 |
Quadrant C |
| Plot type | Count rate plots | Images |
|---|---|---|
| Comparison with Poisson distribution Blue bars denote a histogram of data divided into 1 sec bins. Red curve is a Poisson curve with rate = median count rate of data. |
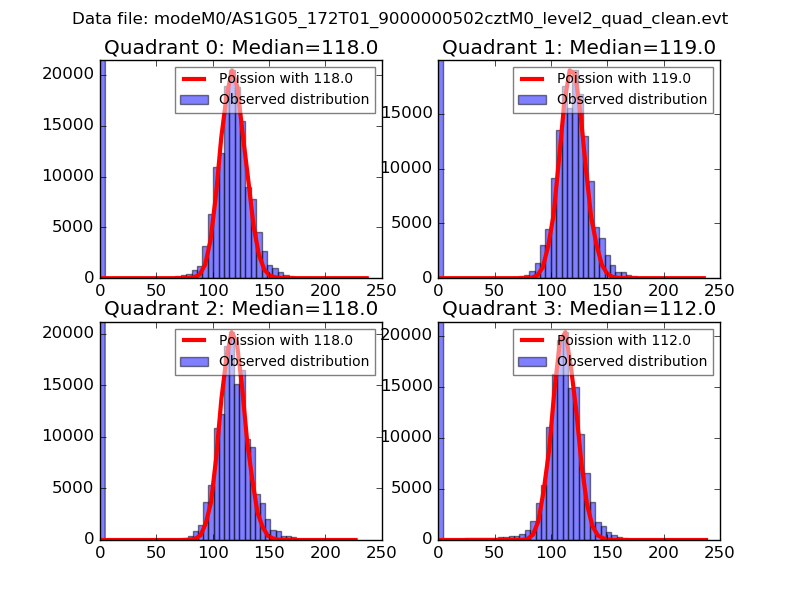 |
 |
| Quadrant-wise count rates Data is divided into 100 sec bins |
 |
|
| Module-wise count rates for Quadrant A Data is divided into 100 sec bins |
 |
 |
| Module-wise count rates for Quadrant B Data is divided into 100 sec bins |
 |
 |
| Module-wise count rates for Quadrant C Data is divided into 100 sec bins |
 |
 |
| Module-wise count rates for Quadrant D Data is divided into 100 sec bins |
 |
 |
| Parameter | Plot |
|---|---|
| CZT HV Monitor |  |
| D_VDD | 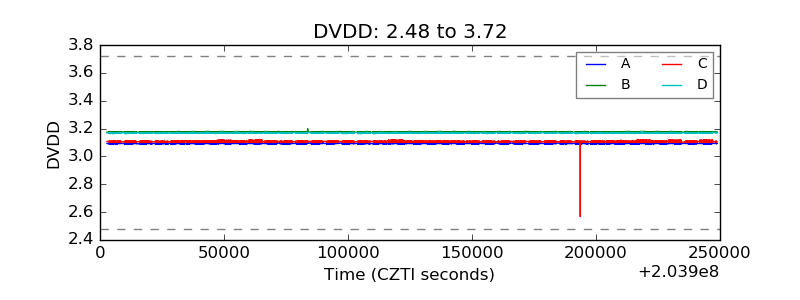 |
| Temperature 1 |  |
| Veto HV Monitor |  |
| Veto LLD | 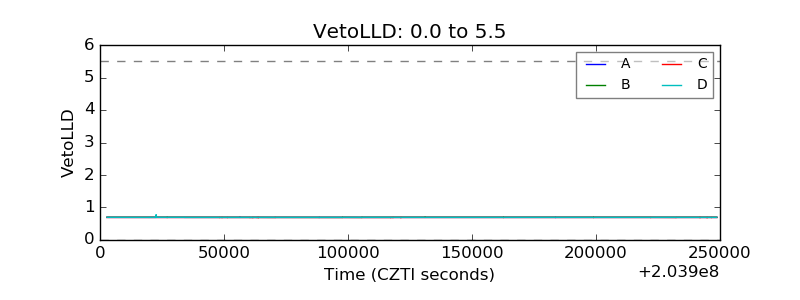 |
| Alpha Counter | 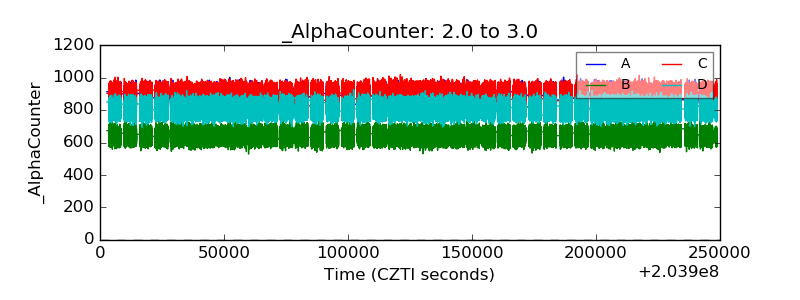 |
| _CPM_Rate |  |
| CZT Counter |  |
| +2.5 Volts monitor |  |
| +5 Volts monitor |  |
| _ROLL_ROT | 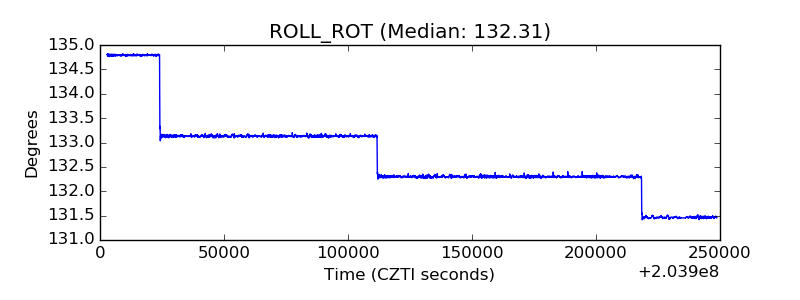 |
| _Roll_DEC | 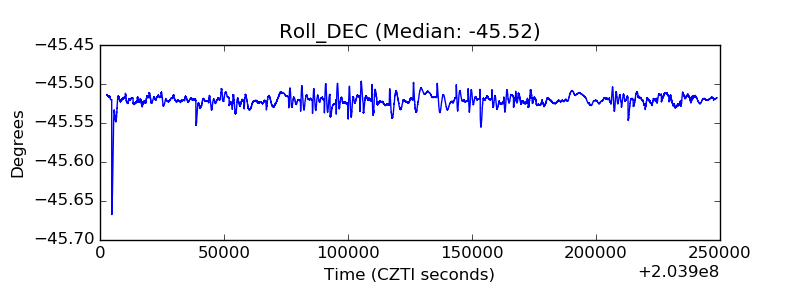 |
| _Roll_RA |  |
| Veto Counter |  |