| Param | Original file | Final file |
|---|---|---|
| Filename | modeM0/AS1G05_172T01_9000000502_03907cztM0_level2.evt | modeM0/AS1G05_172T01_9000000502_03907cztM0_level2_quad_clean.evt |
| Size (bytes) | 471,651,840 | 56,067,840 |
| Size | 449.8 MB | 53.5 MB |
| Events in quadrant A | 3,069,343 | 318,084 |
| Events in quadrant B | 3,176,182 | 325,022 |
| Events in quadrant C | 3,122,328 | 319,655 |
| Events in quadrant D | 4,497,634 | 304,430 |
| Mode SS | |||
|---|---|---|---|
| Quadrant | BADHDUFLAG | Total packets | Discarded packets |
| A | 0 | 126 | 0 |
| B | 0 | 126 | 0 |
| C | 0 | 126 | 0 |
| D | 0 | 126 | 0 |
| Mode M9 | |||
|---|---|---|---|
| Quadrant | BADHDUFLAG | Total packets | Discarded packets |
| A | 0 | 20 | 0 |
| B | 0 | 20 | 0 |
| C | 0 | 20 | 0 |
| D | 0 | 21 | 0 |
| Mode M0 | |||
|---|---|---|---|
| Quadrant | BADHDUFLAG | Total packets | Discarded packets |
| A | 0 | 13102 | 3 |
| B | 0 | 13253 | 2 |
| C | 0 | 13408 | 2 |
| D | 0 | 17686 | 2 |
| Quadrant | Total seconds | Saturated seconds | Saturation percentage |
|---|---|---|---|
| A | 6158 | 32 | 0.519649% |
| B | 6158 | 45 | 0.730757% |
| C | 6158 | 44 | 0.714518% |
| D | 6158 | 598 | 9.710945% |
Noise dominated data is calculated using 1-second bins in cleaned event files. If a bin has >2000 counts, and if more than 50% of those come from <1% of pixels, then it is considered to be noise-dominated and hence unusable.
| Quadrant | # 1 sec bins | Bins with >0 counts | Bins with >2000 counts | High rate bins dominated by noise | Noise dominated (total time) | Noise dominated (detector-on time) | Marked lightcurve |
|---|---|---|---|---|---|---|---|
| A | 7498 | 6159 | 4 | 4 | 0.05% | 0.06% | 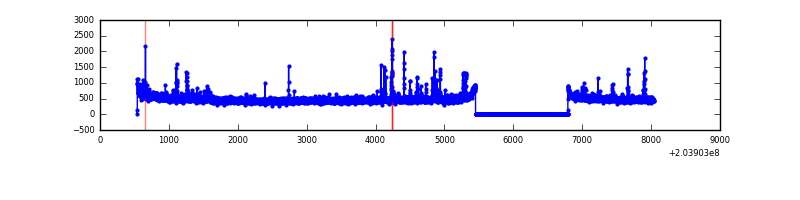 |
| B | 7498 | 6159 | 0 | 0 | 0.00% | 0.00% | 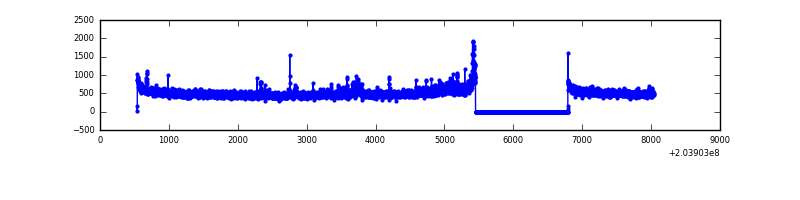 |
| C | 7498 | 6159 | 10 | 10 | 0.13% | 0.16% | 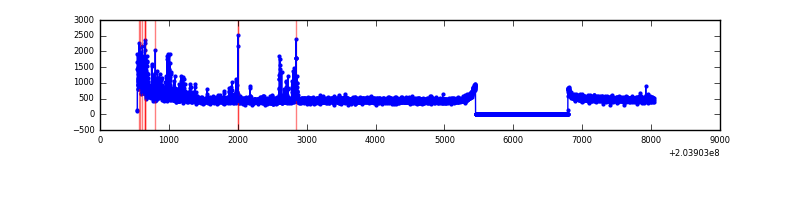 |
| D | 7498 | 6159 | 605 | 605 | 8.07% | 9.82% | 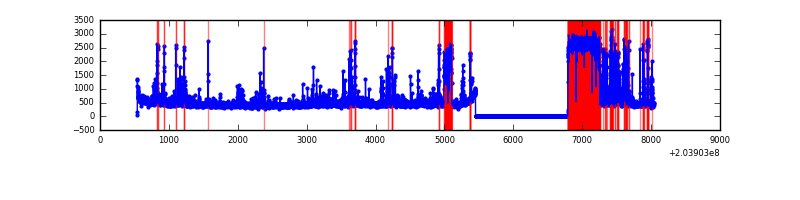 |
Top three noisy pixels from each quadrant. If the there are fewer than three noisy pixels in the level2.evt file, extra rows are filled as -1
| Pixel properties | Quadrant properties | ||||||
|---|---|---|---|---|---|---|---|
| Quadrant | DetID | PixID | Counts | Sigma | Mean | Median | Sigma |
| A | 0 | 118 | 87968 | 578.55 | 743 | 729 | 150.8 |
| A | 8 | 15 | 47120 | 307.65 | 743 | 729 | 150.8 |
| A | 0 | 50 | 32473 | 210.52 | 743 | 729 | 150.8 |
| B | 15 | 204 | 151568 | 1058.75 | 758 | 741 | 142.5 |
| B | 14 | 167 | 85664 | 596.13 | 758 | 741 | 142.5 |
| B | 12 | 111 | 11429 | 75.03 | 758 | 741 | 142.5 |
| C | 9 | 247 | 238527 | 1432.51 | 724 | 728 | 166.0 |
| C | 10 | 65 | 50667 | 300.84 | 724 | 728 | 166.0 |
| C | 13 | 61 | 6186 | 32.88 | 724 | 728 | 166.0 |
| D | 2 | 32 | 1370054 | 8431.59 | 673 | 655 | 162.4 |
| D | 13 | 239 | 181496 | 1113.46 | 673 | 655 | 162.4 |
| D | 13 | 223 | 137455 | 842.3 | 673 | 655 | 162.4 |
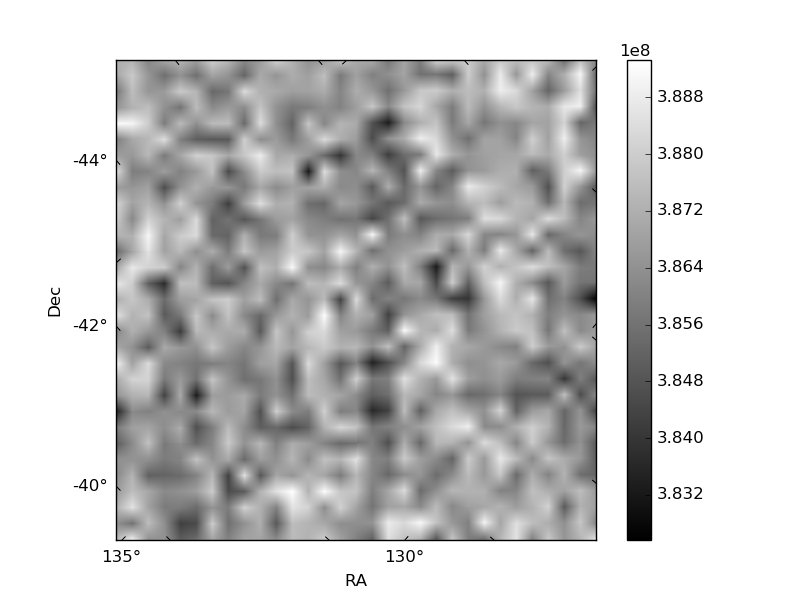
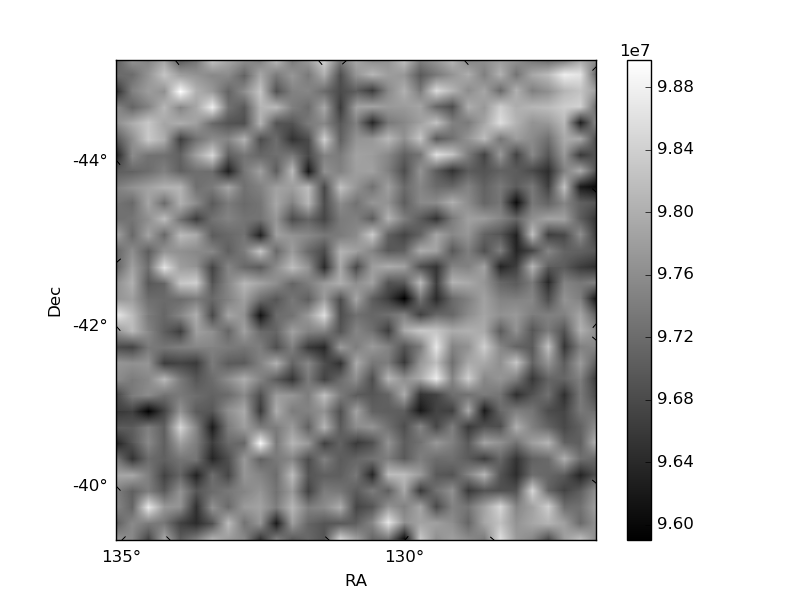
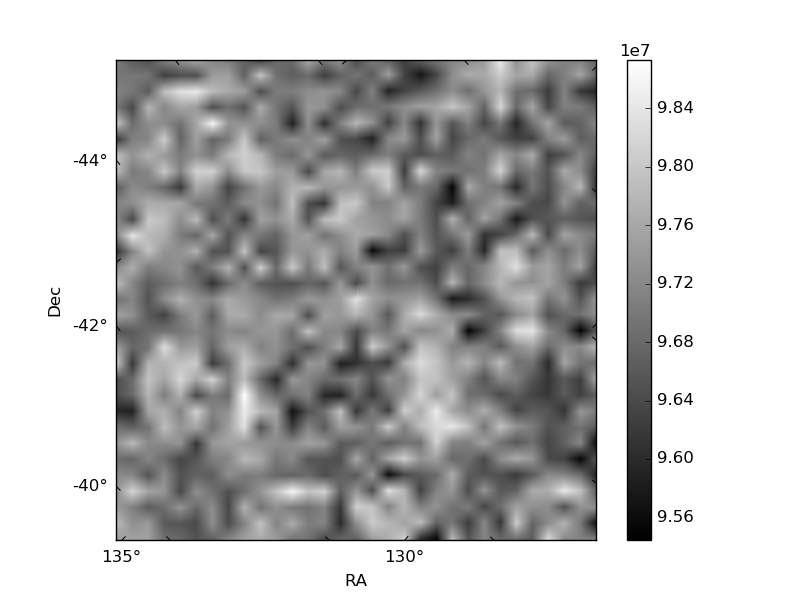
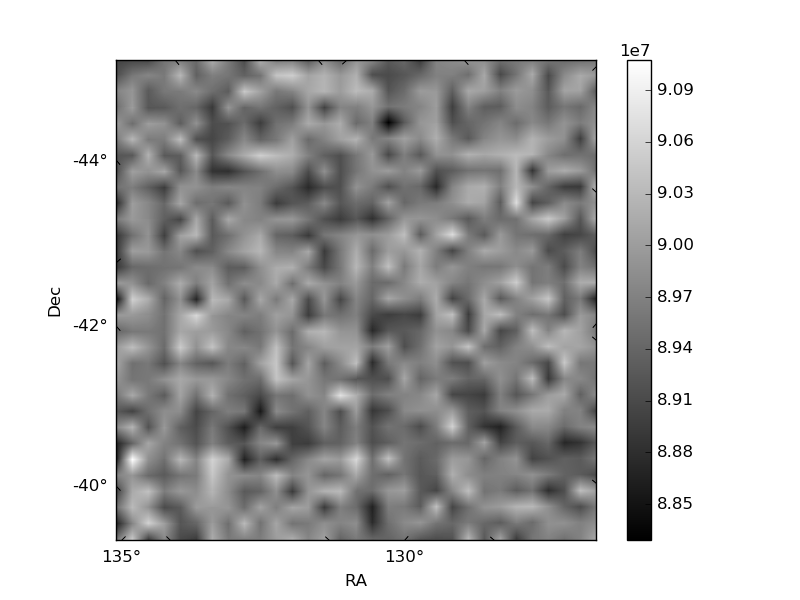
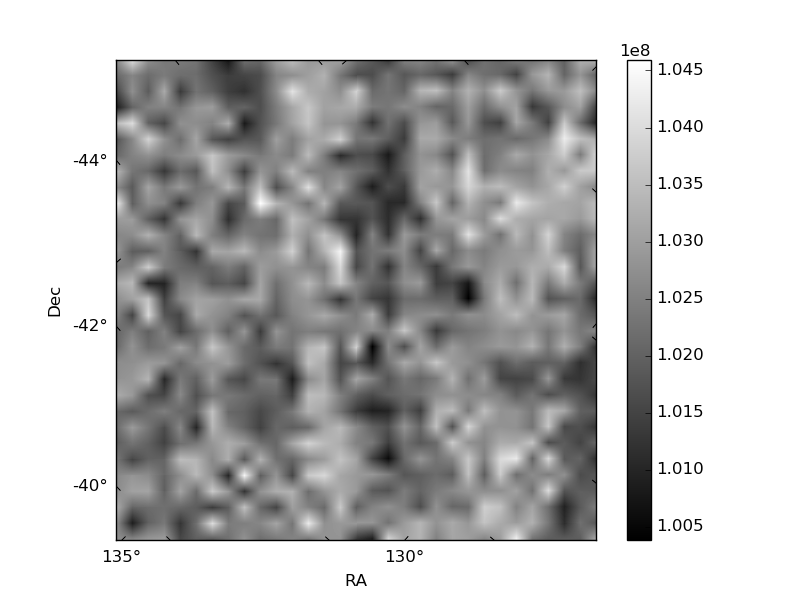
Histogram calculated using DETX and DETY for each event in the final _common_clean file
| Quadrant A | 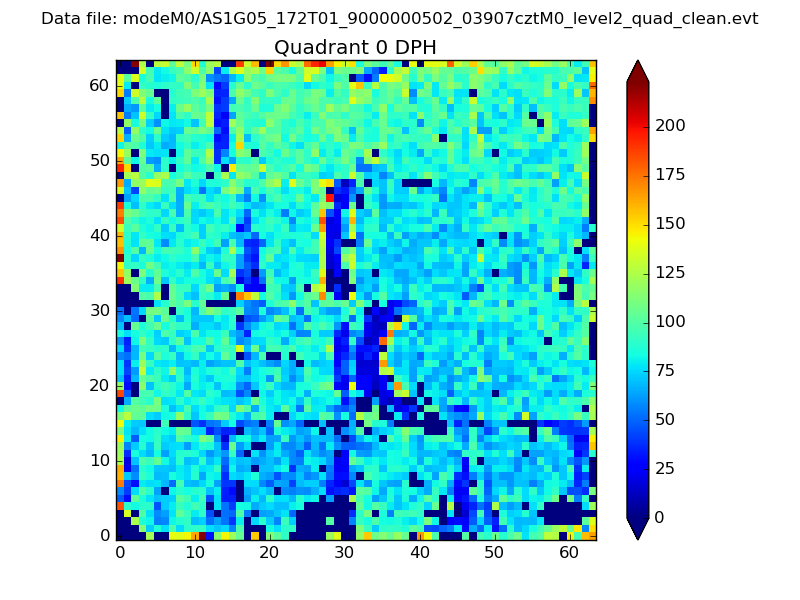 |
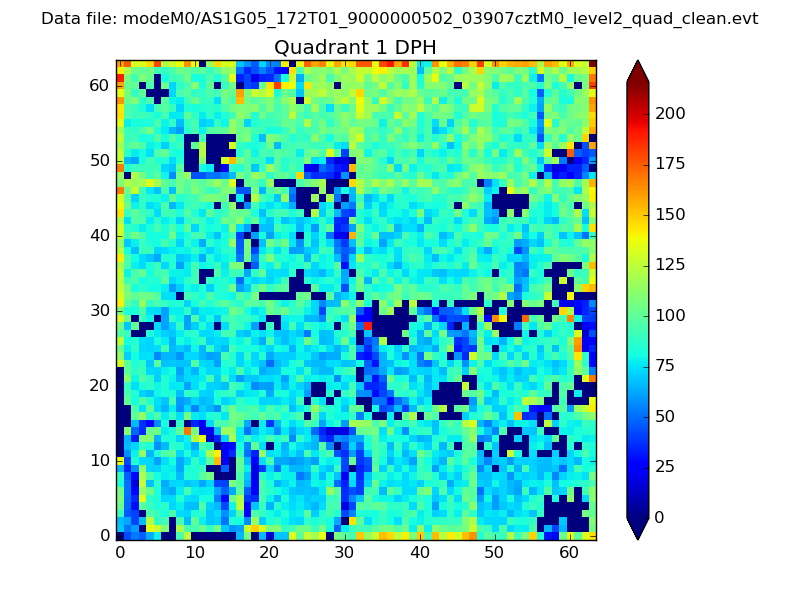 |
Quadrant B |
|---|---|---|---|
| Quadrant D | 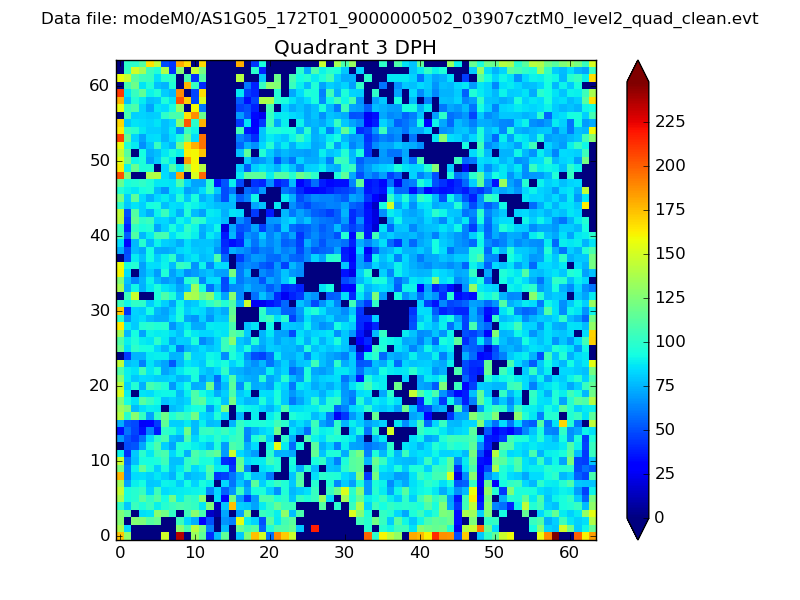 |
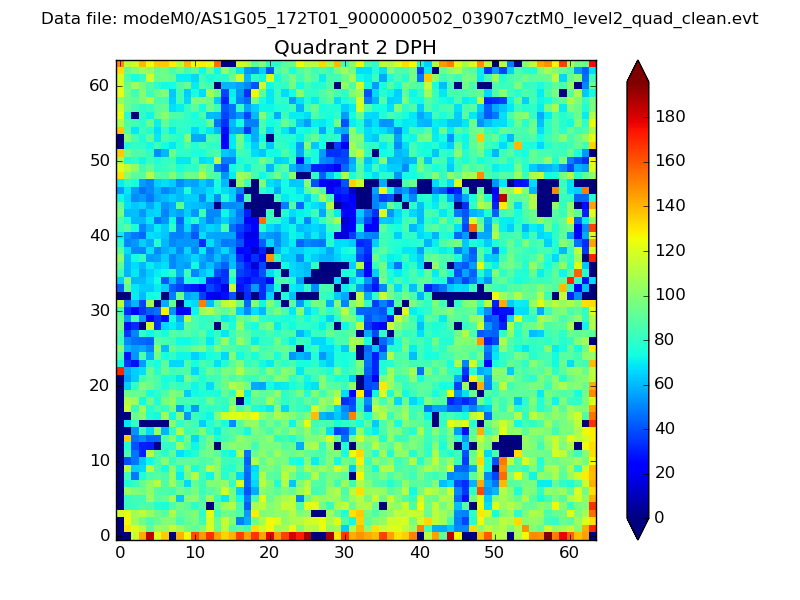 |
Quadrant C |
| Plot type | Count rate plots | Images |
|---|---|---|
| Comparison with Poisson distribution Blue bars denote a histogram of data divided into 1 sec bins. Red curve is a Poisson curve with rate = median count rate of data. |
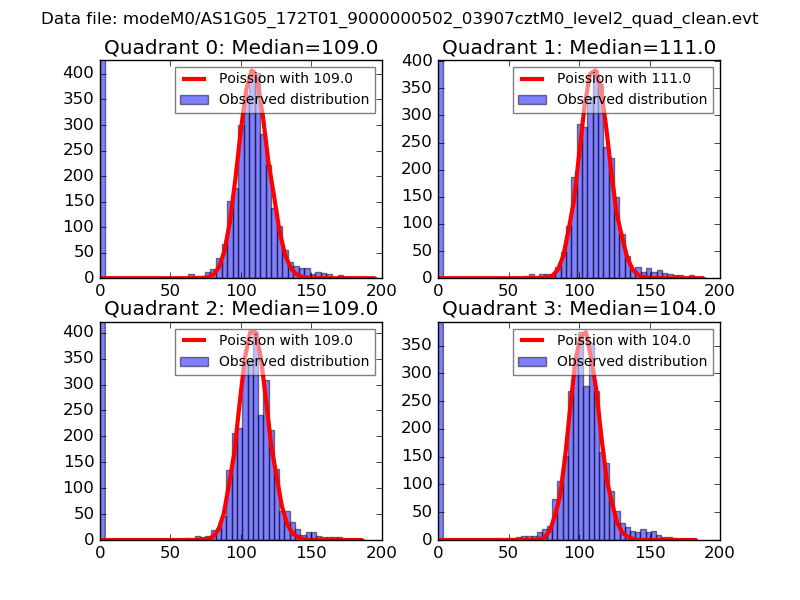 |
 |
| Quadrant-wise count rates Data is divided into 100 sec bins |
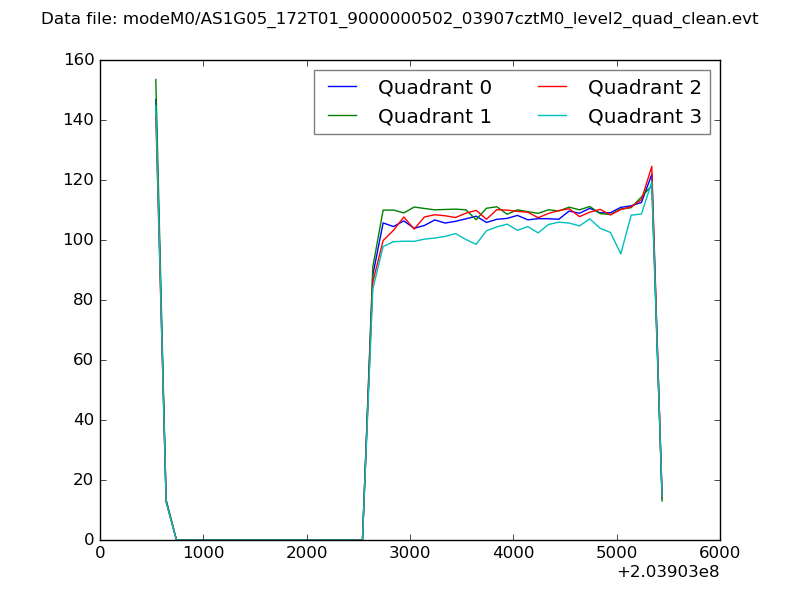 |
|
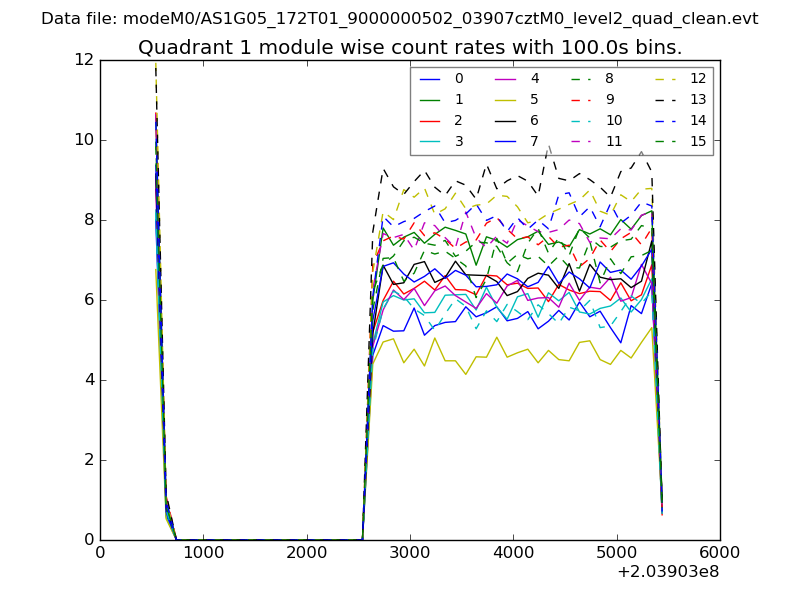
| Module-wise count rates for Quadrant A Data is divided into 100 sec bins |
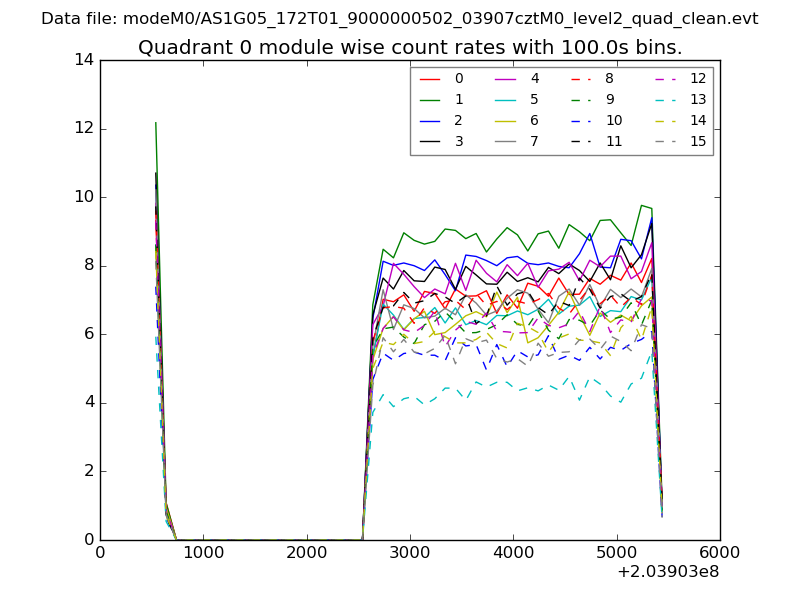 |
 |
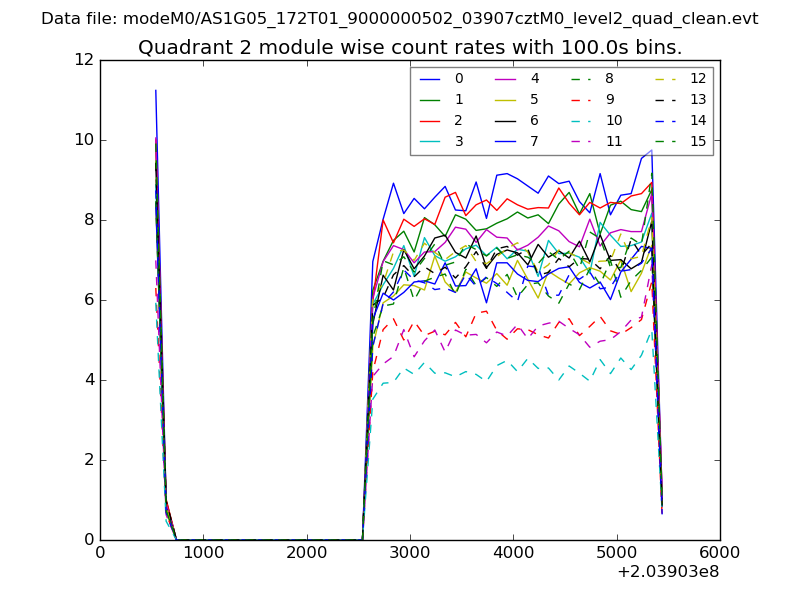
| Module-wise count rates for Quadrant B Data is divided into 100 sec bins |
 |
 |
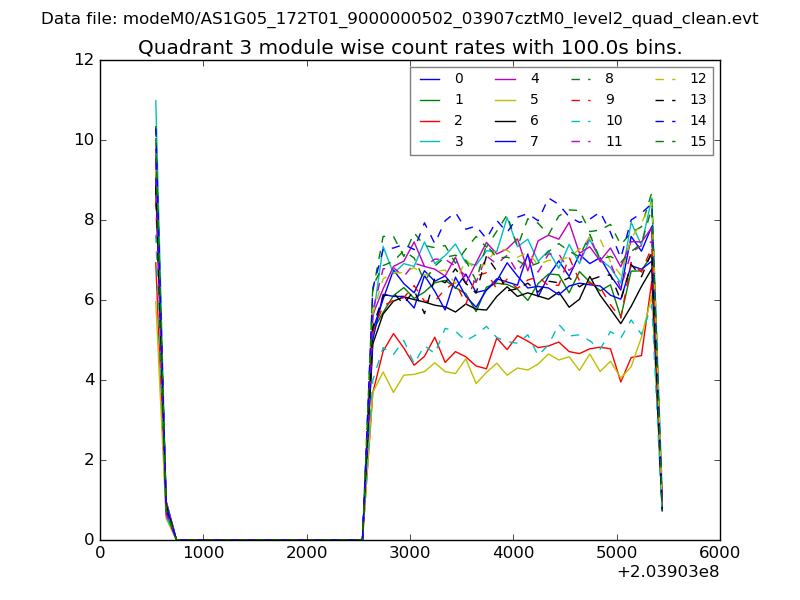
| Module-wise count rates for Quadrant C Data is divided into 100 sec bins |
 |
 |
| Module-wise count rates for Quadrant D Data is divided into 100 sec bins |
 |
 |
| Parameter | Plot |
|---|---|
| CZT HV Monitor | 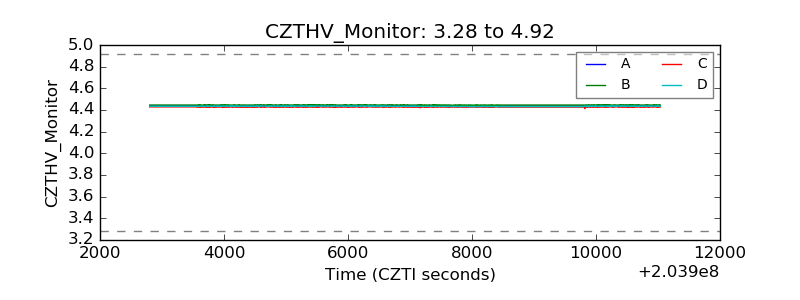 |
| D_VDD | 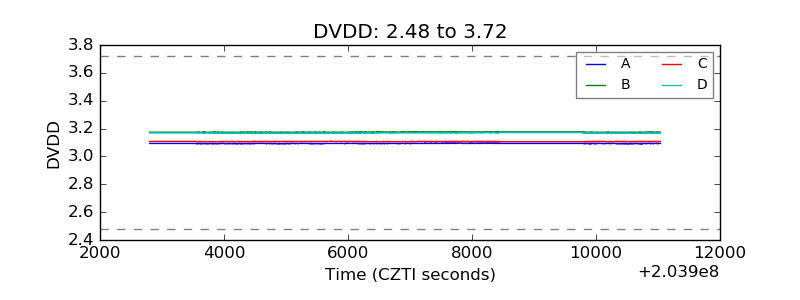 |
| Temperature 1 | 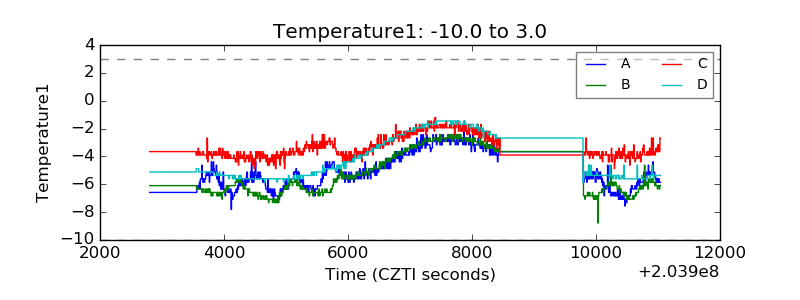 |
| Veto HV Monitor |  |
| Veto LLD | 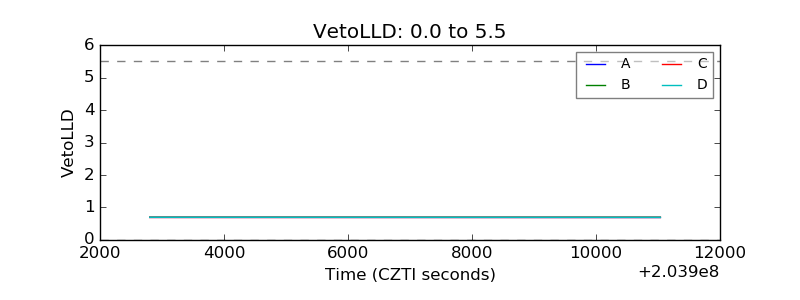 |
| Alpha Counter | 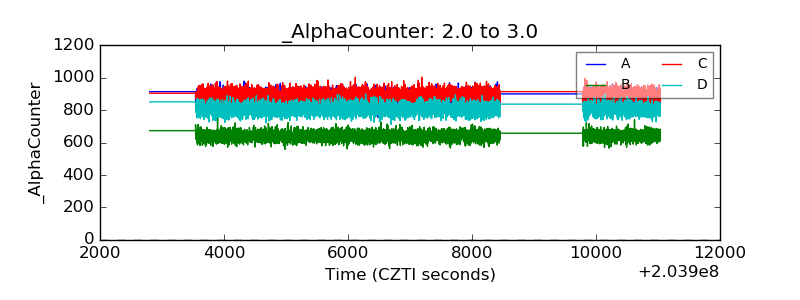 |
| _CPM_Rate | 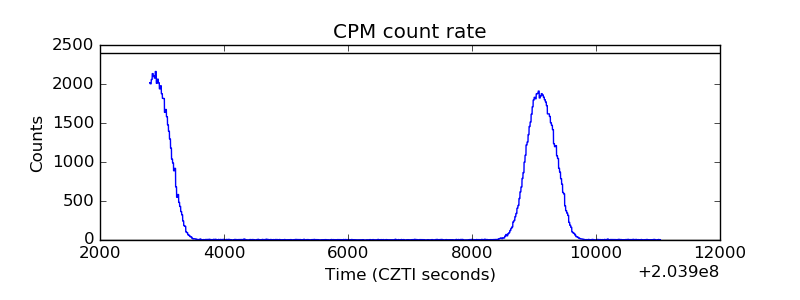 |
| CZT Counter | 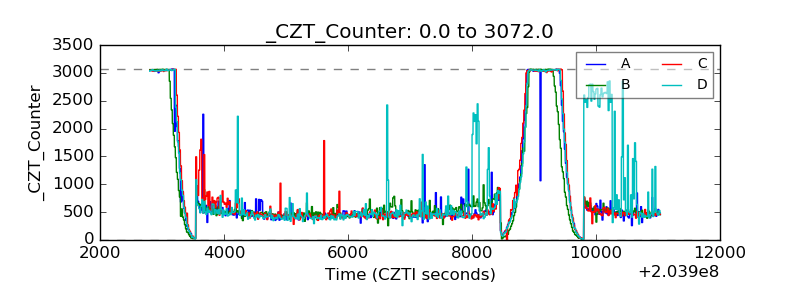 |
| +2.5 Volts monitor |  |
| +5 Volts monitor |  |
| Veto Counter | 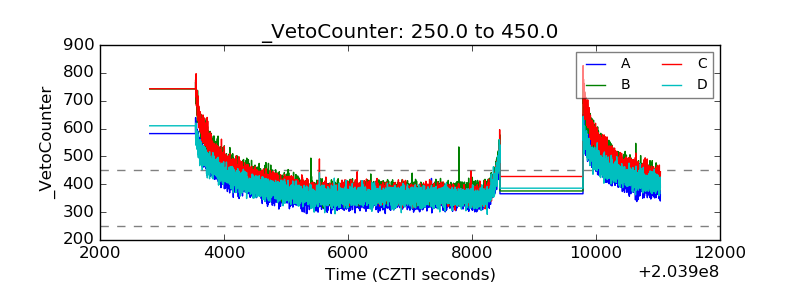 |