| Param | Original file | Final file |
|---|---|---|
| Filename | modeM0/AS1G05_172T01_9000000502_03908cztM0_level2.evt | modeM0/AS1G05_172T01_9000000502_03908cztM0_level2_quad_clean.evt |
| Size (bytes) | 464,374,080 | 64,578,240 |
| Size | 442.9 MB | 61.6 MB |
| Events in quadrant A | 3,184,421 | 380,882 |
| Events in quadrant B | 3,316,336 | 385,592 |
| Events in quadrant C | 2,965,016 | 383,777 |
| Events in quadrant D | 4,169,583 | 365,133 |
| Mode SS | |||
|---|---|---|---|
| Quadrant | BADHDUFLAG | Total packets | Discarded packets |
| A | 0 | 128 | 0 |
| B | 0 | 128 | 0 |
| C | 0 | 128 | 0 |
| D | 0 | 128 | 0 |
| Mode M9 | |||
|---|---|---|---|
| Quadrant | BADHDUFLAG | Total packets | Discarded packets |
| A | 0 | 14 | 0 |
| B | 0 | 14 | 0 |
| C | 0 | 14 | 0 |
| D | 0 | 14 | 0 |
| Mode M0 | |||
|---|---|---|---|
| Quadrant | BADHDUFLAG | Total packets | Discarded packets |
| A | 0 | 13362 | 2 |
| B | 0 | 13610 | 1 |
| C | 0 | 12915 | 1 |
| D | 0 | 16721 | 1 |
| Quadrant | Total seconds | Saturated seconds | Saturation percentage |
|---|---|---|---|
| A | 6301 | 54 | 0.857007% |
| B | 6301 | 69 | 1.095064% |
| C | 6301 | 48 | 0.761784% |
| D | 6301 | 462 | 7.332169% |
Noise dominated data is calculated using 1-second bins in cleaned event files. If a bin has >2000 counts, and if more than 50% of those come from <1% of pixels, then it is considered to be noise-dominated and hence unusable.
| Quadrant | # 1 sec bins | Bins with >0 counts | Bins with >2000 counts | High rate bins dominated by noise | Noise dominated (total time) | Noise dominated (detector-on time) | Marked lightcurve |
|---|---|---|---|---|---|---|---|
| A | 7646 | 6302 | 6 | 6 | 0.08% | 0.10% | 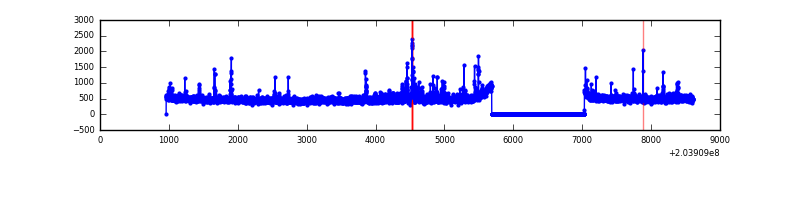 |
| B | 7646 | 6302 | 16 | 16 | 0.21% | 0.25% | 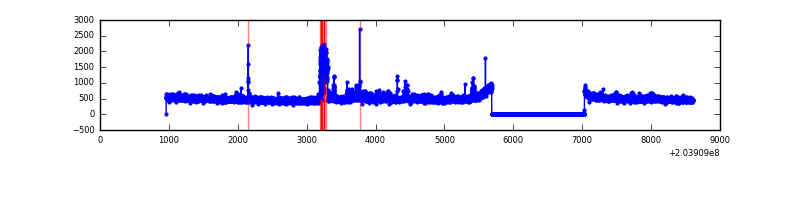 |
| C | 7646 | 6302 | 5 | 5 | 0.07% | 0.08% | 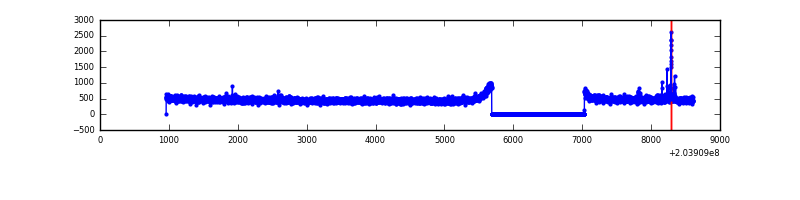 |
| D | 7646 | 6302 | 422 | 422 | 5.52% | 6.70% | 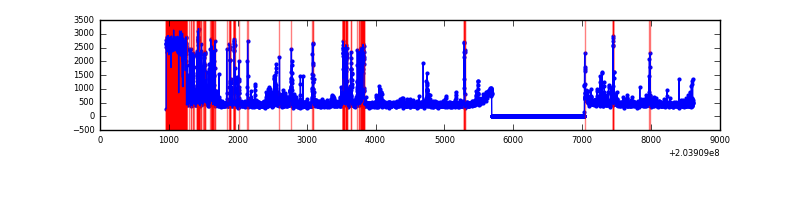 |
Top three noisy pixels from each quadrant. If the there are fewer than three noisy pixels in the level2.evt file, extra rows are filled as -1
| Pixel properties | Quadrant properties | ||||||
|---|---|---|---|---|---|---|---|
| Quadrant | DetID | PixID | Counts | Sigma | Mean | Median | Sigma |
| A | 8 | 15 | 87254 | 560.79 | 763 | 747 | 154.3 |
| A | 0 | 118 | 66775 | 428.03 | 763 | 747 | 154.3 |
| A | 2 | 79 | 43957 | 280.11 | 763 | 747 | 154.3 |
| B | 14 | 167 | 137848 | 943.49 | 774 | 759 | 145.3 |
| B | 7 | 221 | 130735 | 894.53 | 774 | 759 | 145.3 |
| B | 15 | 204 | 40810 | 275.64 | 774 | 759 | 145.3 |
| C | 10 | 65 | 35367 | 201.74 | 748 | 751 | 171.6 |
| C | 9 | 247 | 7684 | 40.4 | 748 | 751 | 171.6 |
| C | 13 | 61 | 6393 | 32.88 | 748 | 751 | 171.6 |
| D | 2 | 32 | 974814 | 5751.84 | 711 | 691 | 169.4 |
| D | 13 | 239 | 144421 | 848.67 | 711 | 691 | 169.4 |
| D | 4 | 95 | 103735 | 608.44 | 711 | 691 | 169.4 |
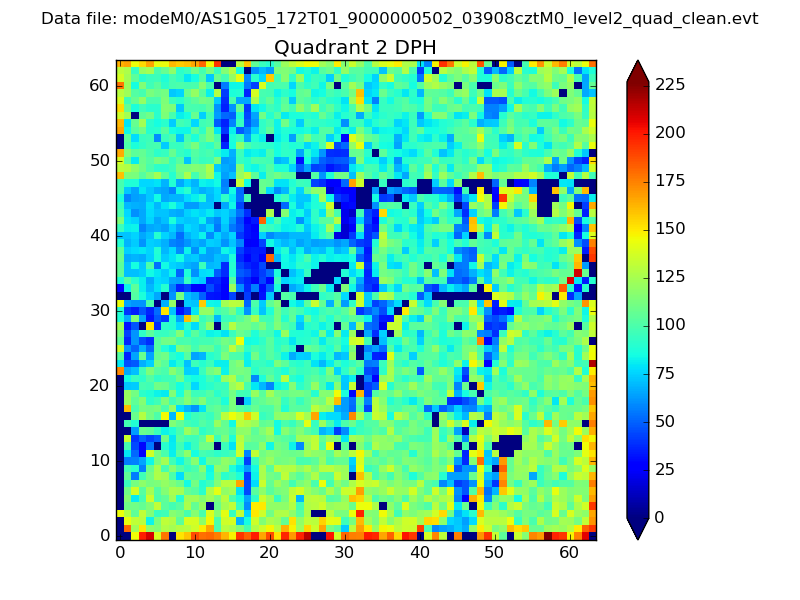
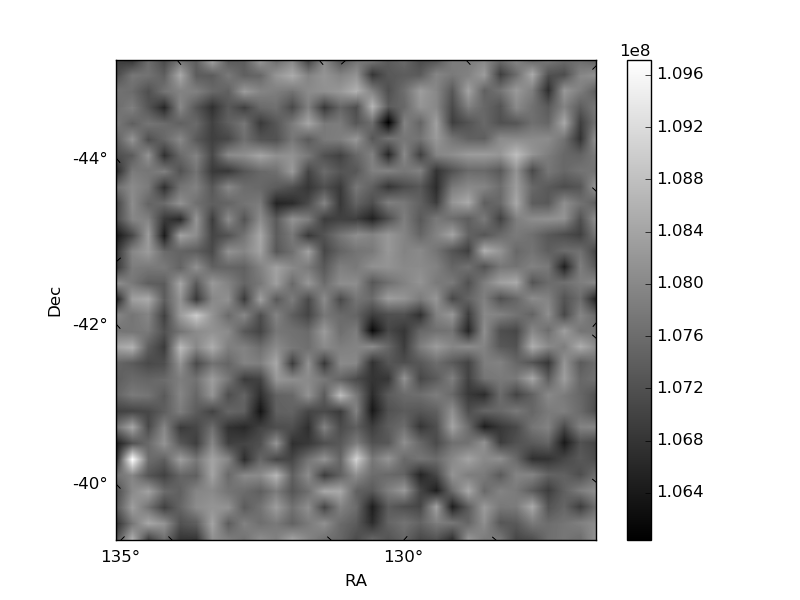
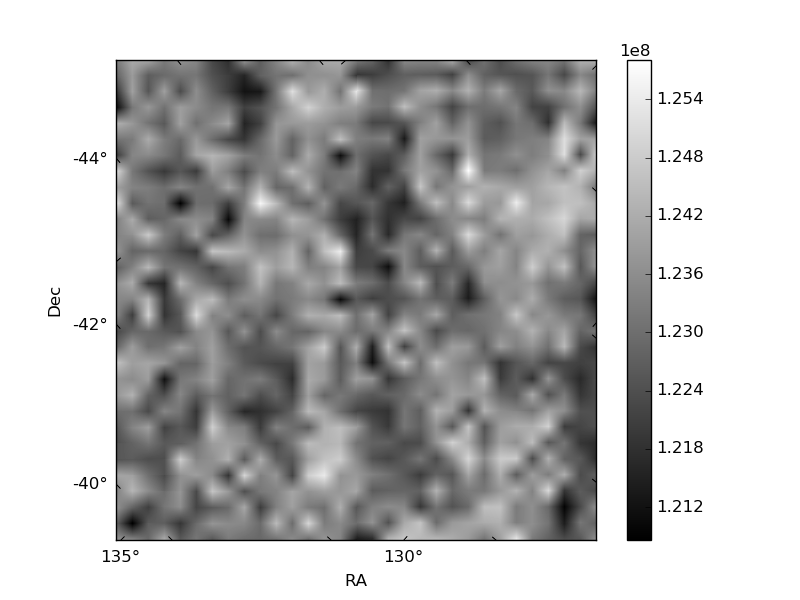
Histogram calculated using DETX and DETY for each event in the final _common_clean file
| Quadrant A | 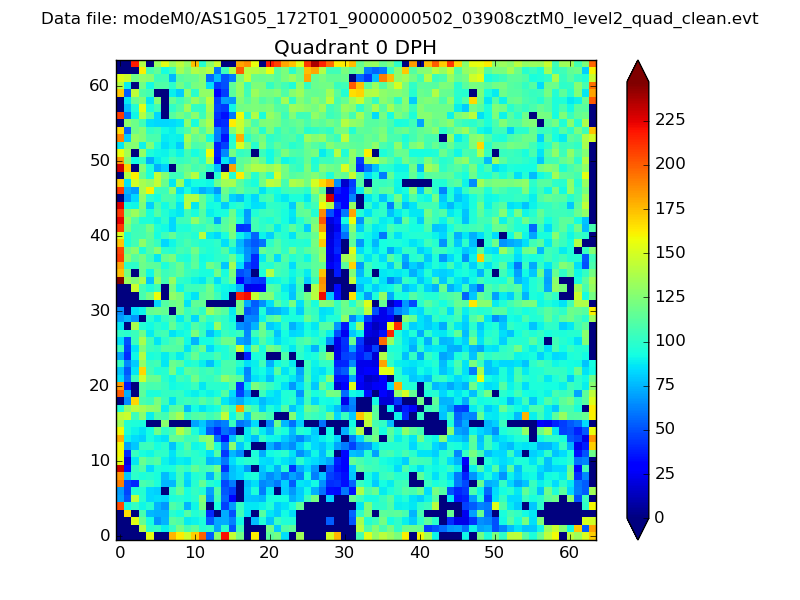 |
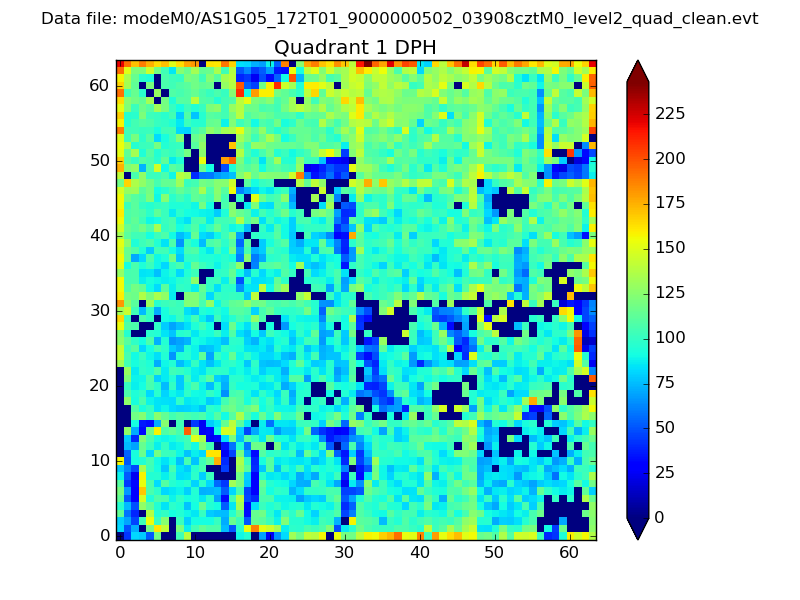 |
Quadrant B |
|---|---|---|---|
| Quadrant D | 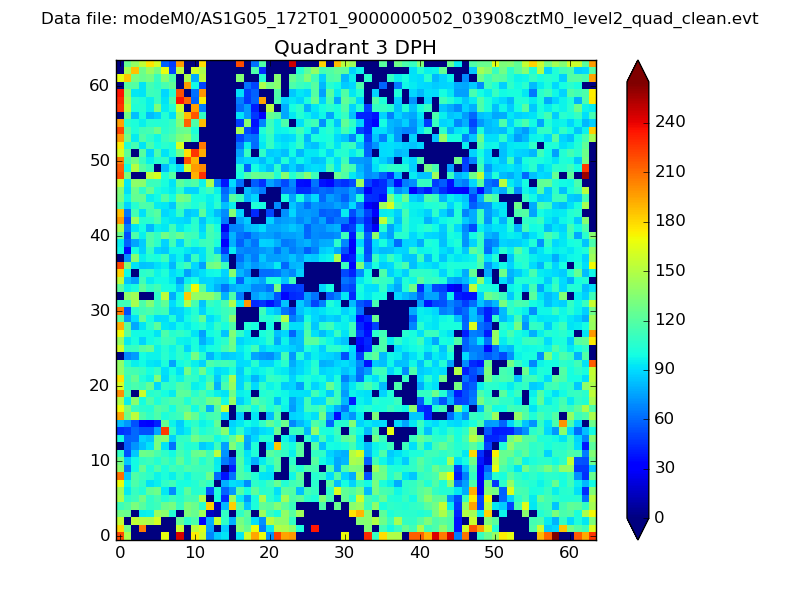 |
 |
Quadrant C |
| Plot type | Count rate plots | Images |
|---|---|---|
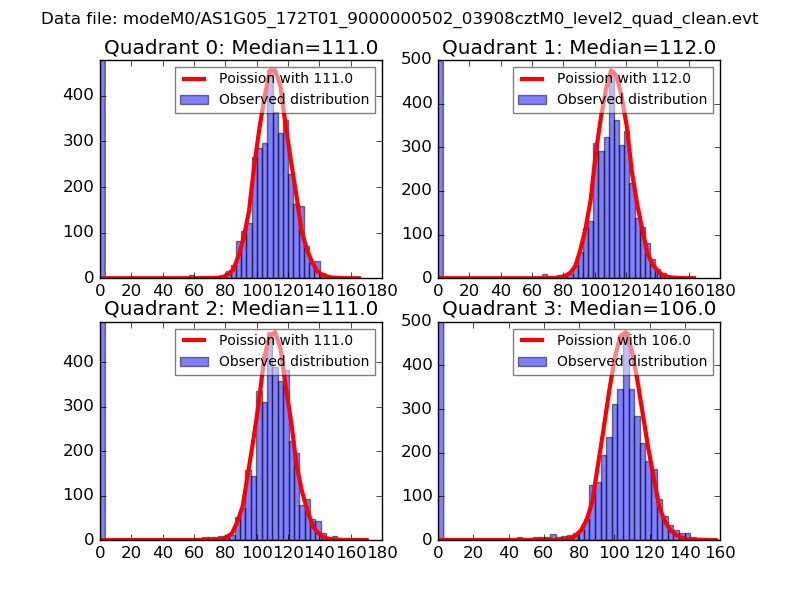
| Comparison with Poisson distribution Blue bars denote a histogram of data divided into 1 sec bins. Red curve is a Poisson curve with rate = median count rate of data. |
 |
 |
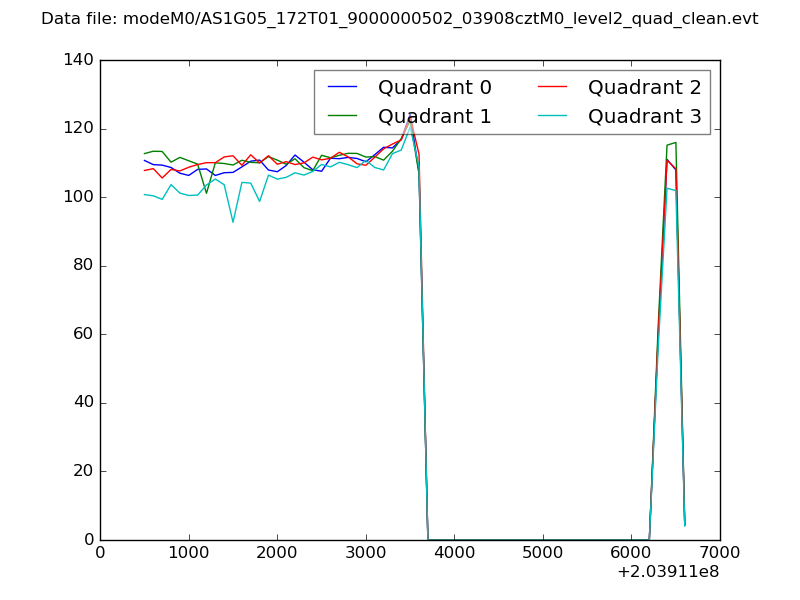
| Quadrant-wise count rates Data is divided into 100 sec bins |
 |
|
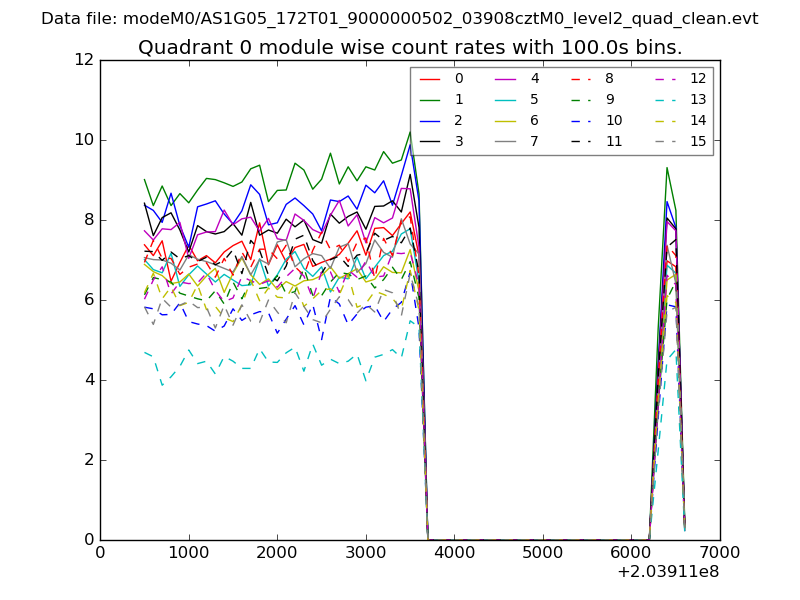
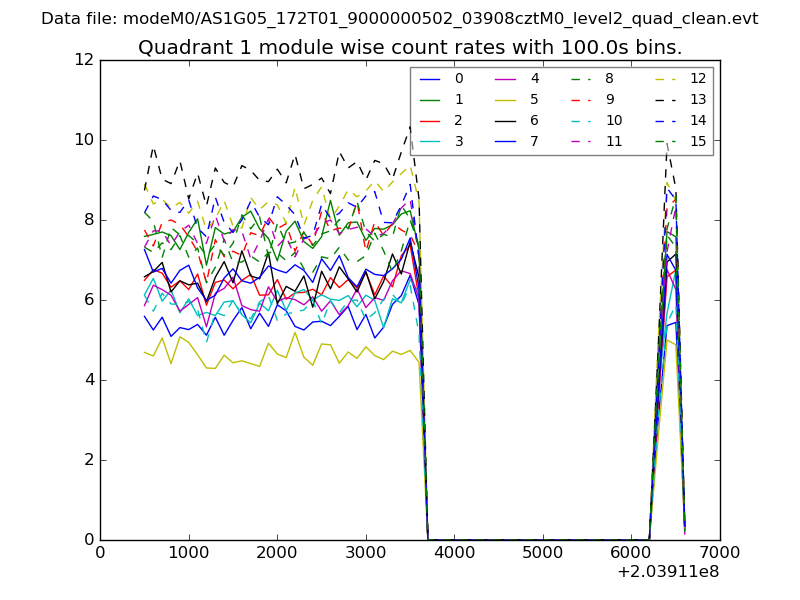
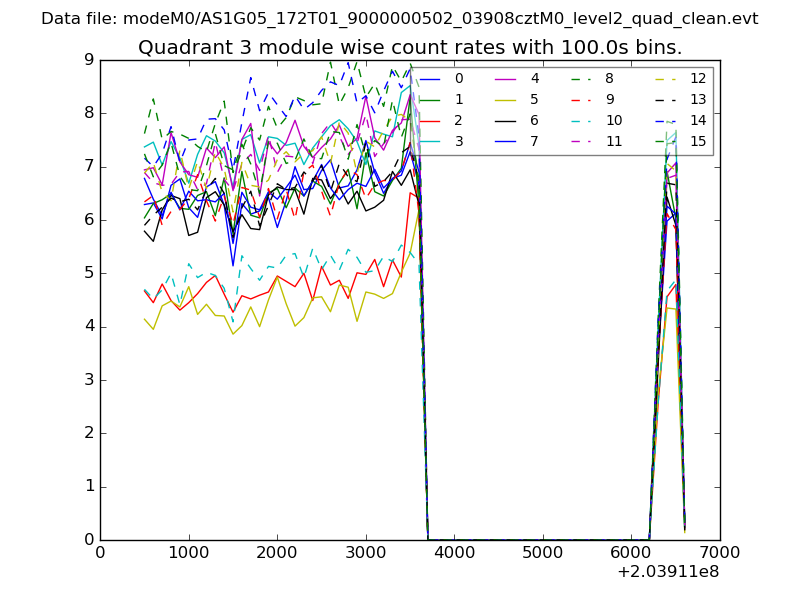
| Module-wise count rates for Quadrant A Data is divided into 100 sec bins |
 |
 |
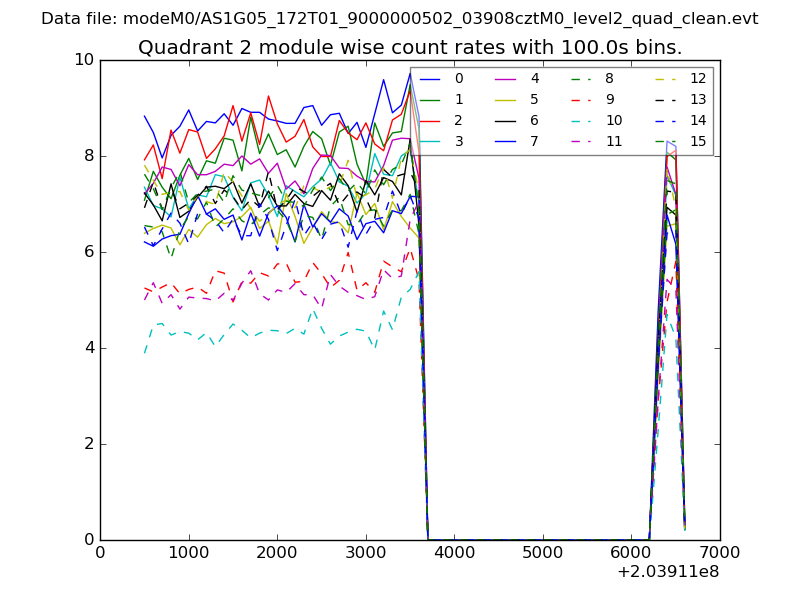
| Module-wise count rates for Quadrant B Data is divided into 100 sec bins |
 |
 |
| Module-wise count rates for Quadrant C Data is divided into 100 sec bins |
 |
 |
| Module-wise count rates for Quadrant D Data is divided into 100 sec bins |
 |
 |
| Parameter | Plot |
|---|---|
| CZT HV Monitor | 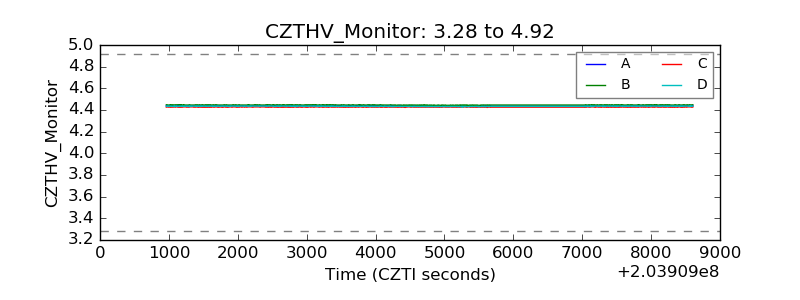 |
| D_VDD | 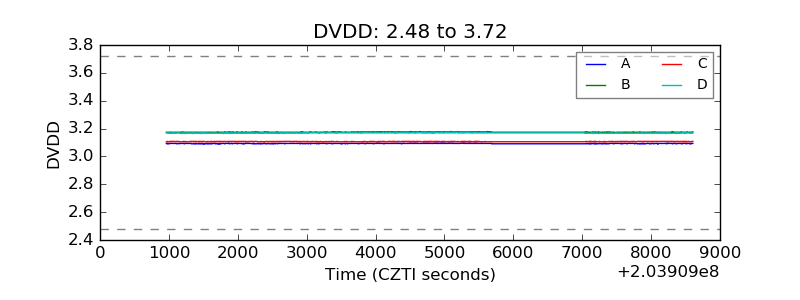 |
| Temperature 1 | 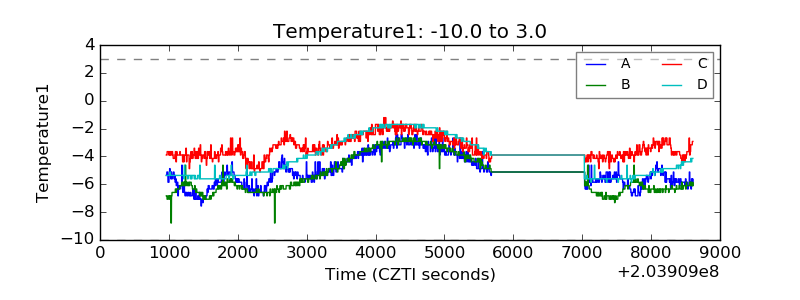 |
| Veto HV Monitor | 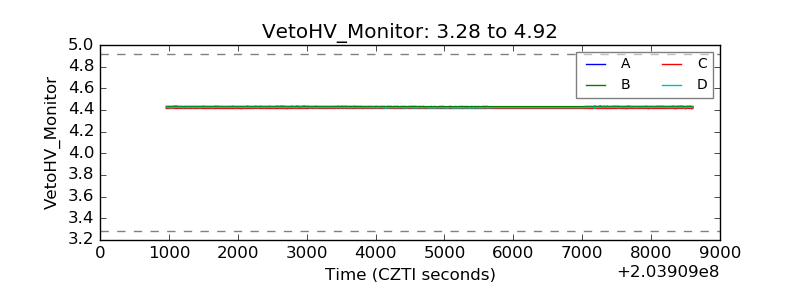 |
| Veto LLD | 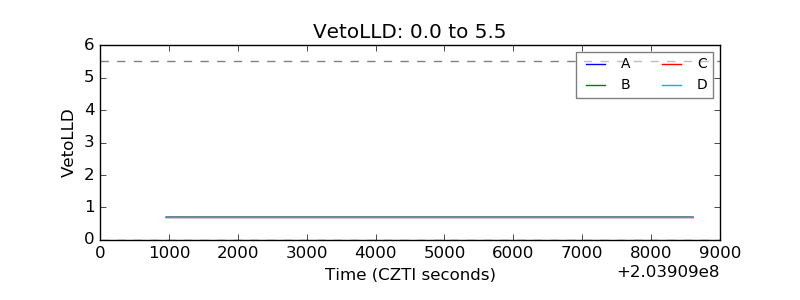 |
| Alpha Counter | 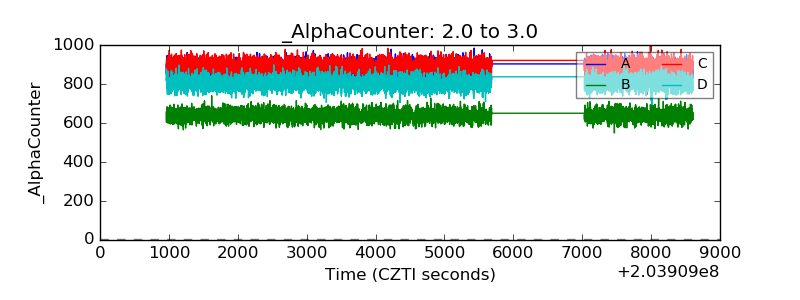 |
| _CPM_Rate | 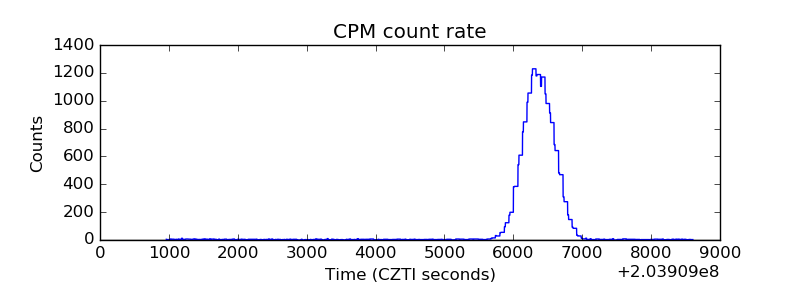 |
| CZT Counter | 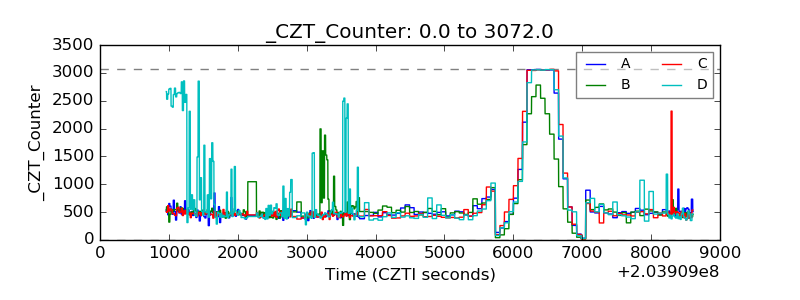 |
| +2.5 Volts monitor |  |
| +5 Volts monitor | 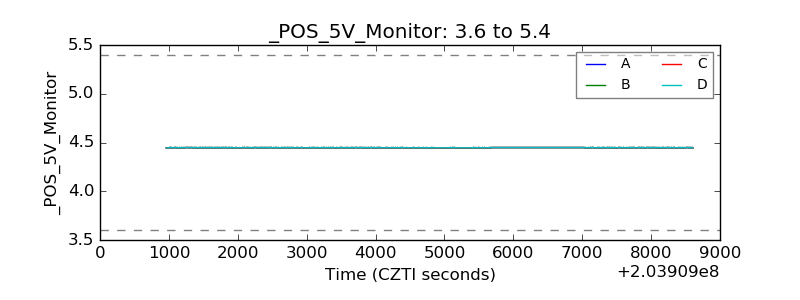 |
| Veto Counter | 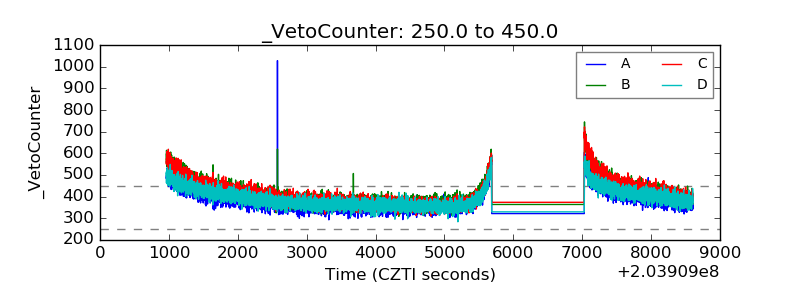 |