| Param | Original file | Final file |
|---|---|---|
| Filename | modeM0/AS1G05_172T01_9000000502_03909cztM0_level2.evt | modeM0/AS1G05_172T01_9000000502_03909cztM0_level2_quad_clean.evt |
| Size (bytes) | 442,791,360 | 75,623,040 |
| Size | 422.3 MB | 72.1 MB |
| Events in quadrant A | 3,390,676 | 461,187 |
| Events in quadrant B | 3,270,706 | 469,103 |
| Events in quadrant C | 3,157,152 | 462,099 |
| Events in quadrant D | 3,149,744 | 444,217 |
| Mode SS | |||
|---|---|---|---|
| Quadrant | BADHDUFLAG | Total packets | Discarded packets |
| A | 0 | 130 | 0 |
| B | 0 | 130 | 0 |
| C | 0 | 130 | 0 |
| D | 0 | 130 | 0 |
| Mode M9 | |||
|---|---|---|---|
| Quadrant | BADHDUFLAG | Total packets | Discarded packets |
| A | 0 | 16 | 0 |
| B | 0 | 16 | 0 |
| C | 0 | 16 | 0 |
| D | 0 | 17 | 0 |
| Mode M0 | |||
|---|---|---|---|
| Quadrant | BADHDUFLAG | Total packets | Discarded packets |
| A | 0 | 14084 | 3 |
| B | 0 | 13680 | 2 |
| C | 0 | 13792 | 2 |
| D | 0 | 13906 | 2 |
| Quadrant | Total seconds | Saturated seconds | Saturation percentage |
|---|---|---|---|
| A | 6505 | 54 | 0.830131% |
| B | 6505 | 69 | 1.060723% |
| C | 6505 | 99 | 1.521906% |
| D | 6505 | 64 | 0.983859% |
Noise dominated data is calculated using 1-second bins in cleaned event files. If a bin has >2000 counts, and if more than 50% of those come from <1% of pixels, then it is considered to be noise-dominated and hence unusable.
| Quadrant | # 1 sec bins | Bins with >0 counts | Bins with >2000 counts | High rate bins dominated by noise | Noise dominated (total time) | Noise dominated (detector-on time) | Marked lightcurve |
|---|---|---|---|---|---|---|---|
| A | 7755 | 6506 | 7 | 7 | 0.09% | 0.11% | 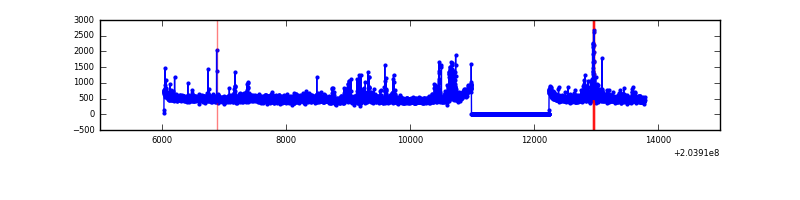 |
| B | 7755 | 6506 | 10 | 10 | 0.13% | 0.15% |  |
| C | 7755 | 6506 | 34 | 34 | 0.44% | 0.52% | 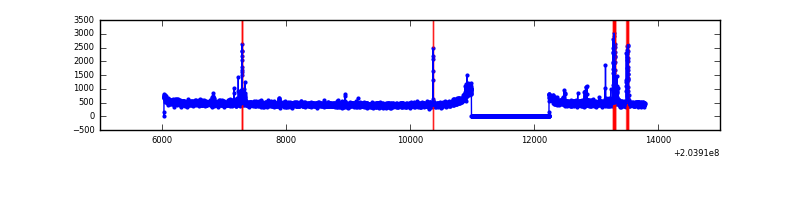 |
| D | 7755 | 6506 | 33 | 33 | 0.43% | 0.51% | 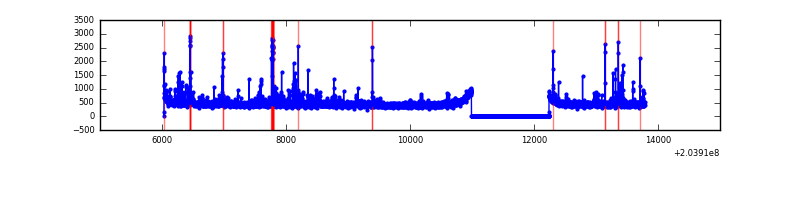 |
Top three noisy pixels from each quadrant. If the there are fewer than three noisy pixels in the level2.evt file, extra rows are filled as -1
| Pixel properties | Quadrant properties | ||||||
|---|---|---|---|---|---|---|---|
| Quadrant | DetID | PixID | Counts | Sigma | Mean | Median | Sigma |
| A | 8 | 15 | 146664 | 930.85 | 780 | 765 | 156.7 |
| A | 2 | 79 | 115687 | 733.21 | 780 | 765 | 156.7 |
| A | 8 | 4 | 76255 | 481.63 | 780 | 765 | 156.7 |
| B | 15 | 204 | 122141 | 803.27 | 791 | 772 | 151.1 |
| B | 7 | 221 | 65221 | 426.55 | 791 | 772 | 151.1 |
| B | 14 | 167 | 13594 | 84.86 | 791 | 772 | 151.1 |
| C | 1 | 16 | 114894 | 649.07 | 761 | 763 | 175.8 |
| C | 10 | 65 | 50542 | 283.1 | 761 | 763 | 175.8 |
| C | 9 | 247 | 17298 | 94.04 | 761 | 763 | 175.8 |
| D | 13 | 248 | 65616 | 360.94 | 755 | 731 | 179.8 |
| D | 10 | 246 | 56748 | 311.61 | 755 | 731 | 179.8 |
| D | 13 | 239 | 48253 | 264.35 | 755 | 731 | 179.8 |
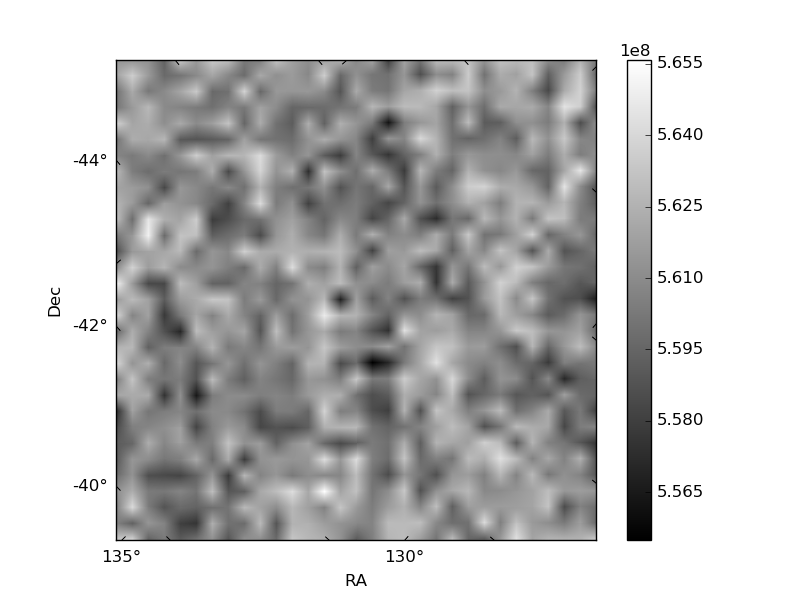
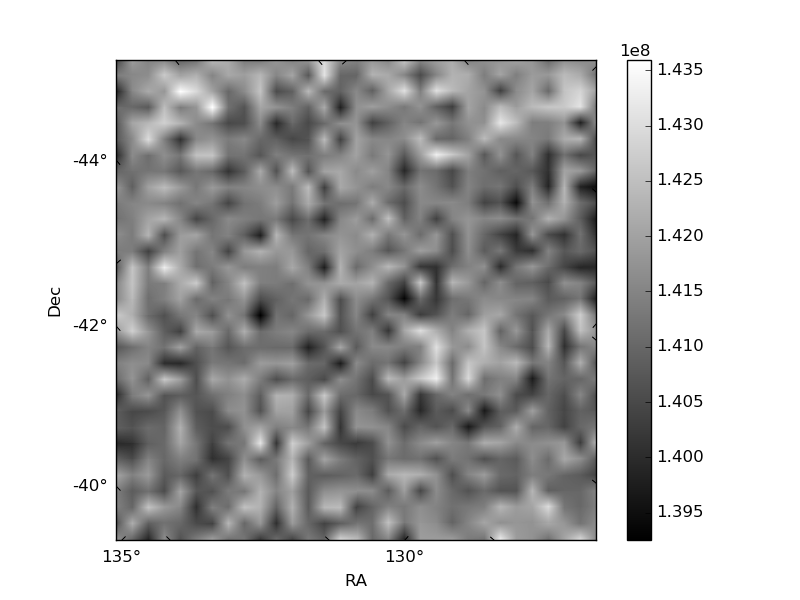
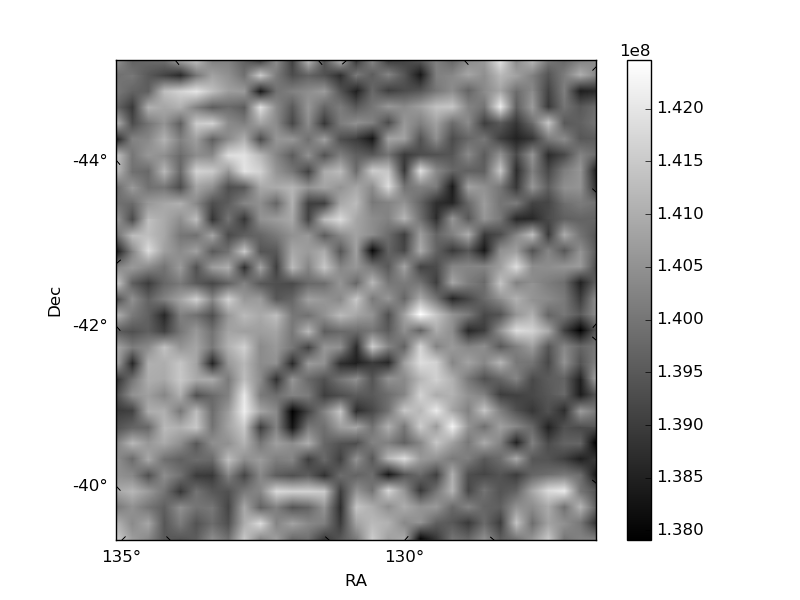
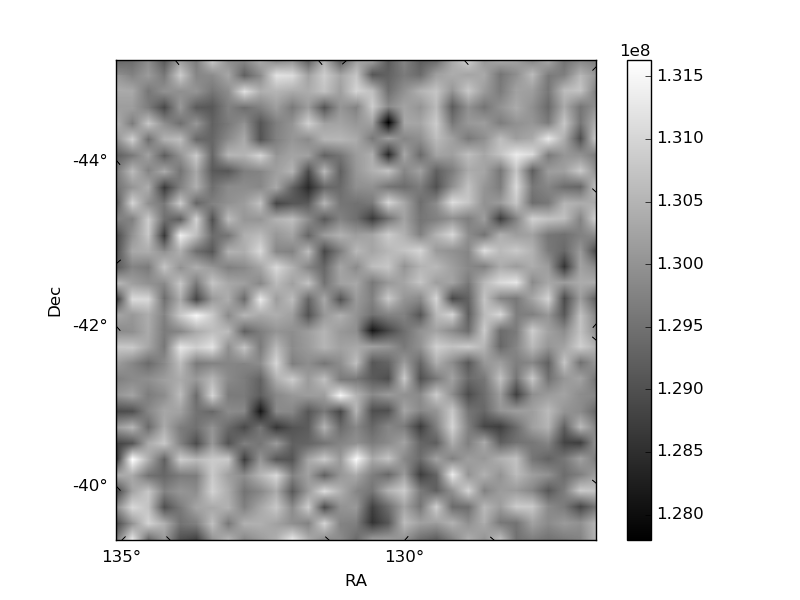
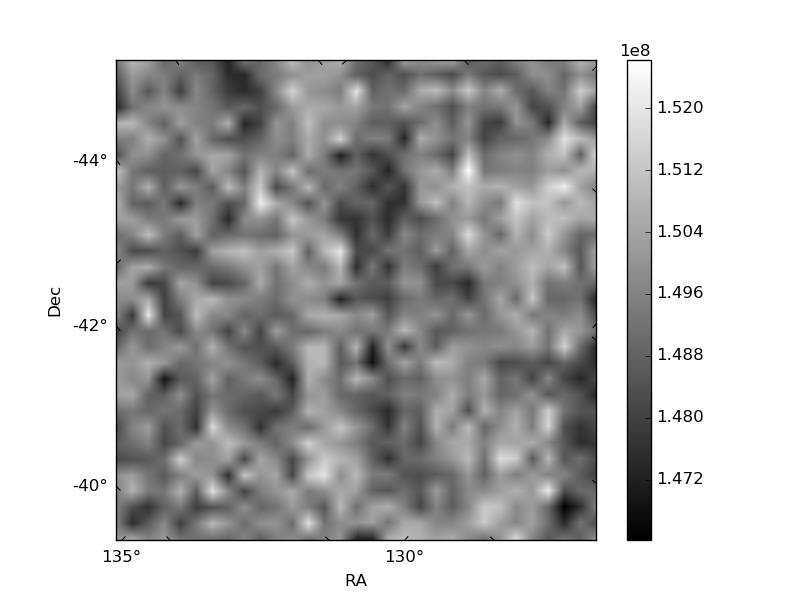
Histogram calculated using DETX and DETY for each event in the final _common_clean file
| Quadrant A | 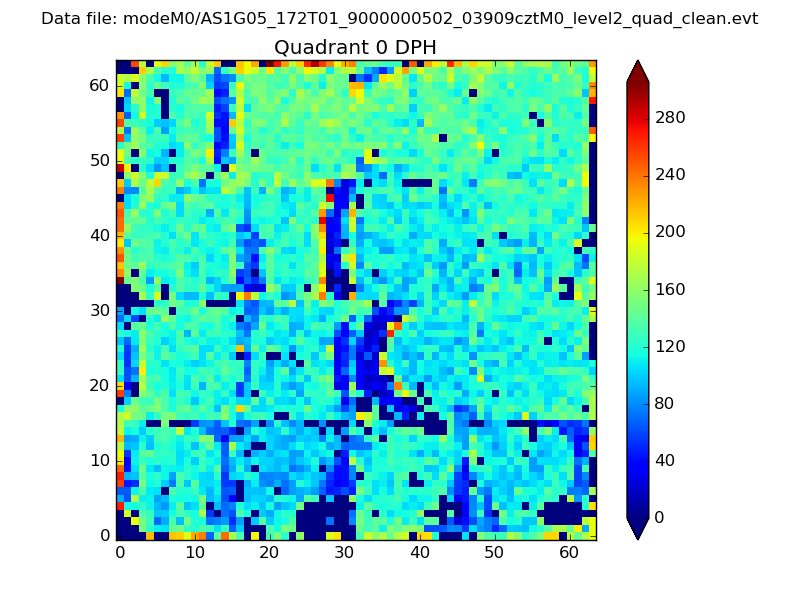 |
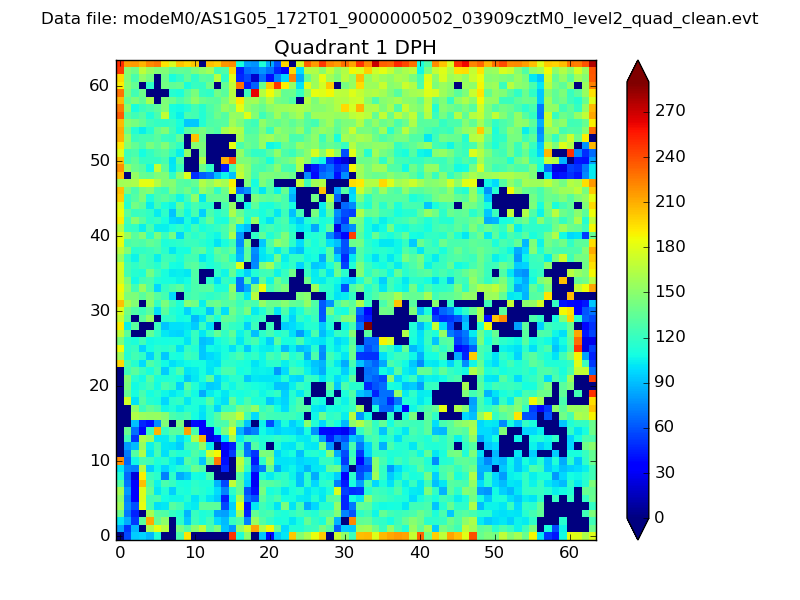 |
Quadrant B |
|---|---|---|---|
| Quadrant D | 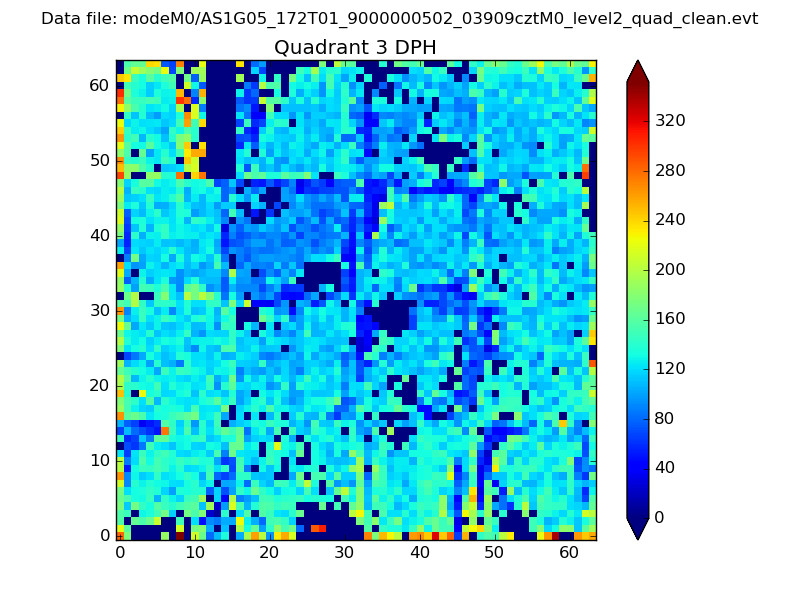 |
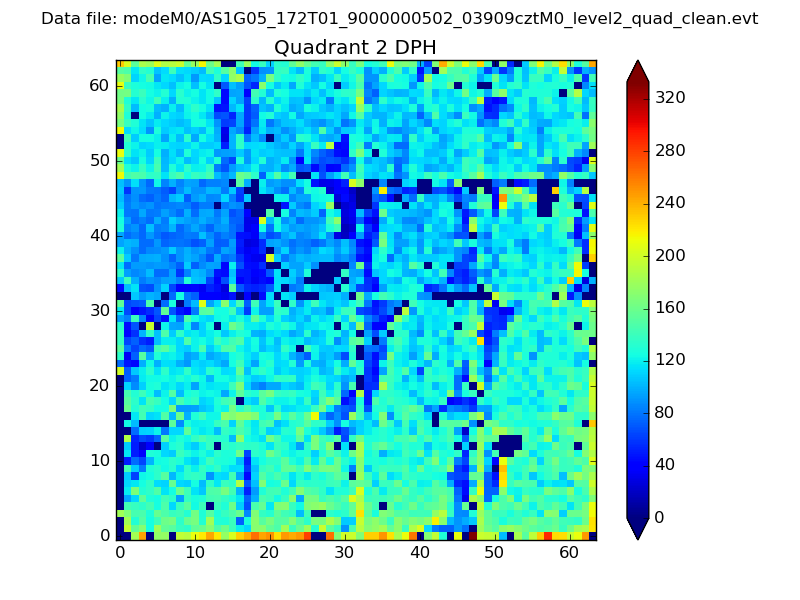 |
Quadrant C |
| Plot type | Count rate plots | Images |
|---|---|---|
| Comparison with Poisson distribution Blue bars denote a histogram of data divided into 1 sec bins. Red curve is a Poisson curve with rate = median count rate of data. |
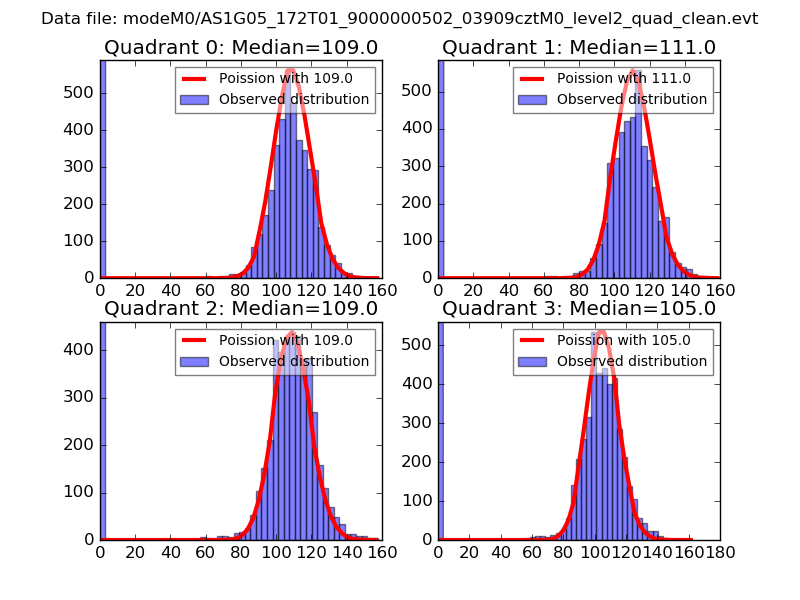 |
 |
| Quadrant-wise count rates Data is divided into 100 sec bins |
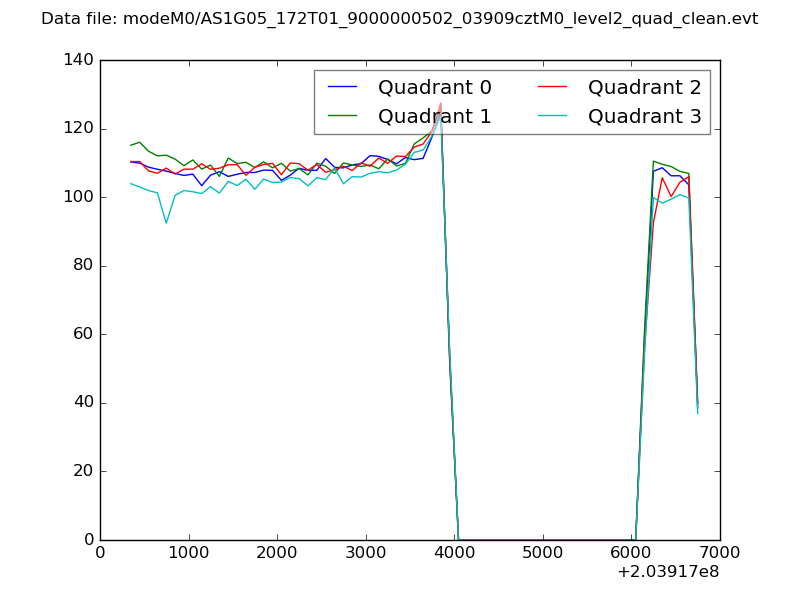 |
|
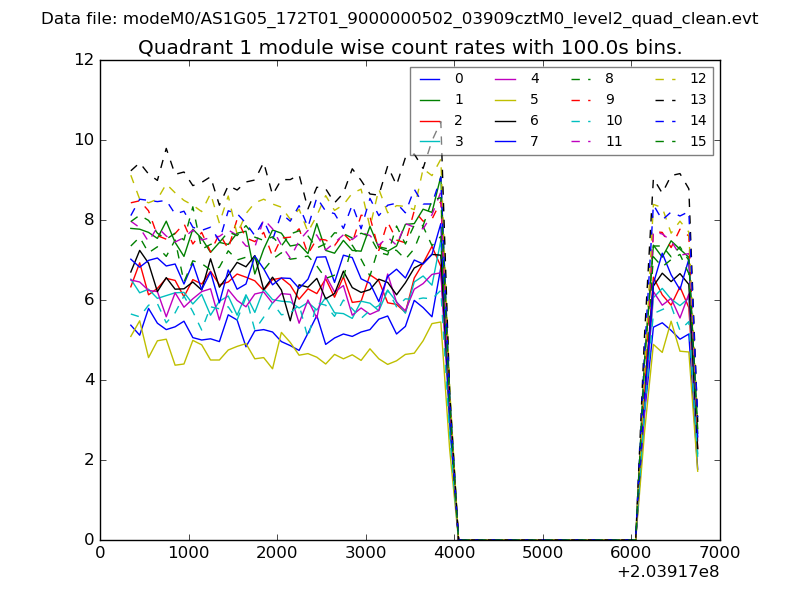
| Module-wise count rates for Quadrant A Data is divided into 100 sec bins |
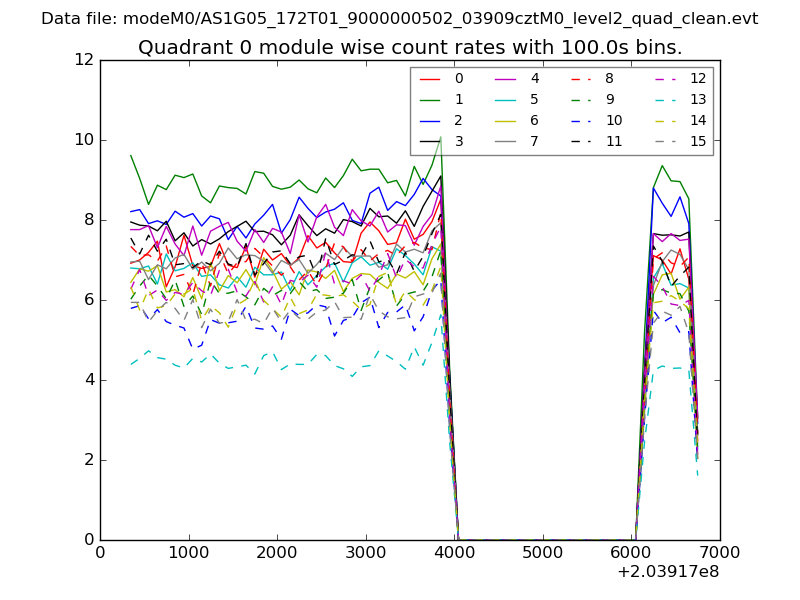 |
 |
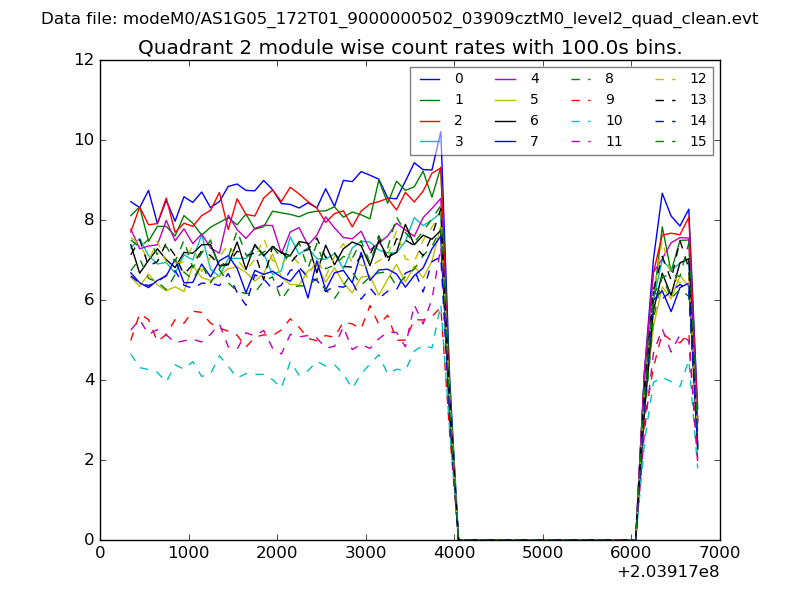
| Module-wise count rates for Quadrant B Data is divided into 100 sec bins |
 |
 |
| Module-wise count rates for Quadrant C Data is divided into 100 sec bins |
 |
 |
| Module-wise count rates for Quadrant D Data is divided into 100 sec bins |
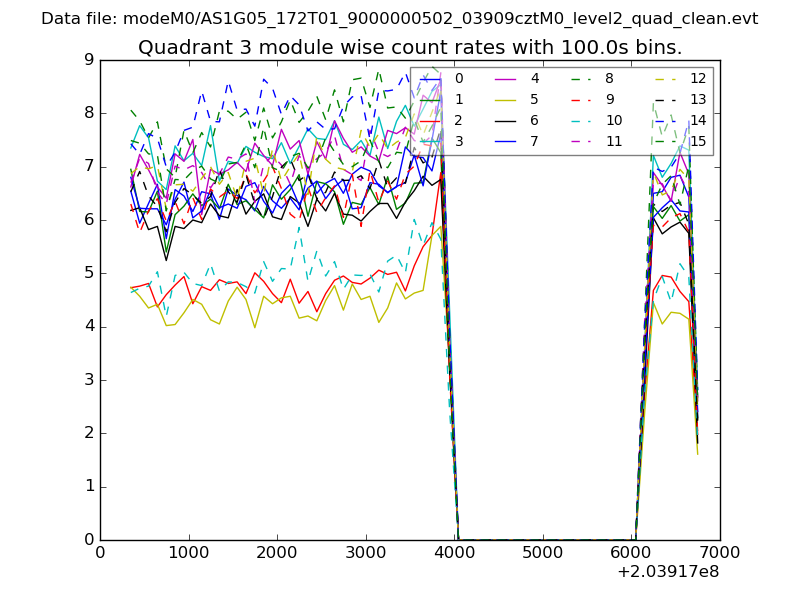 |
 |
| Parameter | Plot |
|---|---|
| CZT HV Monitor | 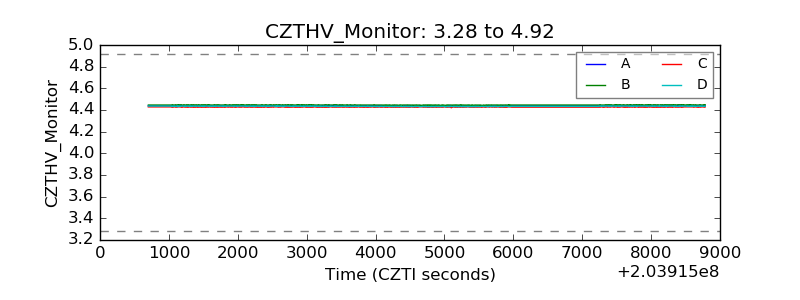 |
| D_VDD | 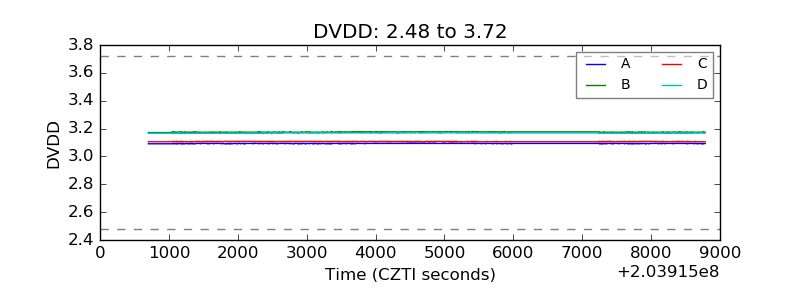 |
| Temperature 1 | 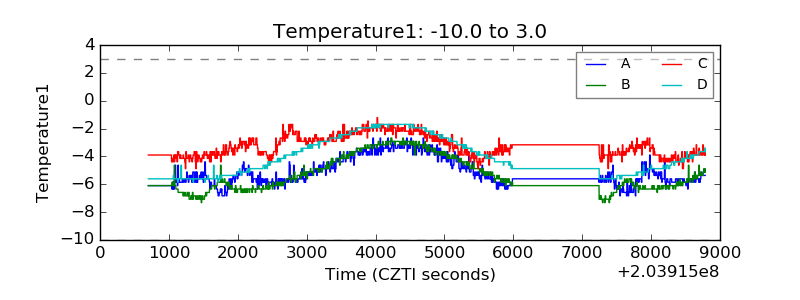 |
| Veto HV Monitor | 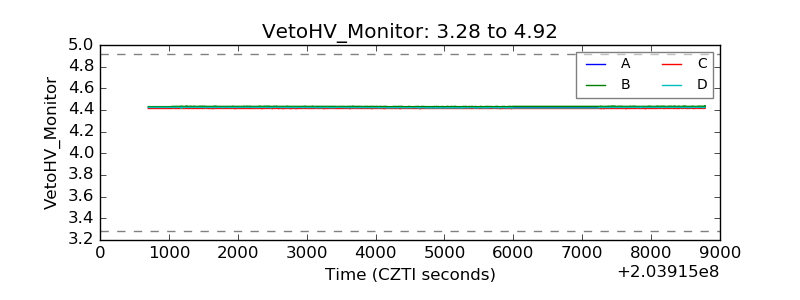 |
| Veto LLD |  |
| Alpha Counter | 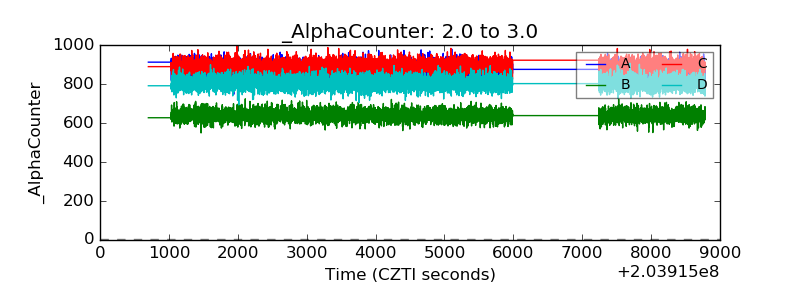 |
| _CPM_Rate | 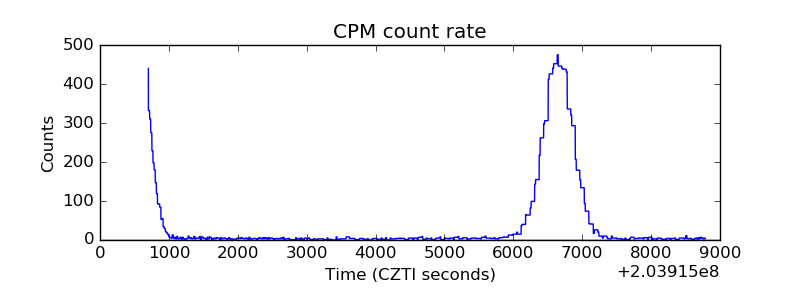 |
| CZT Counter | 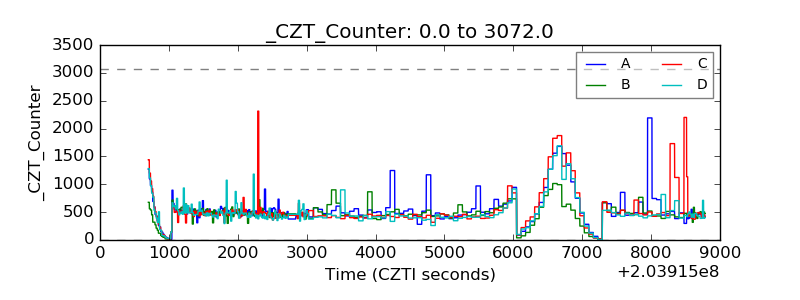 |
| +2.5 Volts monitor |  |
| +5 Volts monitor |  |
| Veto Counter | 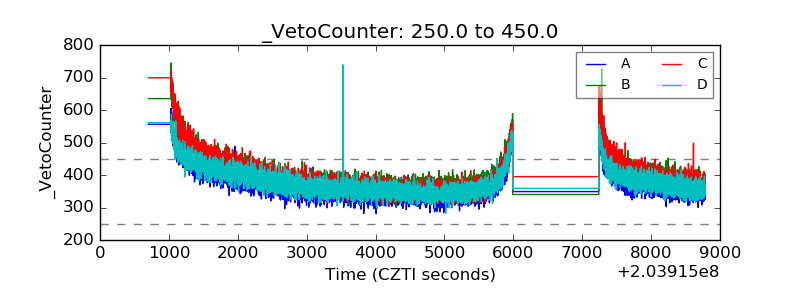 |