| Param | Original file | Final file |
|---|---|---|
| Filename | modeM0/AS1G05_172T01_9000000502_03910cztM0_level2.evt | modeM0/AS1G05_172T01_9000000502_03910cztM0_level2_quad_clean.evt |
| Size (bytes) | 454,351,680 | 79,430,400 |
| Size | 433.3 MB | 75.8 MB |
| Events in quadrant A | 3,306,947 | 489,431 |
| Events in quadrant B | 3,377,445 | 492,963 |
| Events in quadrant C | 3,164,971 | 487,755 |
| Events in quadrant D | 3,452,235 | 465,292 |
| Mode SS | |||
|---|---|---|---|
| Quadrant | BADHDUFLAG | Total packets | Discarded packets |
| A | 0 | 138 | 0 |
| B | 0 | 138 | 0 |
| C | 0 | 138 | 0 |
| D | 0 | 138 | 0 |
| Mode M9 | |||
|---|---|---|---|
| Quadrant | BADHDUFLAG | Total packets | Discarded packets |
| A | 0 | 11 | 0 |
| B | 0 | 11 | 0 |
| C | 0 | 11 | 0 |
| D | 0 | 12 | 0 |
| Mode M0 | |||
|---|---|---|---|
| Quadrant | BADHDUFLAG | Total packets | Discarded packets |
| A | 0 | 14331 | 3 |
| B | 0 | 14202 | 2 |
| C | 0 | 14202 | 2 |
| D | 0 | 15222 | 2 |
| Quadrant | Total seconds | Saturated seconds | Saturation percentage |
|---|---|---|---|
| A | 6735 | 127 | 1.885672% |
| B | 6735 | 148 | 2.197476% |
| C | 6735 | 155 | 2.301411% |
| D | 6735 | 228 | 3.385301% |
Noise dominated data is calculated using 1-second bins in cleaned event files. If a bin has >2000 counts, and if more than 50% of those come from <1% of pixels, then it is considered to be noise-dominated and hence unusable.
| Quadrant | # 1 sec bins | Bins with >0 counts | Bins with >2000 counts | High rate bins dominated by noise | Noise dominated (total time) | Noise dominated (detector-on time) | Marked lightcurve |
|---|---|---|---|---|---|---|---|
| A | 7660 | 6736 | 12 | 12 | 0.16% | 0.18% | 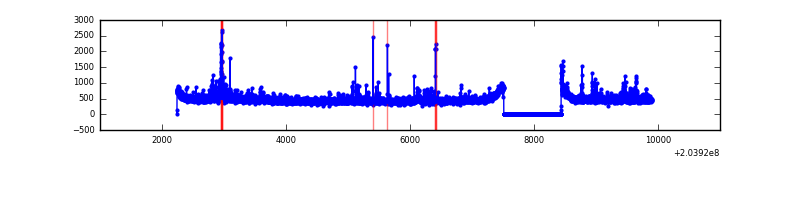 |
| B | 7660 | 6736 | 24 | 24 | 0.31% | 0.36% | 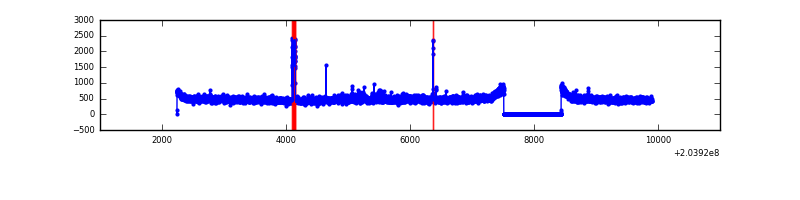 |
| C | 7660 | 6736 | 30 | 30 | 0.39% | 0.45% | 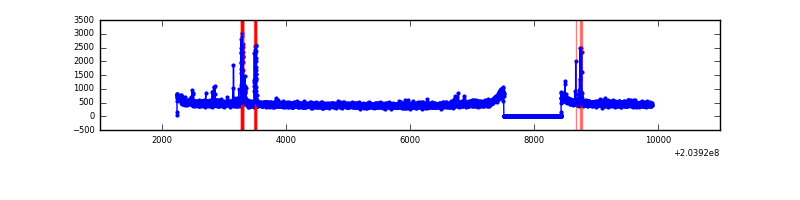 |
| D | 7660 | 6736 | 127 | 127 | 1.66% | 1.89% | 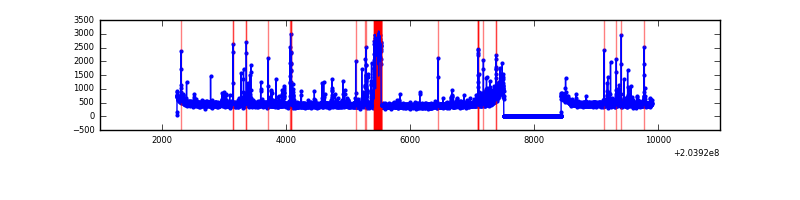 |
Top three noisy pixels from each quadrant. If the there are fewer than three noisy pixels in the level2.evt file, extra rows are filled as -1
| Pixel properties | Quadrant properties | ||||||
|---|---|---|---|---|---|---|---|
| Quadrant | DetID | PixID | Counts | Sigma | Mean | Median | Sigma |
| A | 8 | 15 | 94046 | 576.31 | 790 | 774 | 161.8 |
| A | 2 | 79 | 80908 | 495.13 | 790 | 774 | 161.8 |
| A | 0 | 118 | 54939 | 334.67 | 790 | 774 | 161.8 |
| B | 15 | 204 | 188648 | 1220.83 | 796 | 777 | 153.9 |
| B | 7 | 221 | 82573 | 531.53 | 796 | 777 | 153.9 |
| B | 15 | 85 | 19305 | 120.4 | 796 | 777 | 153.9 |
| C | 1 | 16 | 114540 | 639.77 | 769 | 774 | 177.8 |
| C | 10 | 65 | 29937 | 164.0 | 769 | 774 | 177.8 |
| C | 9 | 247 | 11048 | 57.78 | 769 | 774 | 177.8 |
| D | 2 | 32 | 327771 | 1796.59 | 759 | 738 | 182.0 |
| D | 13 | 239 | 100300 | 546.95 | 759 | 738 | 182.0 |
| D | 13 | 248 | 65166 | 353.94 | 759 | 738 | 182.0 |
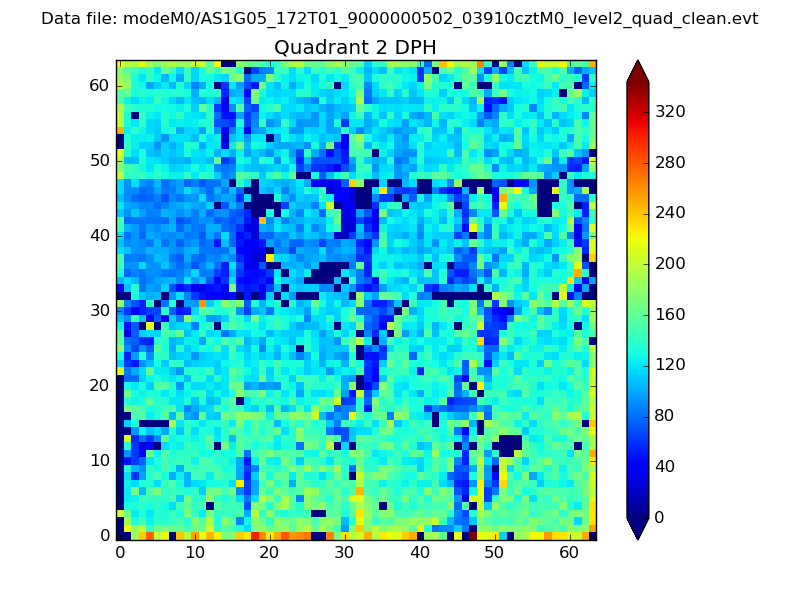
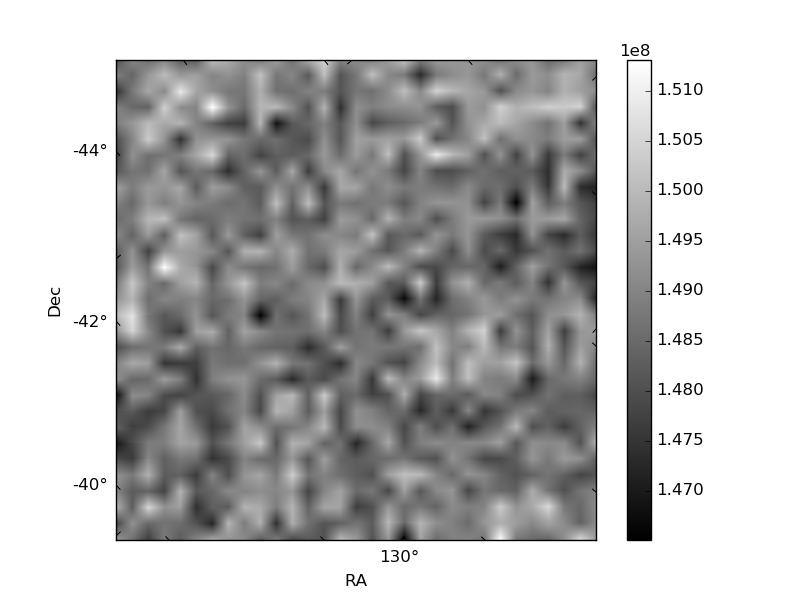
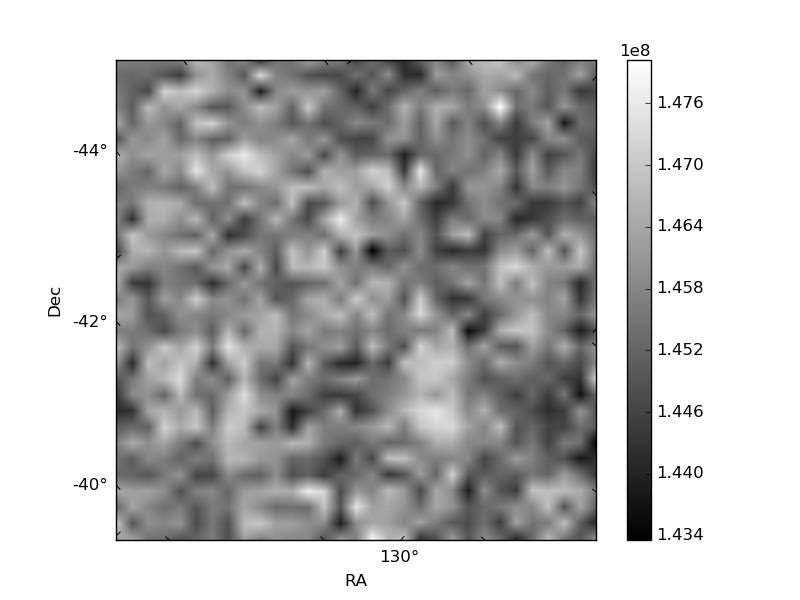
Histogram calculated using DETX and DETY for each event in the final _common_clean file
| Quadrant A | 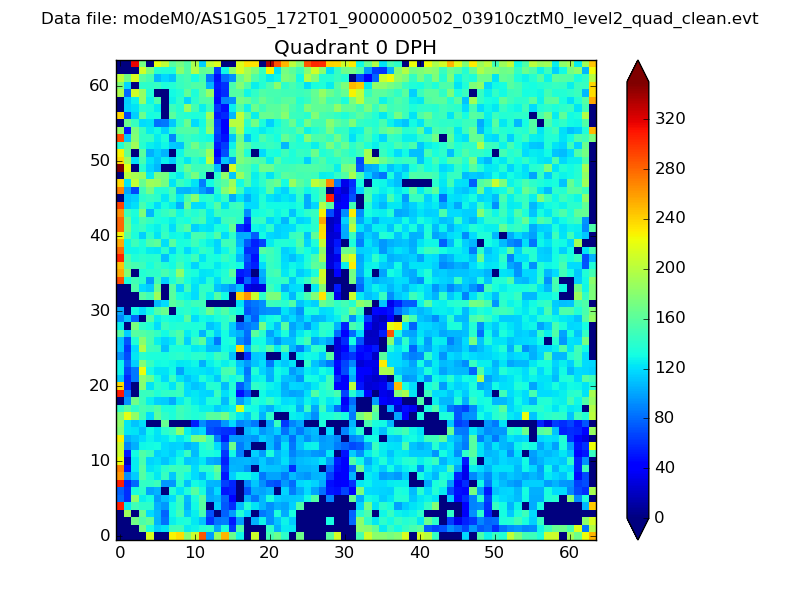 |
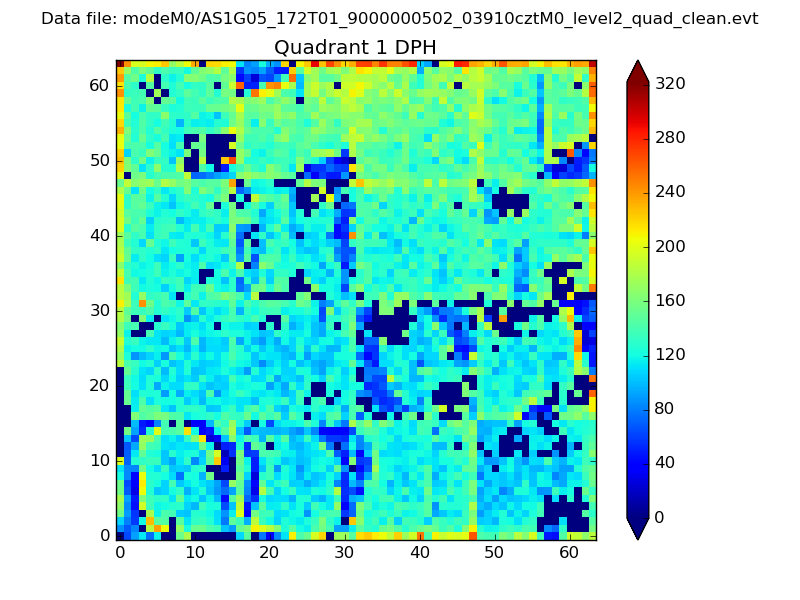 |
Quadrant B |
|---|---|---|---|
| Quadrant D | 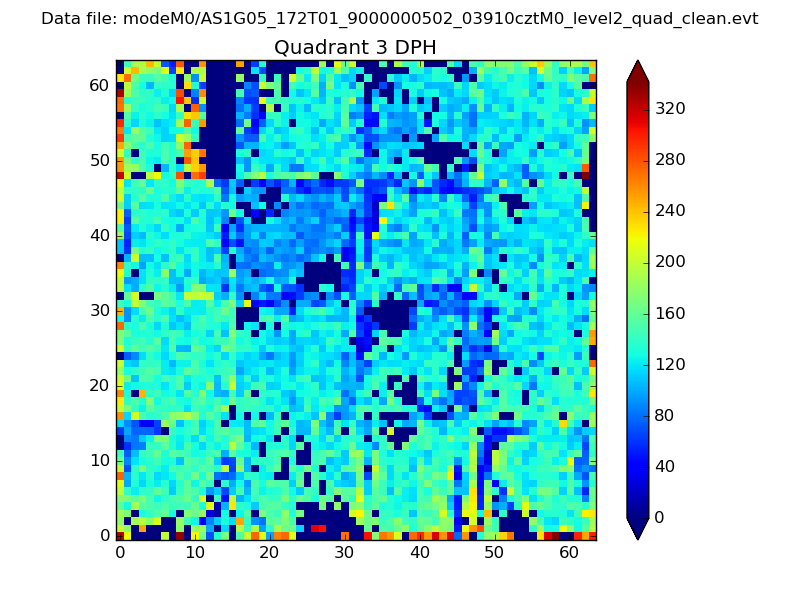 |
 |
Quadrant C |
| Plot type | Count rate plots | Images |
|---|---|---|
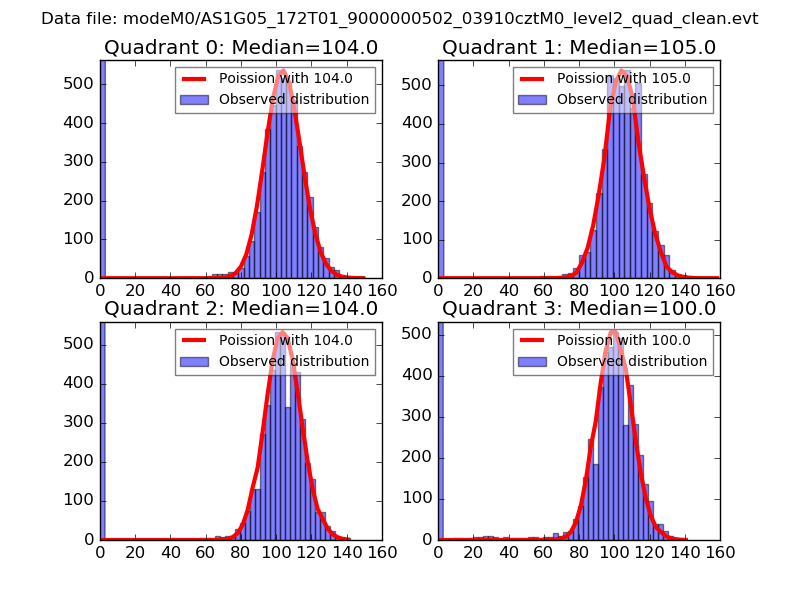
| Comparison with Poisson distribution Blue bars denote a histogram of data divided into 1 sec bins. Red curve is a Poisson curve with rate = median count rate of data. |
 |
 |
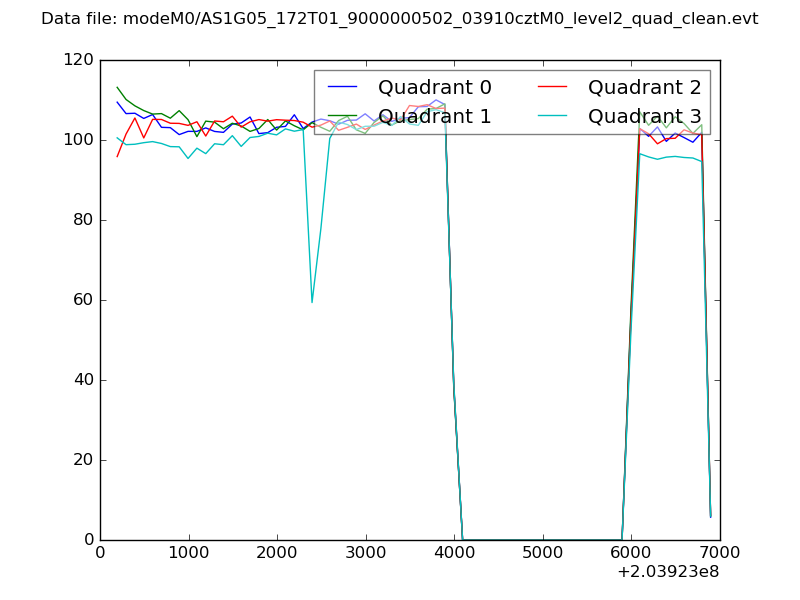
| Quadrant-wise count rates Data is divided into 100 sec bins |
 |
|
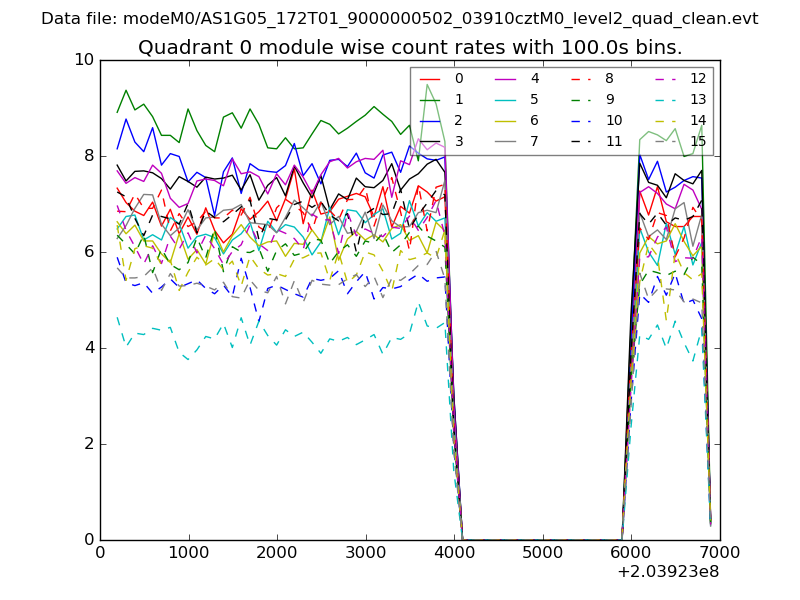
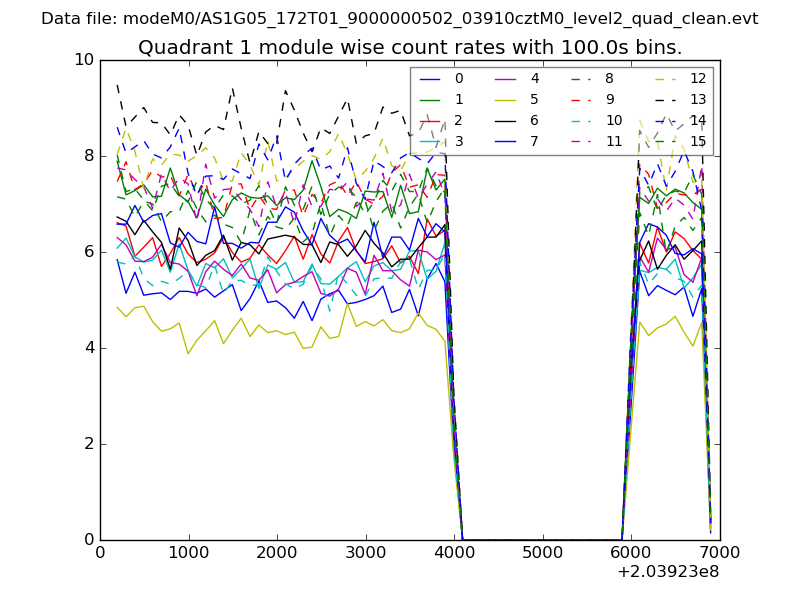
| Module-wise count rates for Quadrant A Data is divided into 100 sec bins |
 |
 |
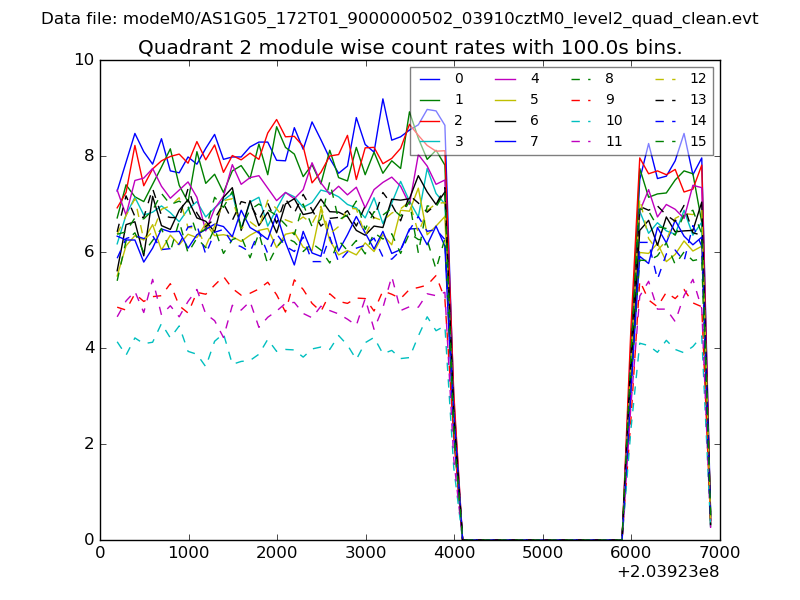
| Module-wise count rates for Quadrant B Data is divided into 100 sec bins |
 |
 |
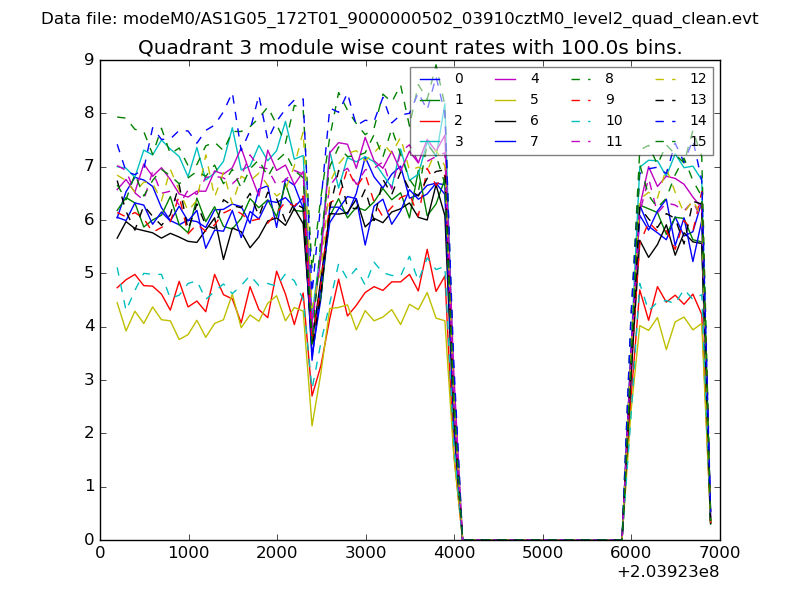
| Module-wise count rates for Quadrant C Data is divided into 100 sec bins |
 |
 |
| Module-wise count rates for Quadrant D Data is divided into 100 sec bins |
 |
 |
| Parameter | Plot |
|---|---|
| CZT HV Monitor | 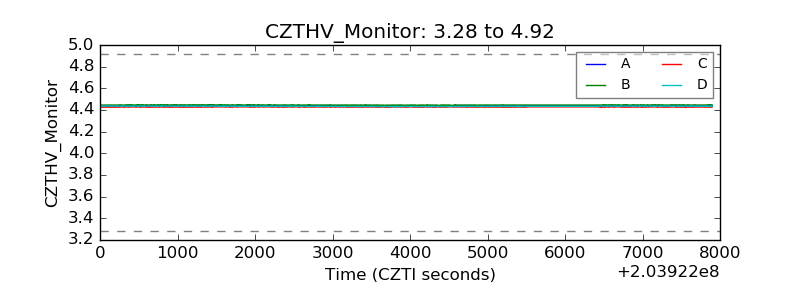 |
| D_VDD | 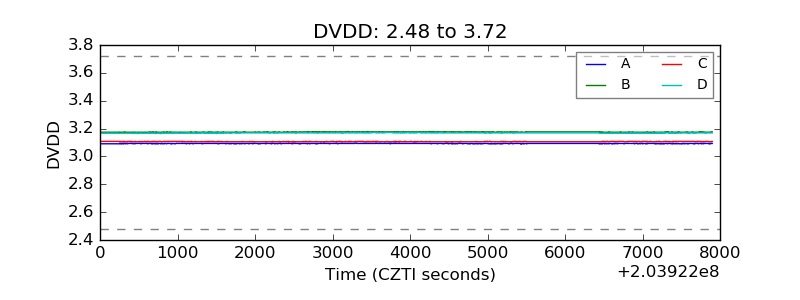 |
| Temperature 1 | 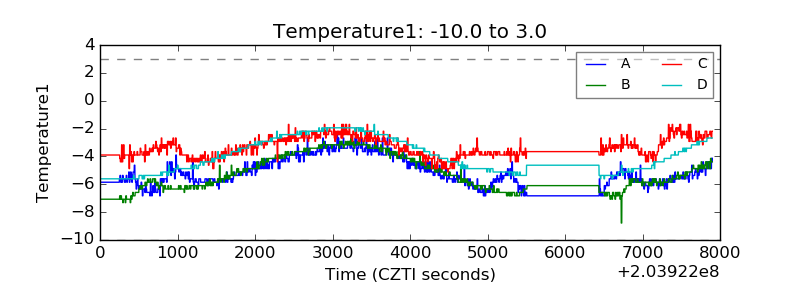 |
| Veto HV Monitor | 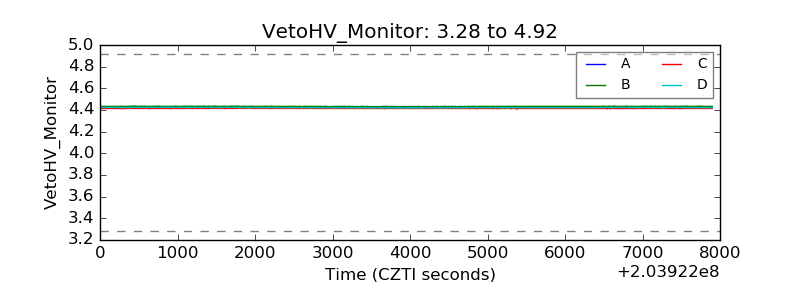 |
| Veto LLD | 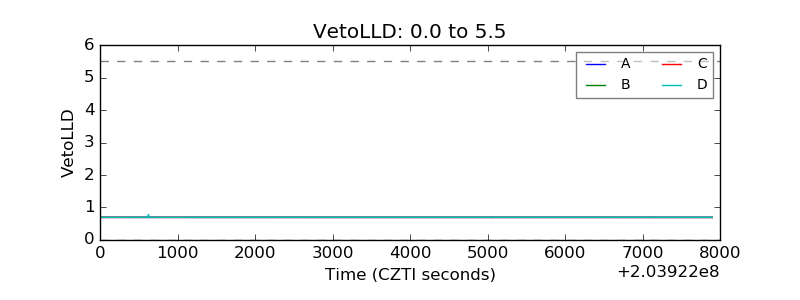 |
| Alpha Counter | 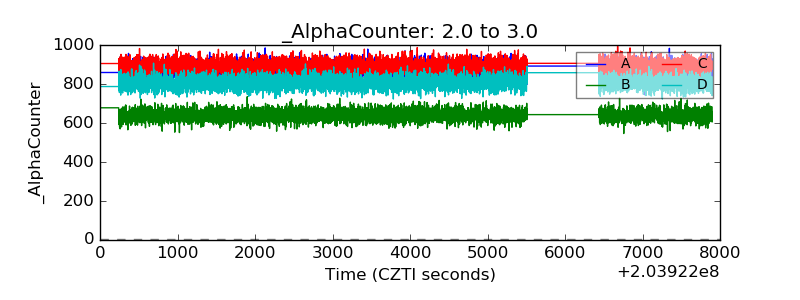 |
| _CPM_Rate | 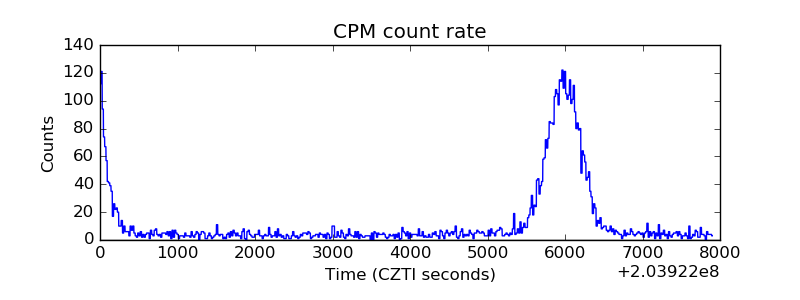 |
| CZT Counter | 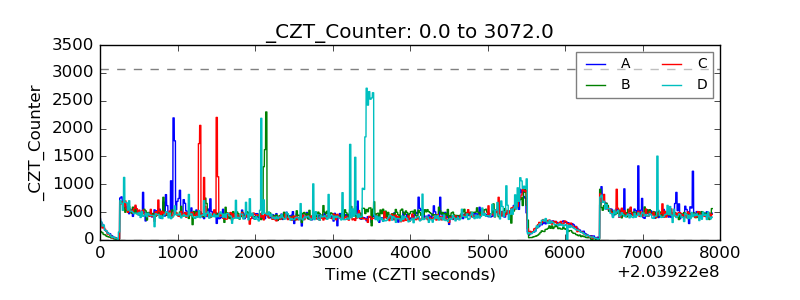 |
| +2.5 Volts monitor |  |
| +5 Volts monitor |  |
| Veto Counter | 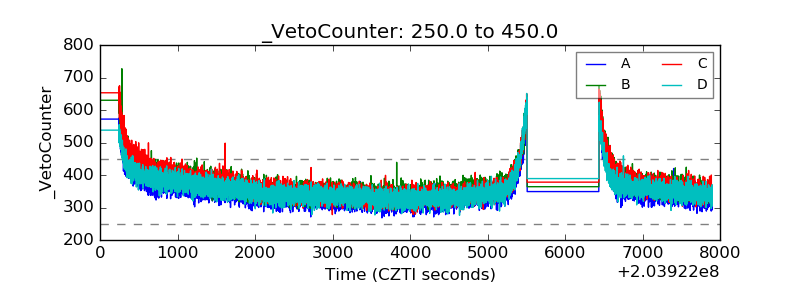 |