| Param | Original file | Final file |
|---|---|---|
| Filename | modeM0/AS1G05_172T01_9000000502_03911cztM0_level2.evt | modeM0/AS1G05_172T01_9000000502_03911cztM0_level2_quad_clean.evt |
| Size (bytes) | 531,008,640 | 88,413,120 |
| Size | 506.4 MB | 84.3 MB |
| Events in quadrant A | 4,153,034 | 534,401 |
| Events in quadrant B | 3,599,520 | 551,859 |
| Events in quadrant C | 3,316,797 | 547,564 |
| Events in quadrant D | 4,502,381 | 520,816 |
| Mode SS | |||
|---|---|---|---|
| Quadrant | BADHDUFLAG | Total packets | Discarded packets |
| A | 0 | 152 | 0 |
| B | 0 | 152 | 0 |
| C | 0 | 152 | 0 |
| D | 0 | 152 | 0 |
| Mode M9 | |||
|---|---|---|---|
| Quadrant | BADHDUFLAG | Total packets | Discarded packets |
| A | 0 | 5 | 0 |
| B | 0 | 5 | 0 |
| C | 0 | 5 | 0 |
| D | 0 | 6 | 0 |
| Mode M0 | |||
|---|---|---|---|
| Quadrant | BADHDUFLAG | Total packets | Discarded packets |
| A | 0 | 17423 | 3 |
| B | 0 | 15527 | 2 |
| C | 0 | 15440 | 2 |
| D | 0 | 18659 | 2 |
| Quadrant | Total seconds | Saturated seconds | Saturation percentage |
|---|---|---|---|
| A | 7511 | 335 | 4.460125% |
| B | 7511 | 103 | 1.371322% |
| C | 7511 | 81 | 1.078418% |
| D | 7511 | 165 | 2.196778% |
Noise dominated data is calculated using 1-second bins in cleaned event files. If a bin has >2000 counts, and if more than 50% of those come from <1% of pixels, then it is considered to be noise-dominated and hence unusable.
| Quadrant | # 1 sec bins | Bins with >0 counts | Bins with >2000 counts | High rate bins dominated by noise | Noise dominated (total time) | Noise dominated (detector-on time) | Marked lightcurve |
|---|---|---|---|---|---|---|---|
| A | 8051 | 7513 | 194 | 194 | 2.41% | 2.58% | 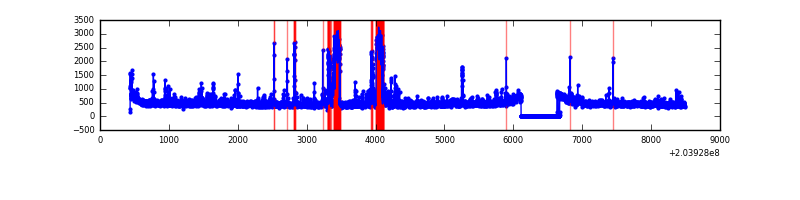 |
| B | 8051 | 7513 | 0 | 0 | 0.00% | 0.00% | 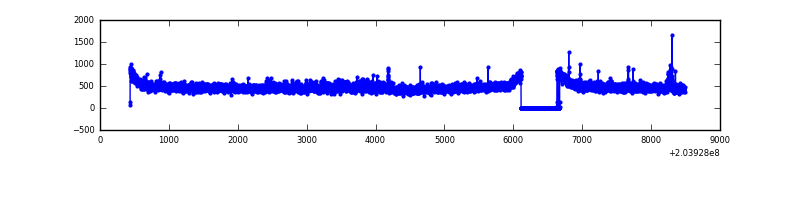 |
| C | 8051 | 7513 | 6 | 6 | 0.07% | 0.08% | 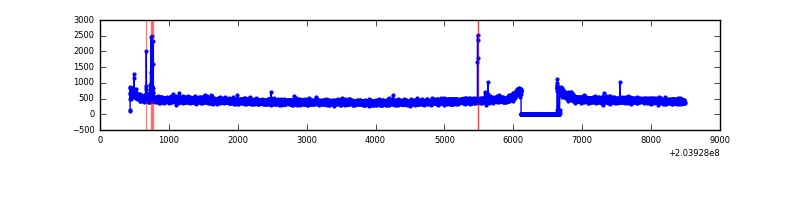 |
| D | 8051 | 7513 | 85 | 85 | 1.06% | 1.13% | 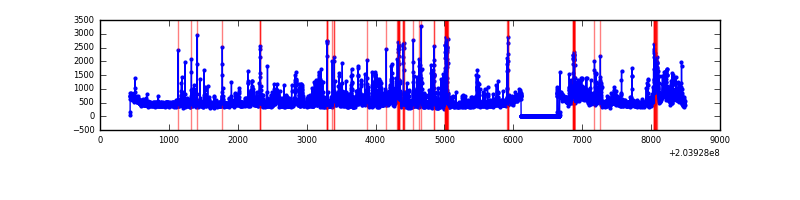 |
Top three noisy pixels from each quadrant. If the there are fewer than three noisy pixels in the level2.evt file, extra rows are filled as -1
| Pixel properties | Quadrant properties | ||||||
|---|---|---|---|---|---|---|---|
| Quadrant | DetID | PixID | Counts | Sigma | Mean | Median | Sigma |
| A | 0 | 50 | 537188 | 3068.01 | 852 | 832 | 174.8 |
| A | 2 | 79 | 149904 | 852.71 | 852 | 832 | 174.8 |
| A | 0 | 118 | 93655 | 530.96 | 852 | 832 | 174.8 |
| B | 15 | 204 | 191391 | 1134.02 | 869 | 848 | 168.0 |
| B | 7 | 252 | 14699 | 82.43 | 869 | 848 | 168.0 |
| B | 12 | 111 | 13829 | 77.26 | 869 | 848 | 168.0 |
| C | 10 | 65 | 30917 | 153.65 | 839 | 840 | 195.8 |
| C | 13 | 61 | 7116 | 32.06 | 839 | 840 | 195.8 |
| C | 12 | 4 | 4609 | 19.25 | 839 | 840 | 195.8 |
| D | 2 | 32 | 524945 | 2620.01 | 834 | 810 | 200.1 |
| D | 10 | 246 | 409036 | 2040.61 | 834 | 810 | 200.1 |
| D | 4 | 95 | 167594 | 833.71 | 834 | 810 | 200.1 |
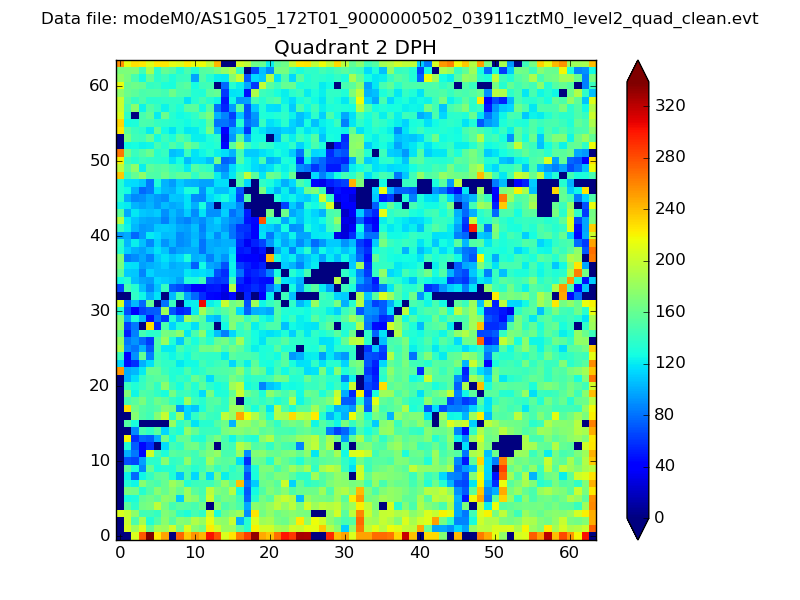
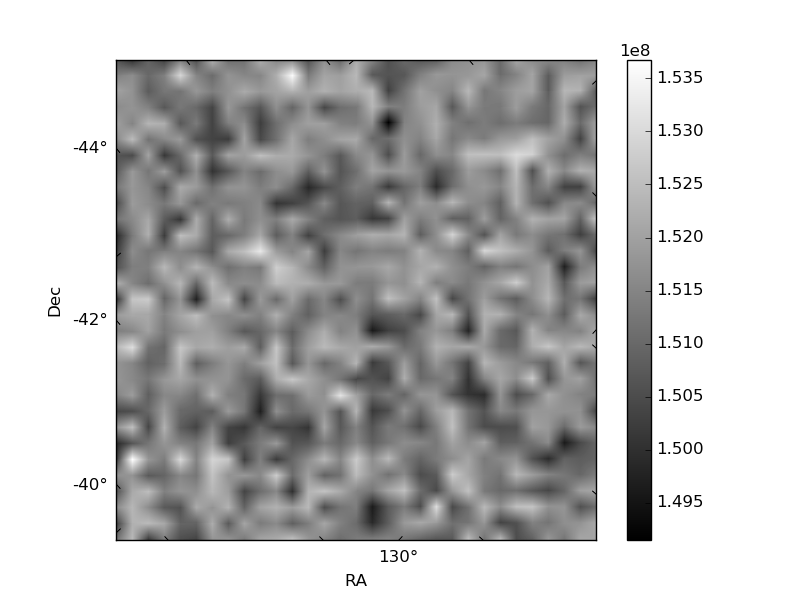
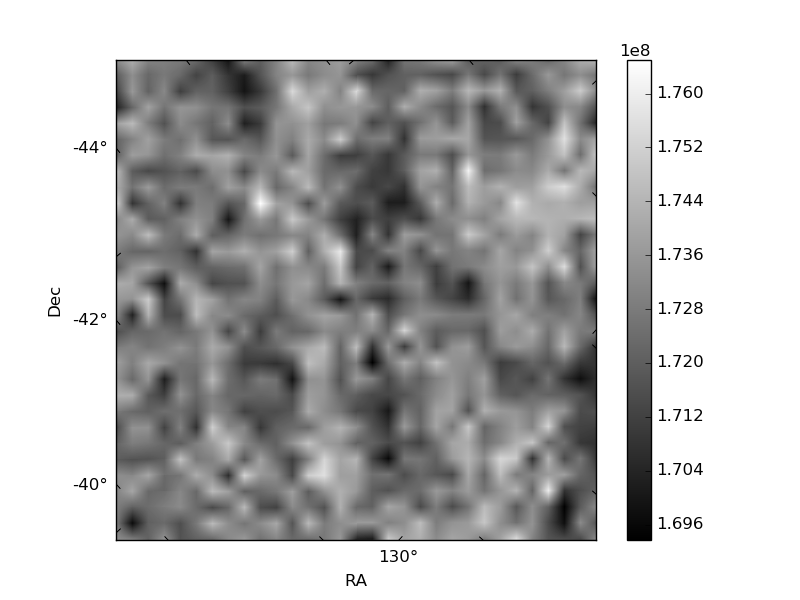
Histogram calculated using DETX and DETY for each event in the final _common_clean file
| Quadrant A | 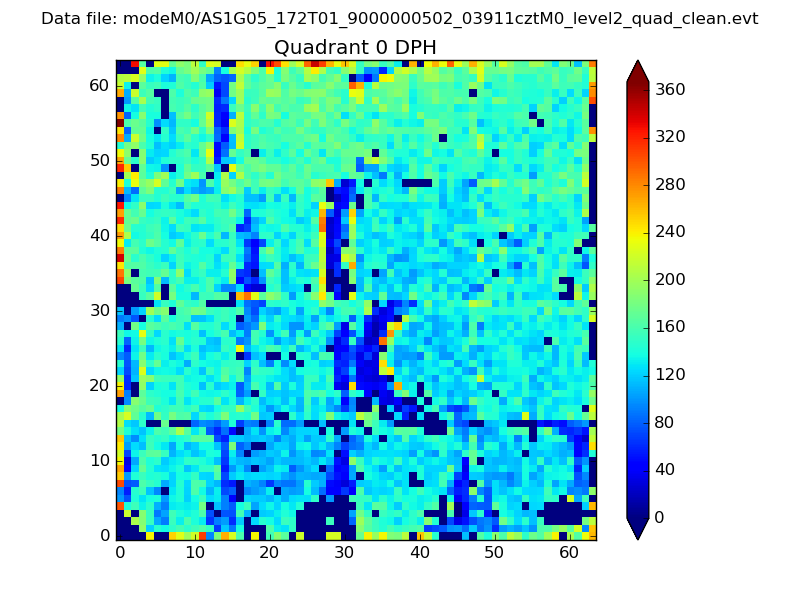 |
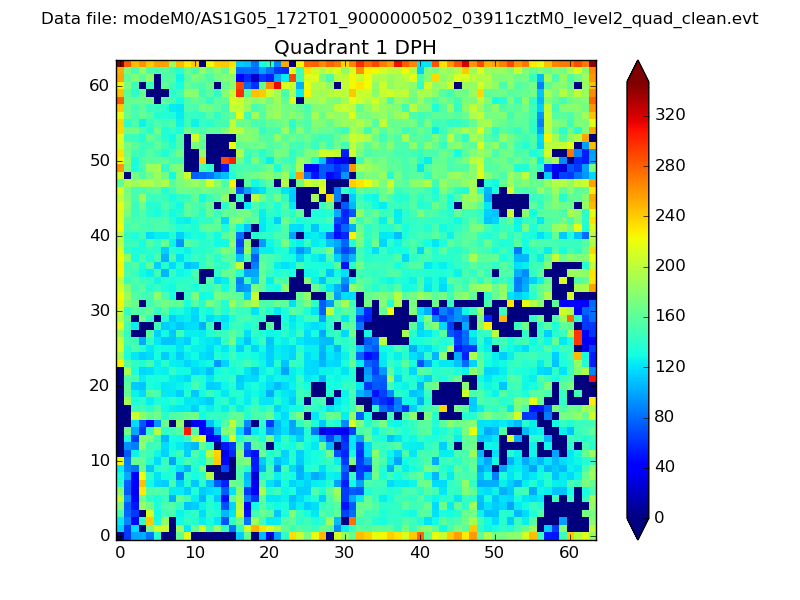 |
Quadrant B |
|---|---|---|---|
| Quadrant D | 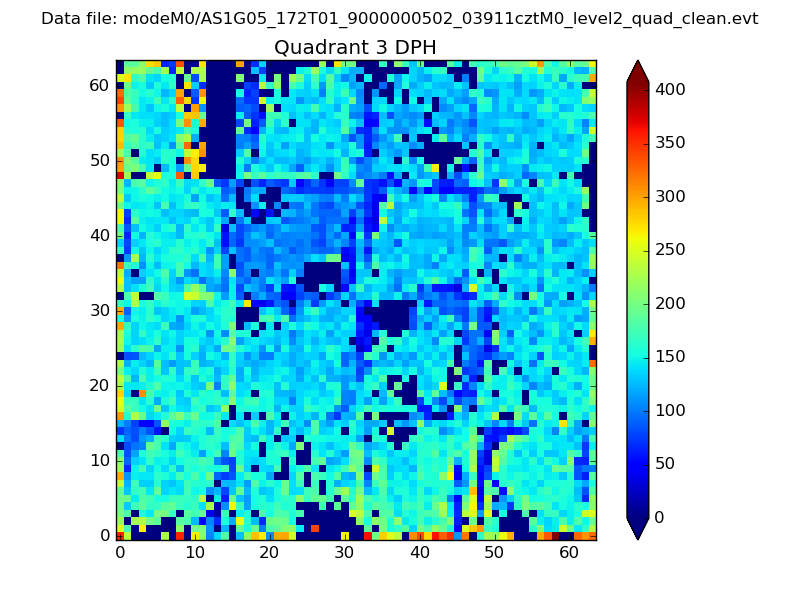 |
 |
Quadrant C |
| Plot type | Count rate plots | Images |
|---|---|---|
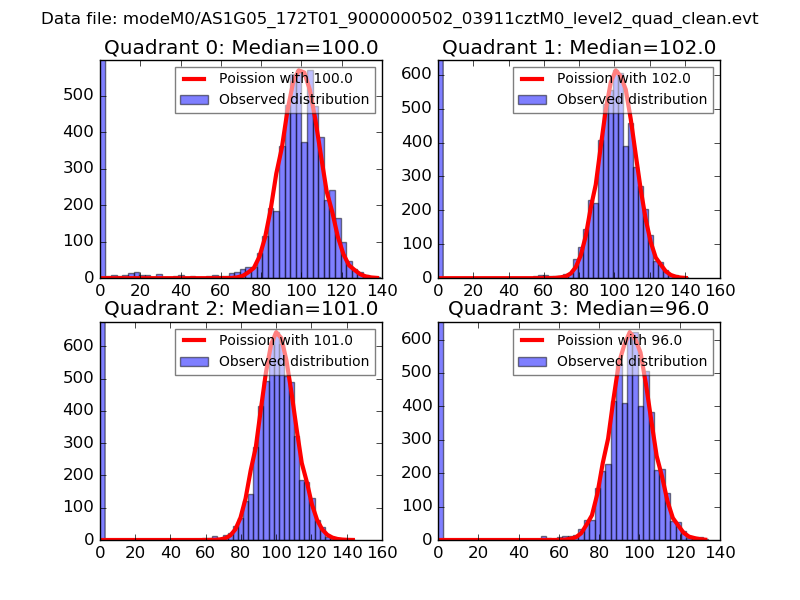
| Comparison with Poisson distribution Blue bars denote a histogram of data divided into 1 sec bins. Red curve is a Poisson curve with rate = median count rate of data. |
 |
 |
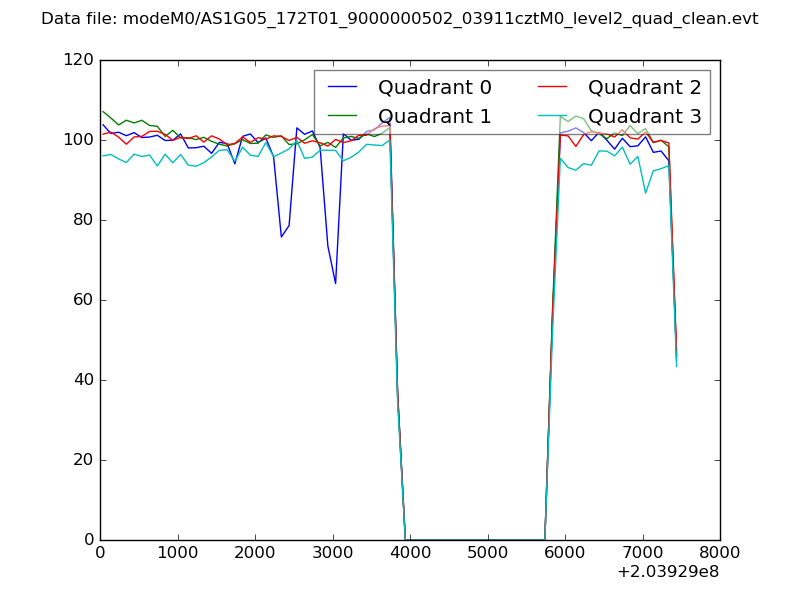
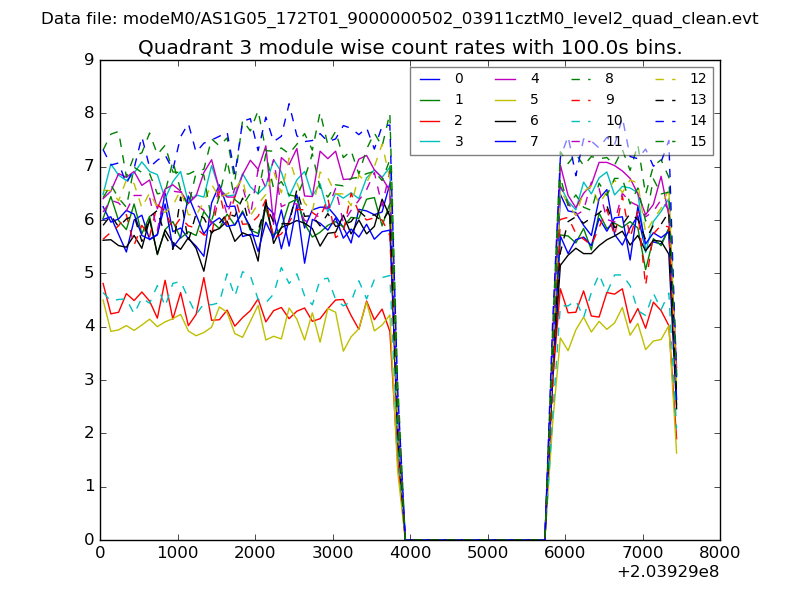
| Quadrant-wise count rates Data is divided into 100 sec bins |
 |
|
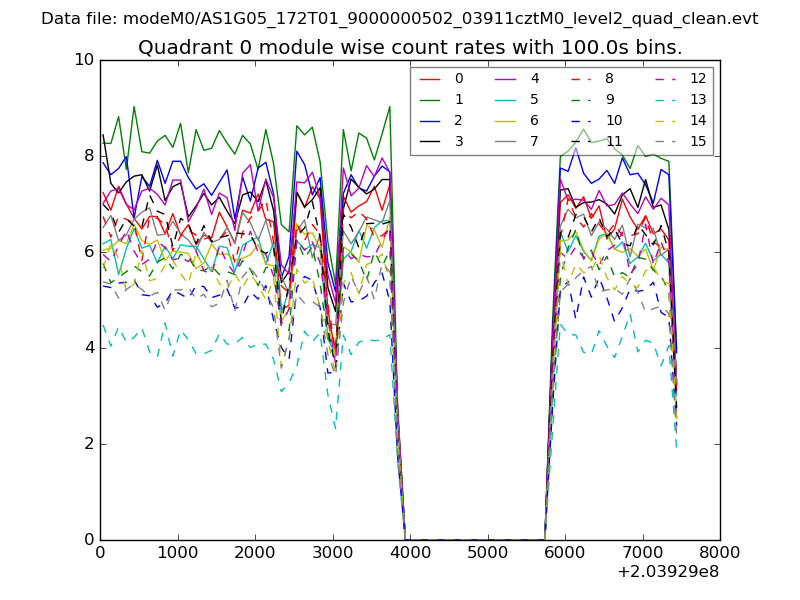
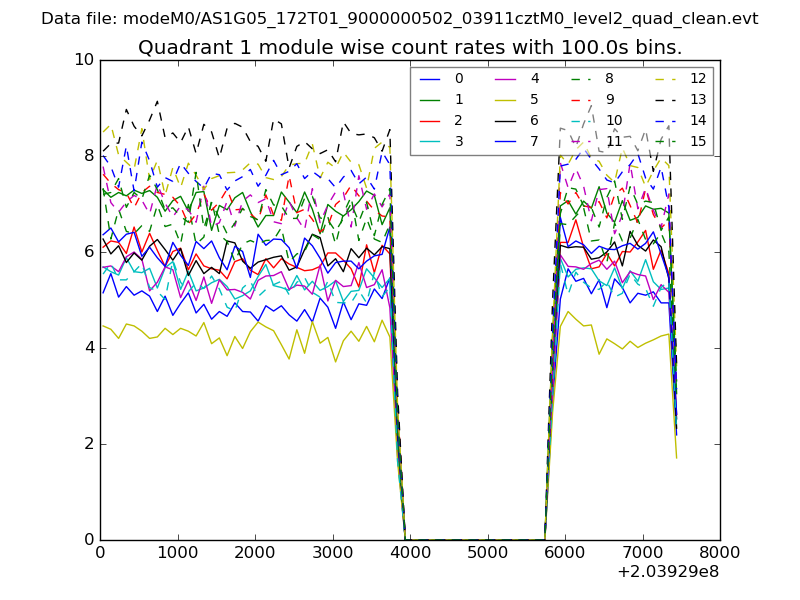
| Module-wise count rates for Quadrant A Data is divided into 100 sec bins |
 |
 |
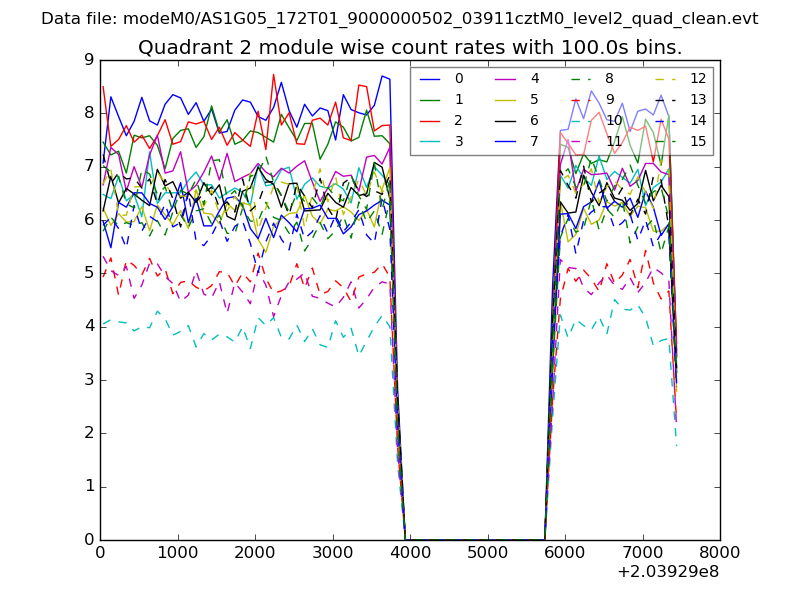
| Module-wise count rates for Quadrant B Data is divided into 100 sec bins |
 |
 |
| Module-wise count rates for Quadrant C Data is divided into 100 sec bins |
 |
 |
| Module-wise count rates for Quadrant D Data is divided into 100 sec bins |
 |
 |
| Parameter | Plot |
|---|---|
| CZT HV Monitor | 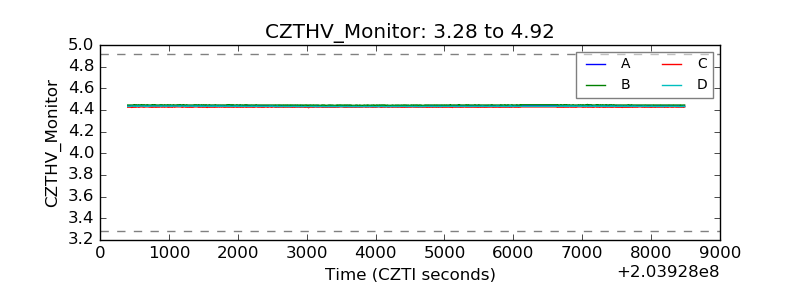 |
| D_VDD | 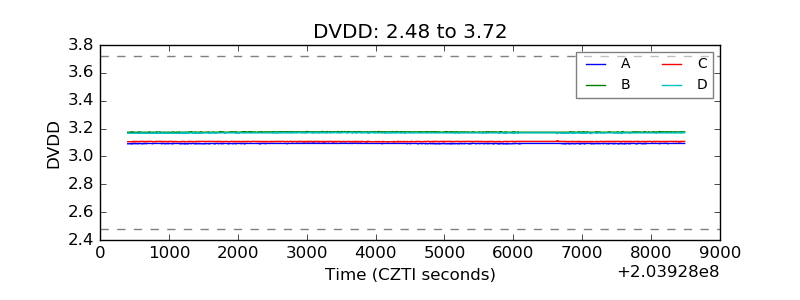 |
| Temperature 1 | 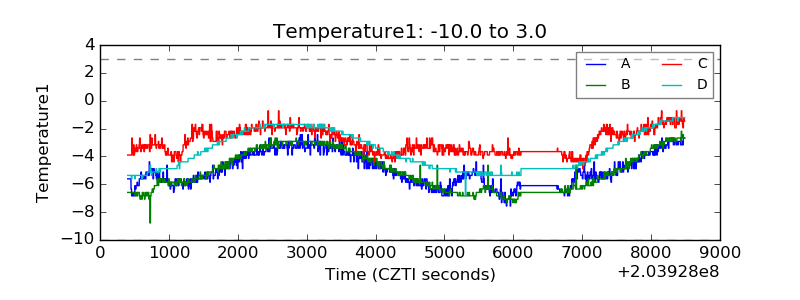 |
| Veto HV Monitor | 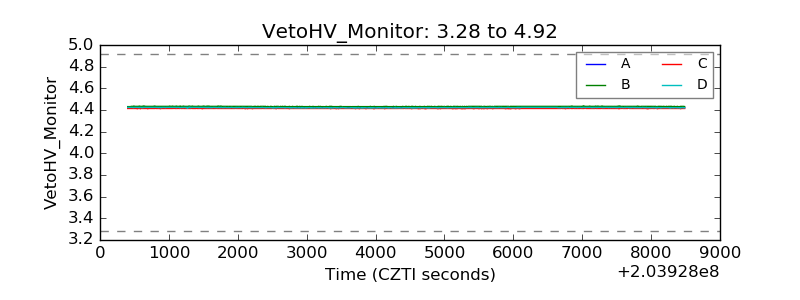 |
| Veto LLD | 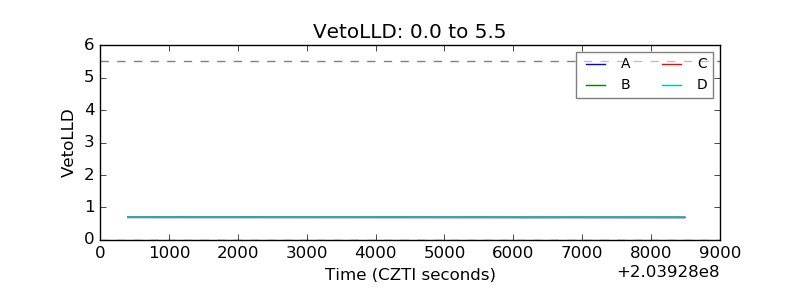 |
| Alpha Counter | 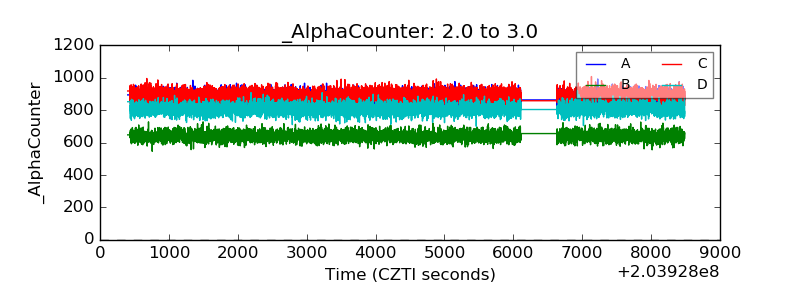 |
| _CPM_Rate | 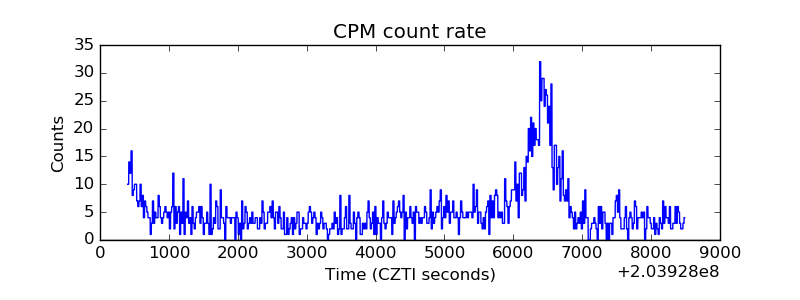 |
| CZT Counter | 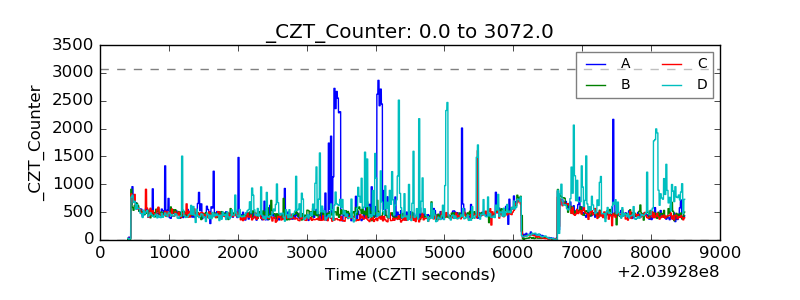 |
| +2.5 Volts monitor |  |
| +5 Volts monitor |  |
| Veto Counter | 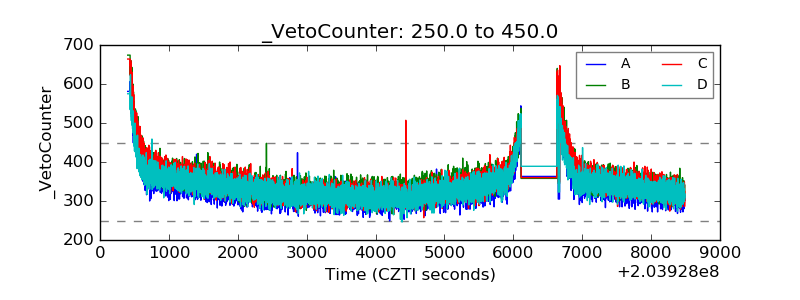 |