| Param | Original file | Final file |
|---|---|---|
| Filename | modeM0/AS1G05_172T01_9000000502_03912cztM0_level2.evt | modeM0/AS1G05_172T01_9000000502_03912cztM0_level2_quad_clean.evt |
| Size (bytes) | 502,007,040 | 86,713,920 |
| Size | 478.8 MB | 82.7 MB |
| Events in quadrant A | 3,777,831 | 528,585 |
| Events in quadrant B | 3,736,438 | 536,113 |
| Events in quadrant C | 3,211,280 | 536,226 |
| Events in quadrant D | 3,979,359 | 514,244 |
| Mode SS | |||
|---|---|---|---|
| Quadrant | BADHDUFLAG | Total packets | Discarded packets |
| A | 0 | 146 | 0 |
| B | 0 | 146 | 0 |
| C | 0 | 146 | 0 |
| D | 0 | 146 | 0 |
| Mode M0 | |||
|---|---|---|---|
| Quadrant | BADHDUFLAG | Total packets | Discarded packets |
| A | 0 | 16320 | 1 |
| B | 0 | 15881 | 0 |
| C | 0 | 15126 | 0 |
| D | 0 | 17248 | 0 |
| Quadrant | Total seconds | Saturated seconds | Saturation percentage |
|---|---|---|---|
| A | 7338 | 246 | 3.352412% |
| B | 7338 | 161 | 2.194058% |
| C | 7338 | 47 | 0.640501% |
| D | 7338 | 143 | 1.948760% |
Noise dominated data is calculated using 1-second bins in cleaned event files. If a bin has >2000 counts, and if more than 50% of those come from <1% of pixels, then it is considered to be noise-dominated and hence unusable.
| Quadrant | # 1 sec bins | Bins with >0 counts | Bins with >2000 counts | High rate bins dominated by noise | Noise dominated (total time) | Noise dominated (detector-on time) | Marked lightcurve |
|---|---|---|---|---|---|---|---|
| A | 7338 | 7338 | 52 | 52 | 0.71% | 0.71% | 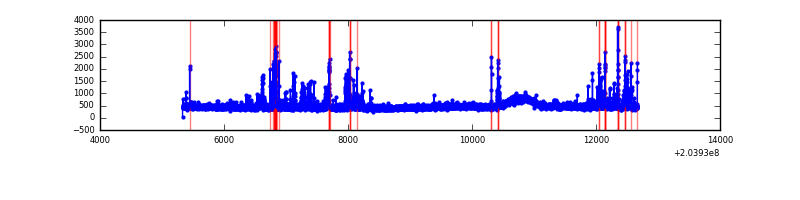 |
| B | 7338 | 7338 | 37 | 37 | 0.50% | 0.50% | 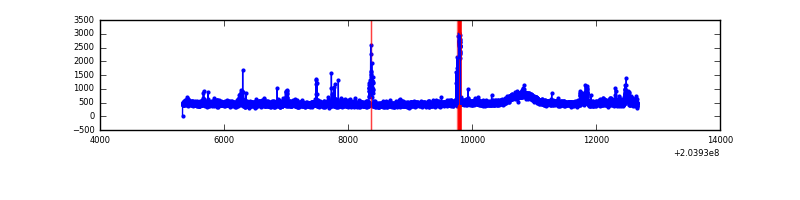 |
| C | 7338 | 7338 | 0 | 0 | 0.00% | 0.00% | 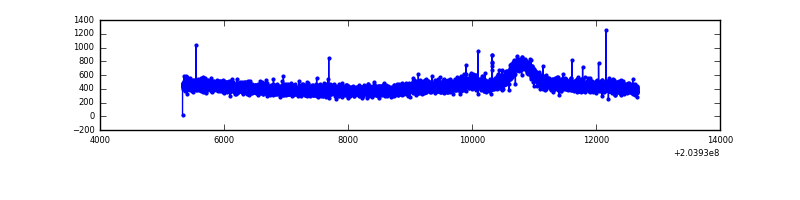 |
| D | 7338 | 7338 | 42 | 42 | 0.57% | 0.57% | 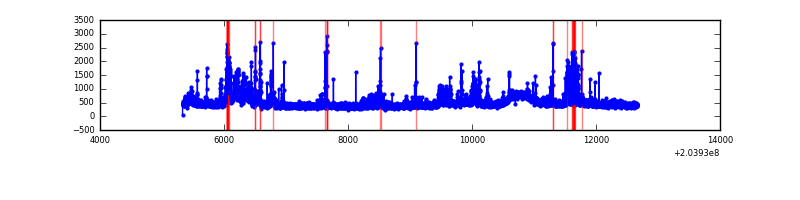 |
Top three noisy pixels from each quadrant. If the there are fewer than three noisy pixels in the level2.evt file, extra rows are filled as -1
| Pixel properties | Quadrant properties | ||||||
|---|---|---|---|---|---|---|---|
| Quadrant | DetID | PixID | Counts | Sigma | Mean | Median | Sigma |
| A | 0 | 118 | 310736 | 1780.36 | 845 | 822 | 174.1 |
| A | 0 | 50 | 97257 | 553.99 | 845 | 822 | 174.1 |
| A | 0 | 226 | 36007 | 202.13 | 845 | 822 | 174.1 |
| B | 15 | 204 | 191423 | 1156.94 | 849 | 828 | 164.7 |
| B | 7 | 221 | 104160 | 627.24 | 849 | 828 | 164.7 |
| B | 0 | 172 | 92585 | 556.98 | 849 | 828 | 164.7 |
| C | 13 | 61 | 6970 | 31.98 | 820 | 822 | 192.2 |
| C | 1 | 16 | 3975 | 16.4 | 820 | 822 | 192.2 |
| C | 7 | 247 | 2464 | 8.54 | 820 | 822 | 192.2 |
| D | 2 | 32 | 667572 | 3359.1 | 823 | 798 | 198.5 |
| D | 13 | 239 | 39503 | 194.99 | 823 | 798 | 198.5 |
| D | 2 | 14 | 34444 | 169.5 | 823 | 798 | 198.5 |
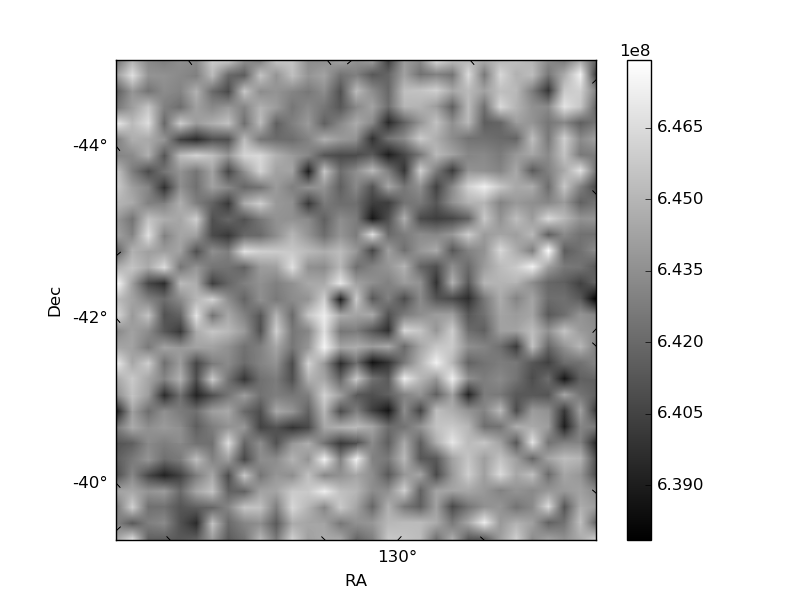
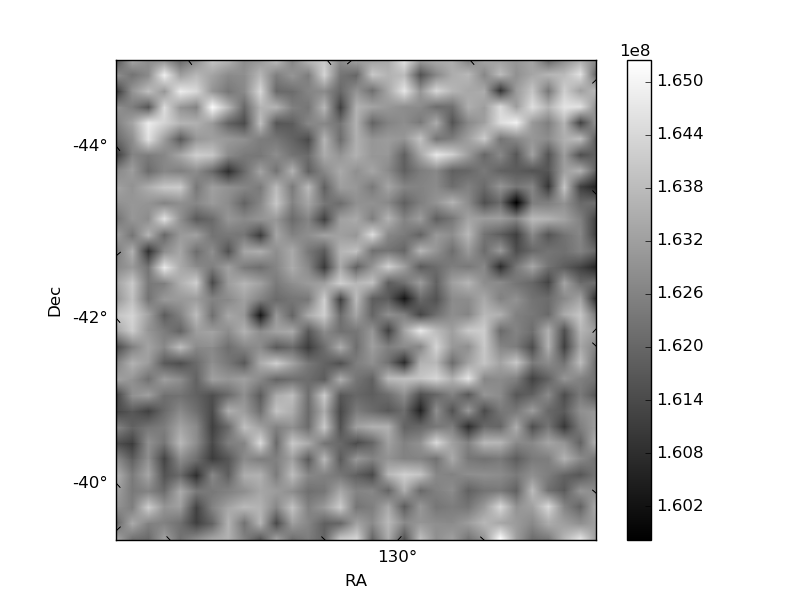
Histogram calculated using DETX and DETY for each event in the final _common_clean file
| Quadrant A | 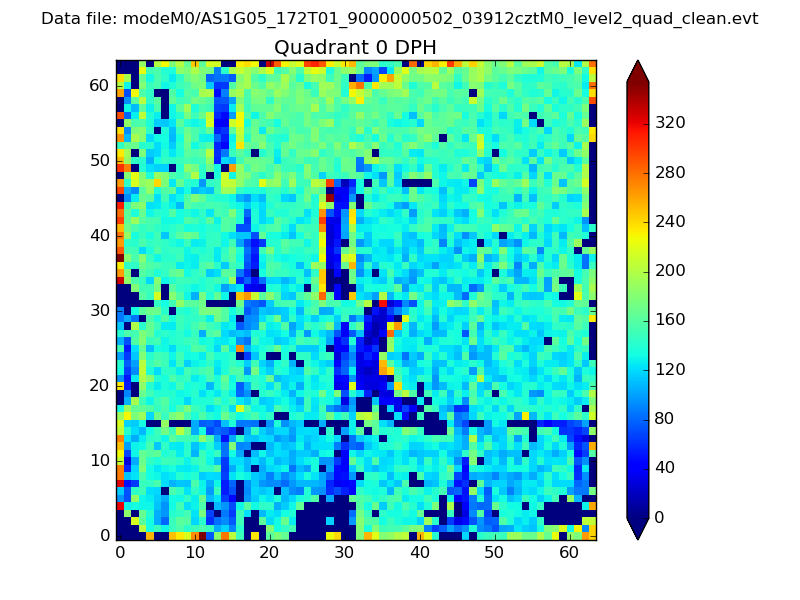 |
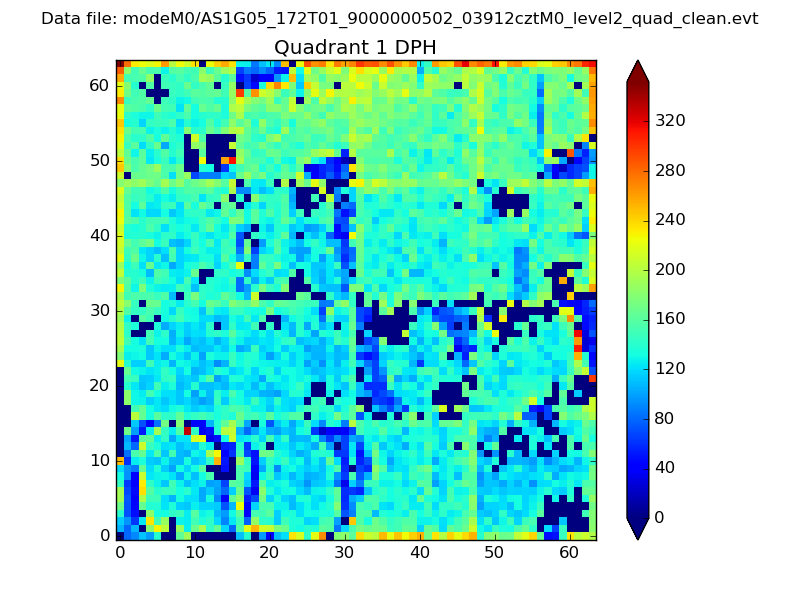 |
Quadrant B |
|---|---|---|---|
| Quadrant D | 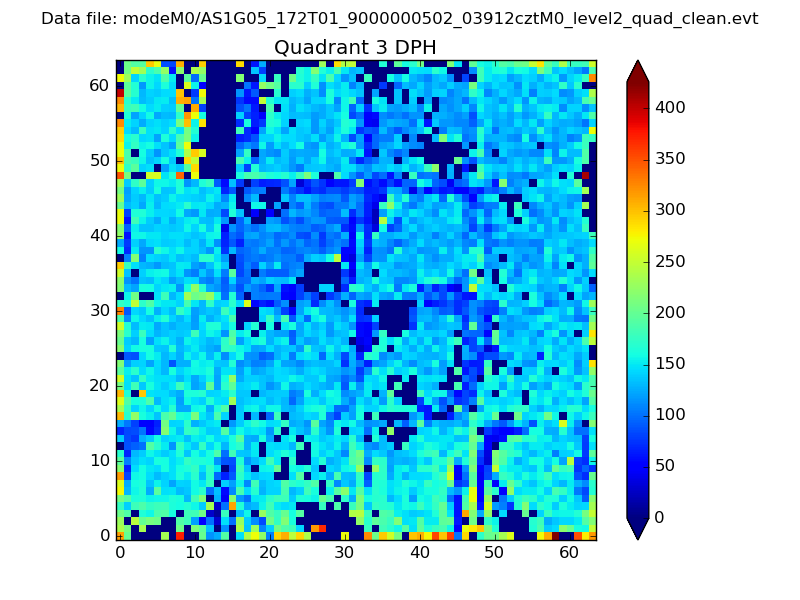 |
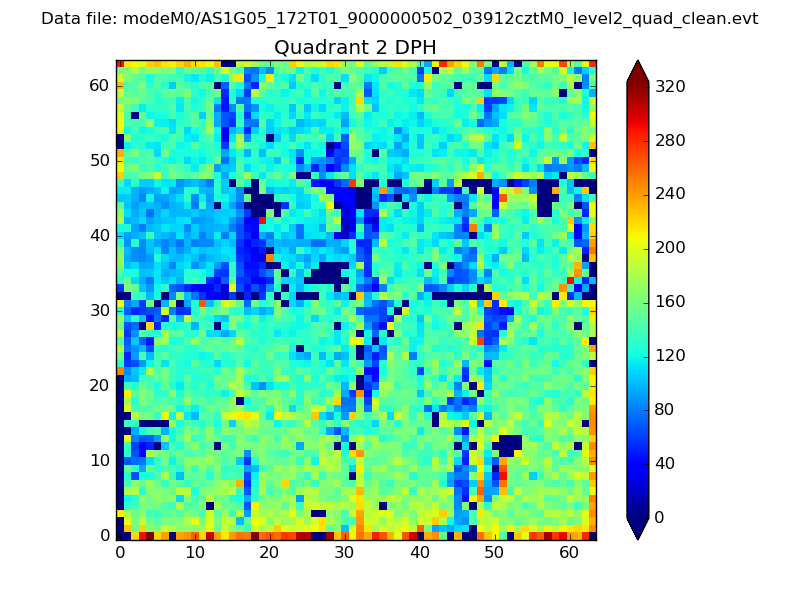 |
Quadrant C |
| Plot type | Count rate plots | Images |
|---|---|---|
| Comparison with Poisson distribution Blue bars denote a histogram of data divided into 1 sec bins. Red curve is a Poisson curve with rate = median count rate of data. |
 |
 |
| Quadrant-wise count rates Data is divided into 100 sec bins |
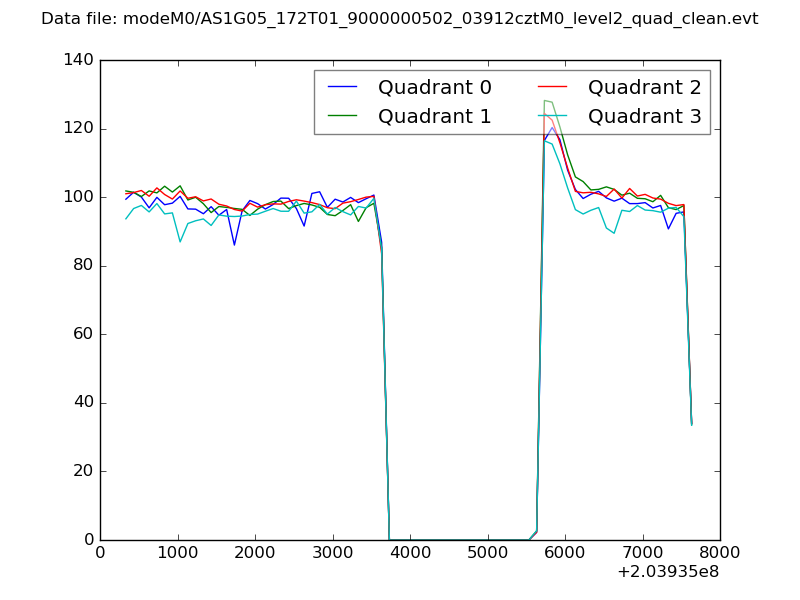 |
|
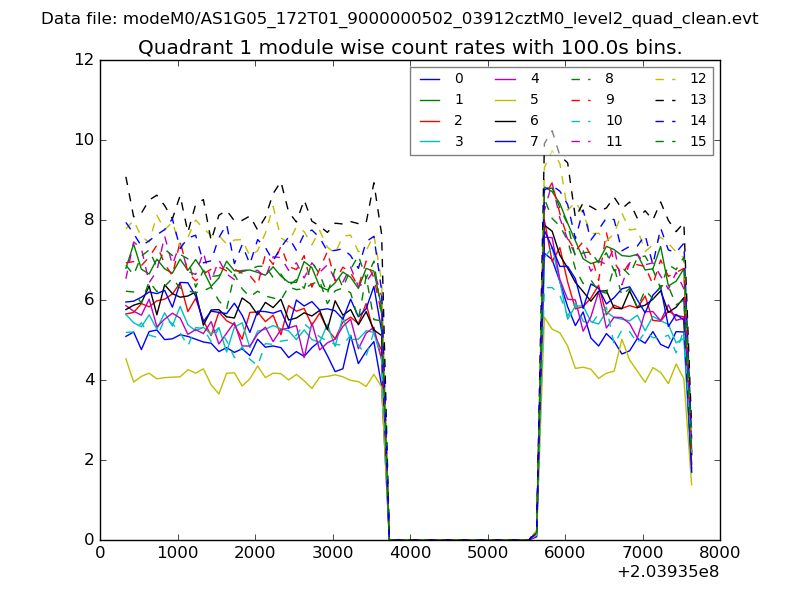
| Module-wise count rates for Quadrant A Data is divided into 100 sec bins |
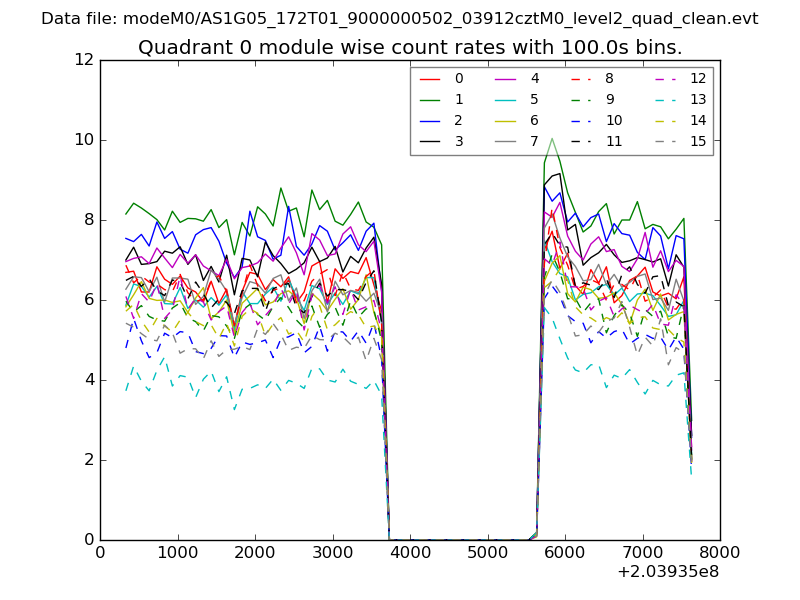 |
 |
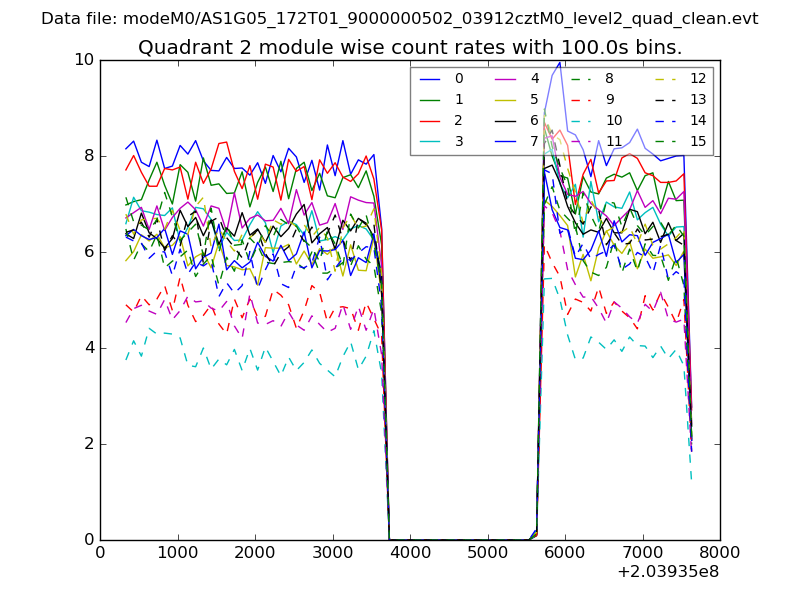
| Module-wise count rates for Quadrant B Data is divided into 100 sec bins |
 |
 |
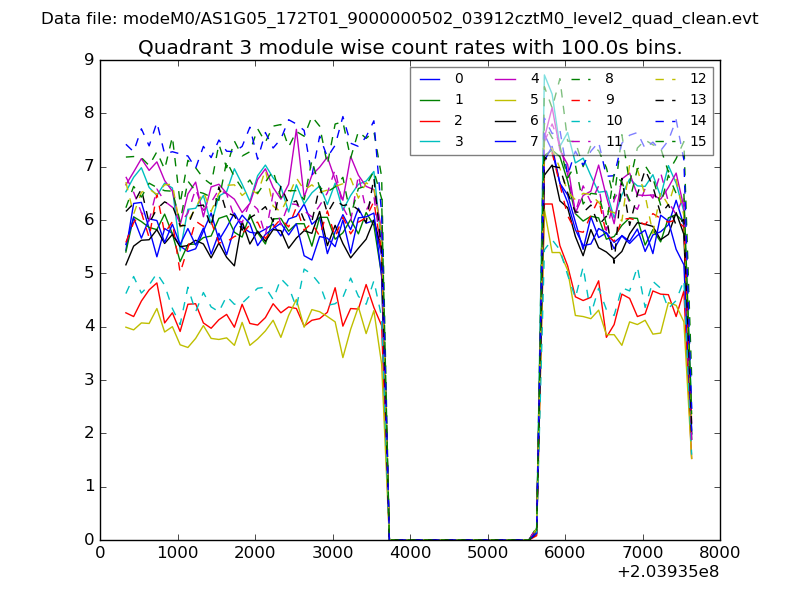
| Module-wise count rates for Quadrant C Data is divided into 100 sec bins |
 |
 |
| Module-wise count rates for Quadrant D Data is divided into 100 sec bins |
 |
 |
| Parameter | Plot |
|---|---|
| CZT HV Monitor | 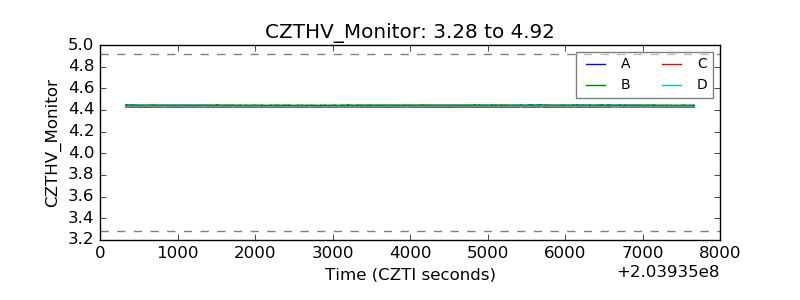 |
| D_VDD | 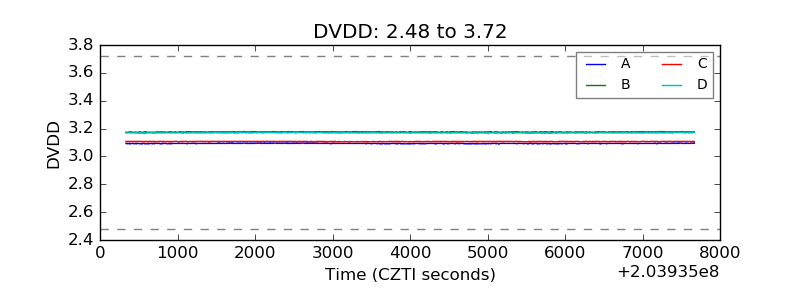 |
| Temperature 1 | 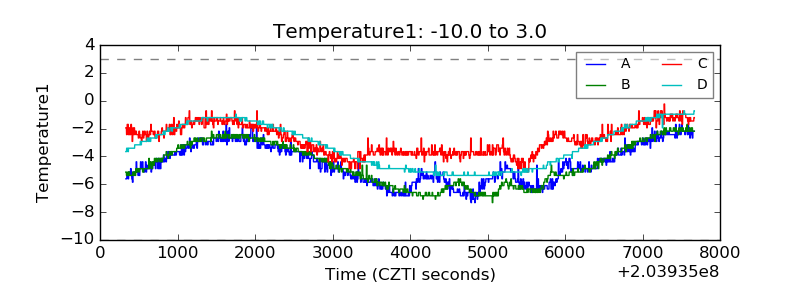 |
| Veto HV Monitor | 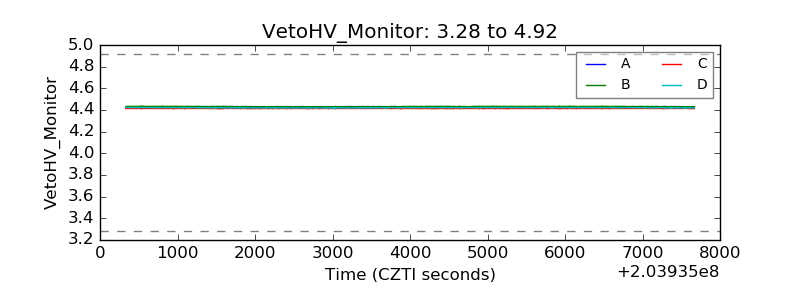 |
| Veto LLD | 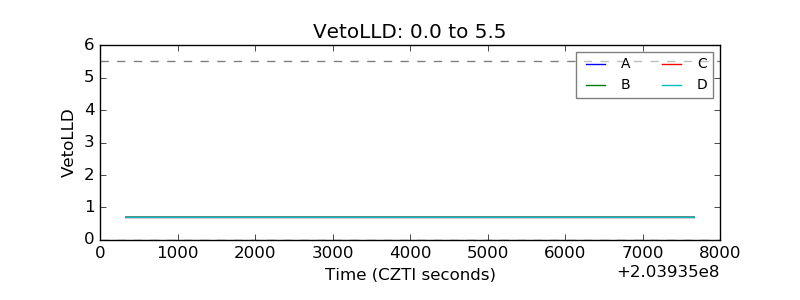 |
| Alpha Counter | 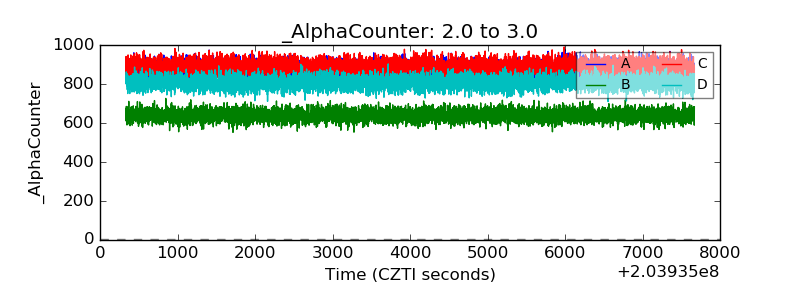 |
| _CPM_Rate | 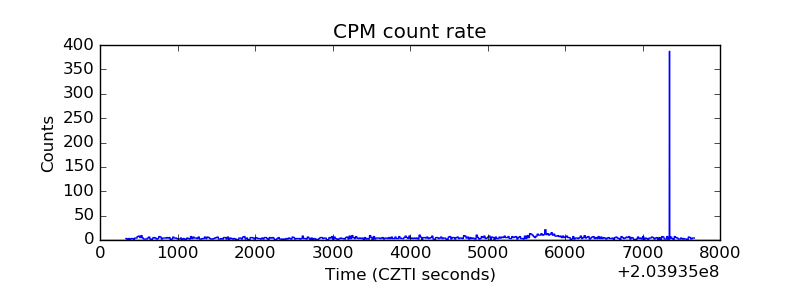 |
| CZT Counter | 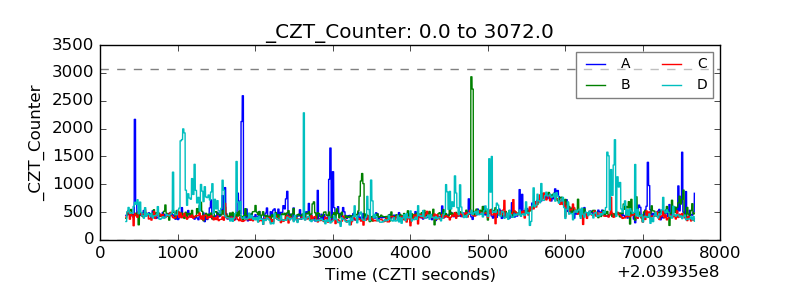 |
| +2.5 Volts monitor | 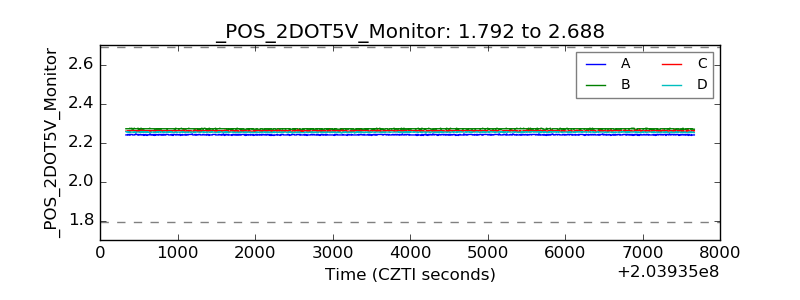 |
| +5 Volts monitor |  |
| Veto Counter | 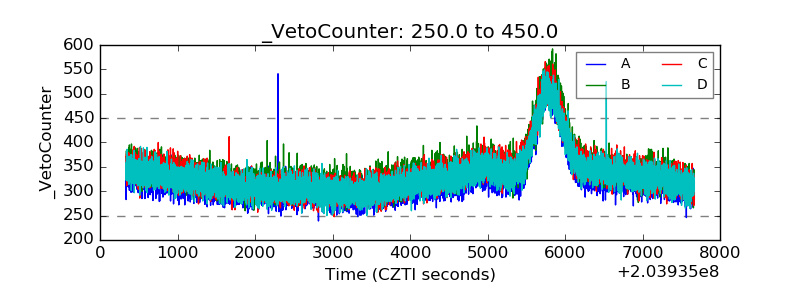 |