| Param | Original file | Final file |
|---|---|---|
| Filename | modeM0/AS1G05_172T01_9000000502_03913cztM0_level2.evt | modeM0/AS1G05_172T01_9000000502_03913cztM0_level2_quad_clean.evt |
| Size (bytes) | 519,762,240 | 89,922,240 |
| Size | 495.7 MB | 85.8 MB |
| Events in quadrant A | 3,735,170 | 552,717 |
| Events in quadrant B | 4,063,229 | 559,073 |
| Events in quadrant C | 3,317,547 | 554,538 |
| Events in quadrant D | 4,112,811 | 531,625 |
| Mode SS | |||
|---|---|---|---|
| Quadrant | BADHDUFLAG | Total packets | Discarded packets |
| A | 0 | 150 | 0 |
| B | 0 | 150 | 0 |
| C | 0 | 150 | 0 |
| D | 0 | 150 | 0 |
| Mode M0 | |||
|---|---|---|---|
| Quadrant | BADHDUFLAG | Total packets | Discarded packets |
| A | 0 | 16352 | 14 |
| B | 0 | 17006 | 5 |
| C | 0 | 15548 | 7 |
| D | 0 | 17785 | 3 |
| Quadrant | Total seconds | Saturated seconds | Saturation percentage |
|---|---|---|---|
| A | 7544 | 170 | 2.253446% |
| B | 7548 | 103 | 1.364600% |
| C | 7547 | 41 | 0.543262% |
| D | 7549 | 229 | 3.033514% |
Noise dominated data is calculated using 1-second bins in cleaned event files. If a bin has >2000 counts, and if more than 50% of those come from <1% of pixels, then it is considered to be noise-dominated and hence unusable.
| Quadrant | # 1 sec bins | Bins with >0 counts | Bins with >2000 counts | High rate bins dominated by noise | Noise dominated (total time) | Noise dominated (detector-on time) | Marked lightcurve |
|---|---|---|---|---|---|---|---|
| A | 7565 | 7551 | 18 | 18 | 0.24% | 0.24% | 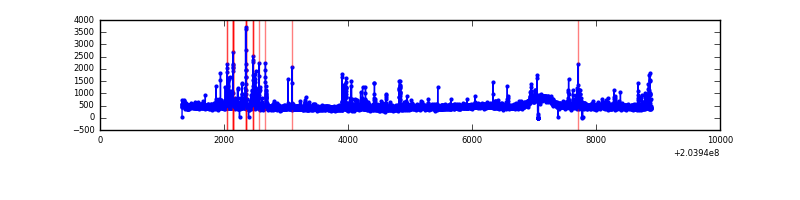 |
| B | 7565 | 7551 | 1 | 1 | 0.01% | 0.01% | 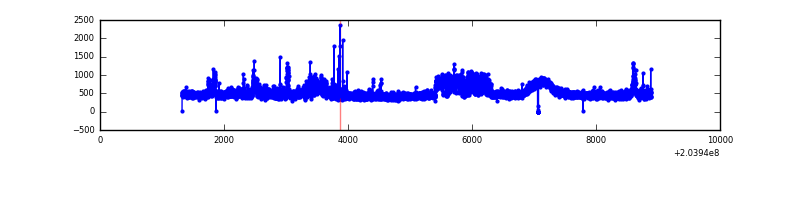 |
| C | 7565 | 7551 | 0 | 0 | 0.00% | 0.00% | 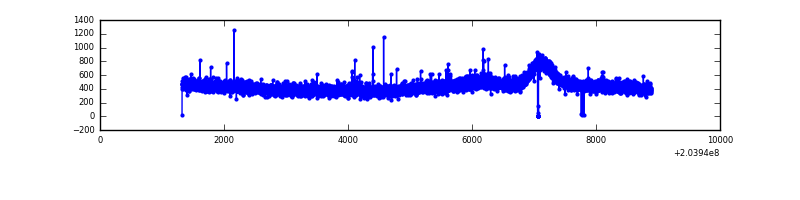 |
| D | 7565 | 7551 | 171 | 171 | 2.26% | 2.26% | 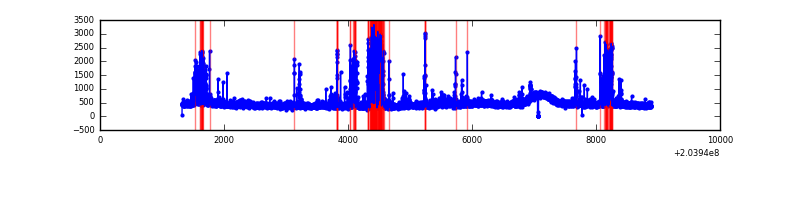 |
Top three noisy pixels from each quadrant. If the there are fewer than three noisy pixels in the level2.evt file, extra rows are filled as -1
| Pixel properties | Quadrant properties | ||||||
|---|---|---|---|---|---|---|---|
| Quadrant | DetID | PixID | Counts | Sigma | Mean | Median | Sigma |
| A | 0 | 118 | 215640 | 1198.23 | 870 | 849 | 179.3 |
| A | 0 | 50 | 68182 | 375.62 | 870 | 849 | 179.3 |
| A | 0 | 226 | 28378 | 153.57 | 870 | 849 | 179.3 |
| B | 7 | 221 | 380683 | 2216.19 | 876 | 854 | 171.4 |
| B | 15 | 204 | 244068 | 1419.08 | 876 | 854 | 171.4 |
| B | 5 | 171 | 18543 | 103.21 | 876 | 854 | 171.4 |
| C | 10 | 65 | 11726 | 55.1 | 841 | 842 | 197.5 |
| C | 1 | 16 | 9298 | 42.81 | 841 | 842 | 197.5 |
| C | 13 | 61 | 7128 | 31.82 | 841 | 842 | 197.5 |
| D | 2 | 232 | 514272 | 2530.99 | 838 | 811 | 202.9 |
| D | 2 | 32 | 211666 | 1039.36 | 838 | 811 | 202.9 |
| D | 13 | 223 | 49053 | 237.8 | 838 | 811 | 202.9 |
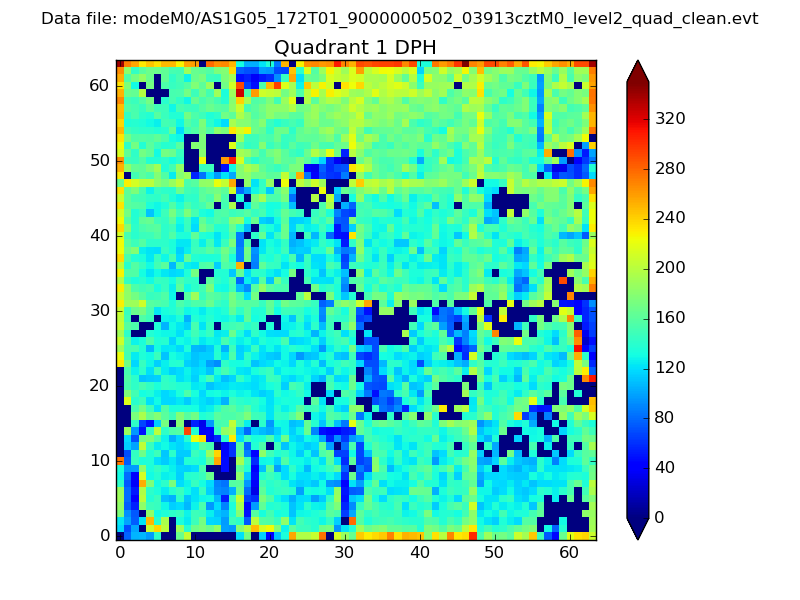
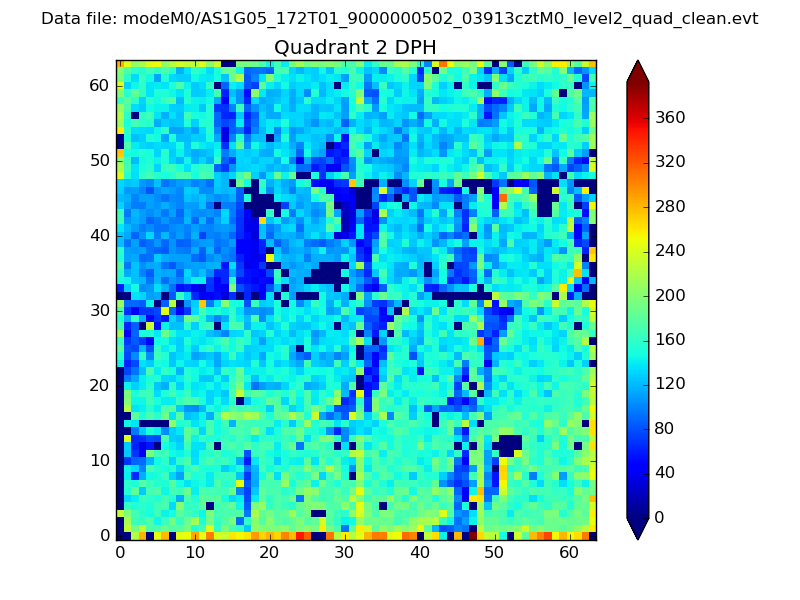
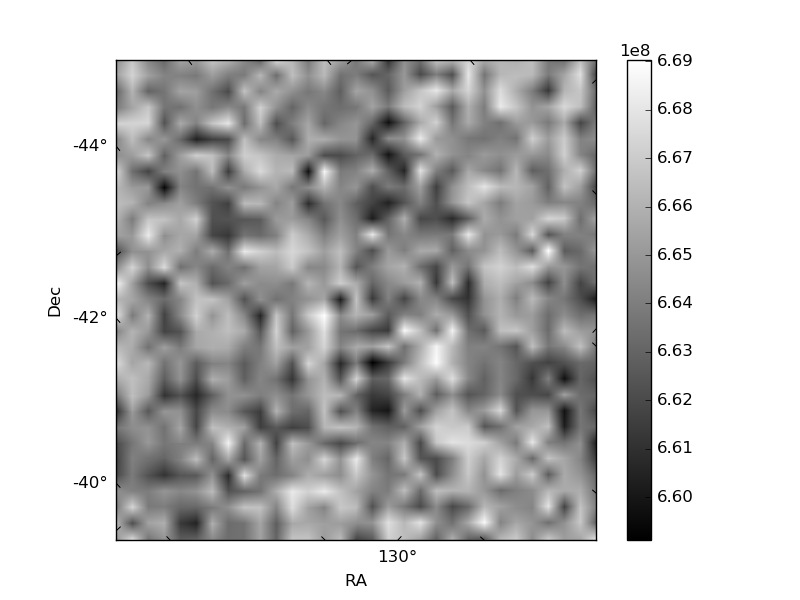
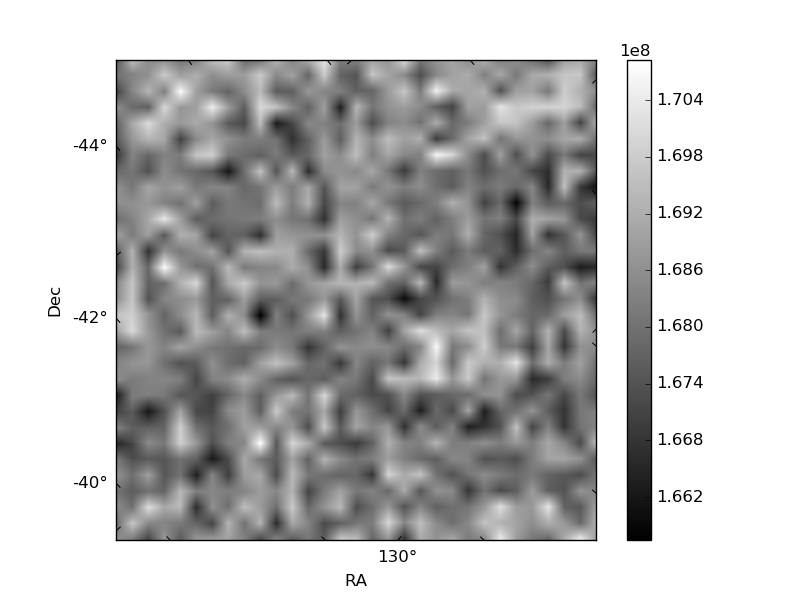
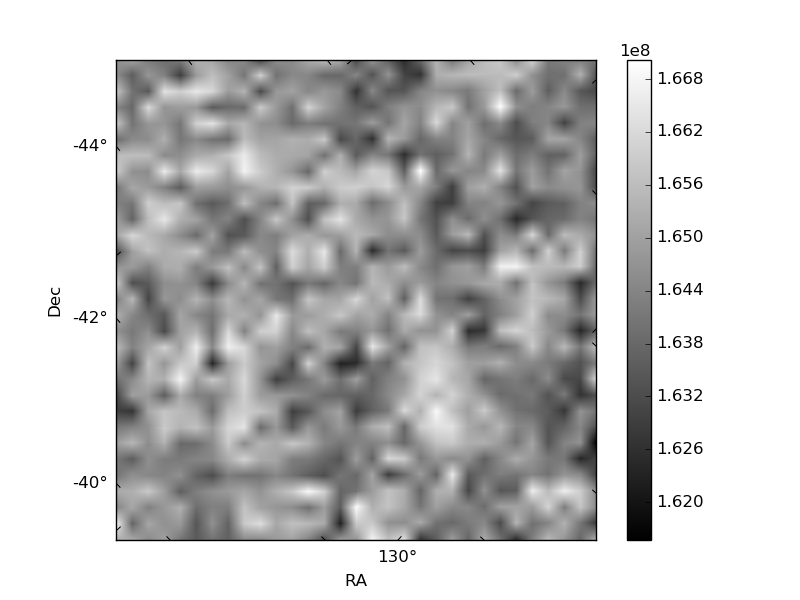
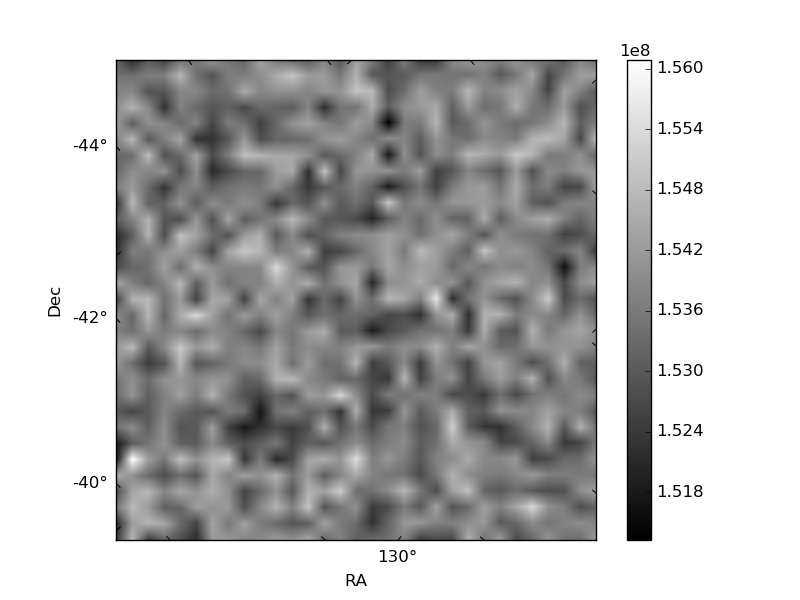
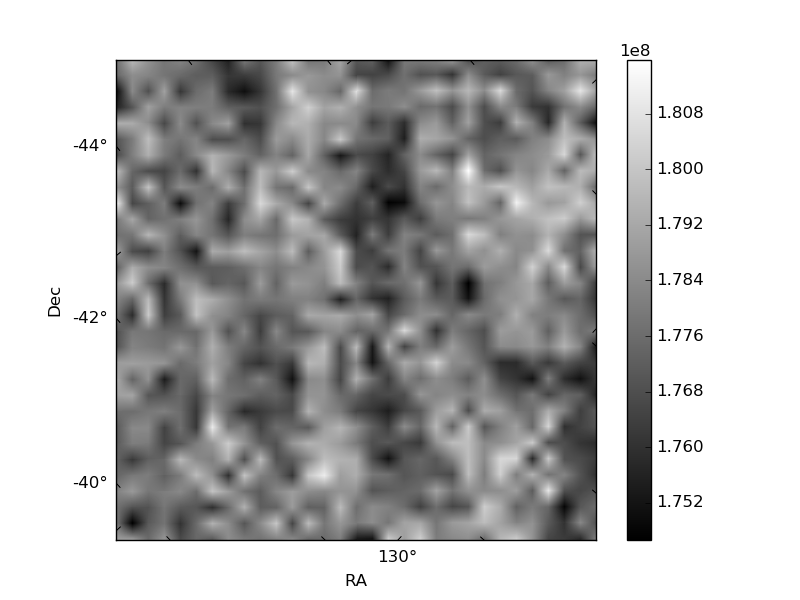
Histogram calculated using DETX and DETY for each event in the final _common_clean file
| Quadrant A |  |
 |
Quadrant B |
|---|---|---|---|
| Quadrant D | 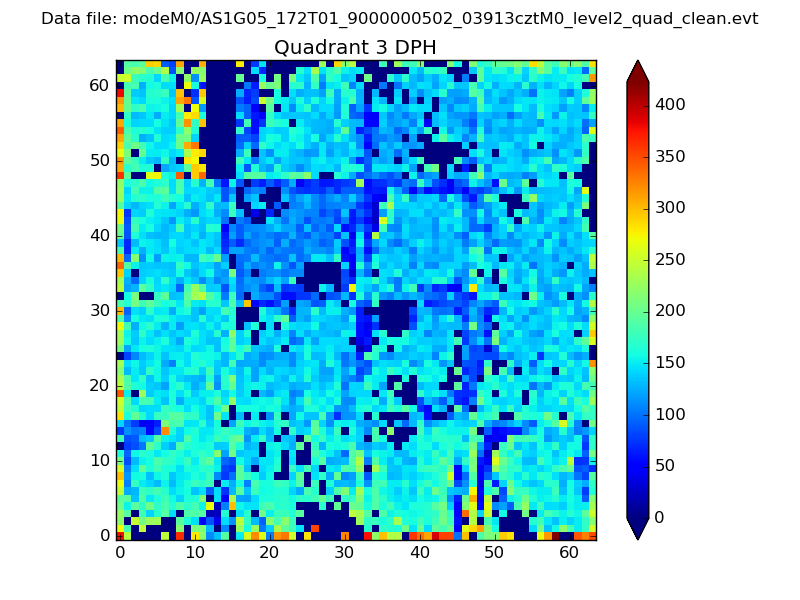 |
 |
Quadrant C |
| Plot type | Count rate plots | Images |
|---|---|---|
| Comparison with Poisson distribution Blue bars denote a histogram of data divided into 1 sec bins. Red curve is a Poisson curve with rate = median count rate of data. |
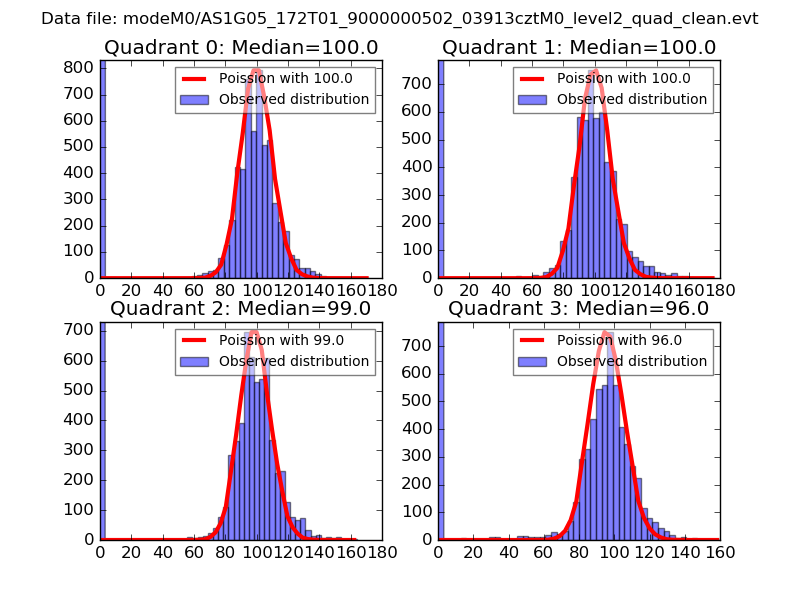 |
 |
| Quadrant-wise count rates Data is divided into 100 sec bins |
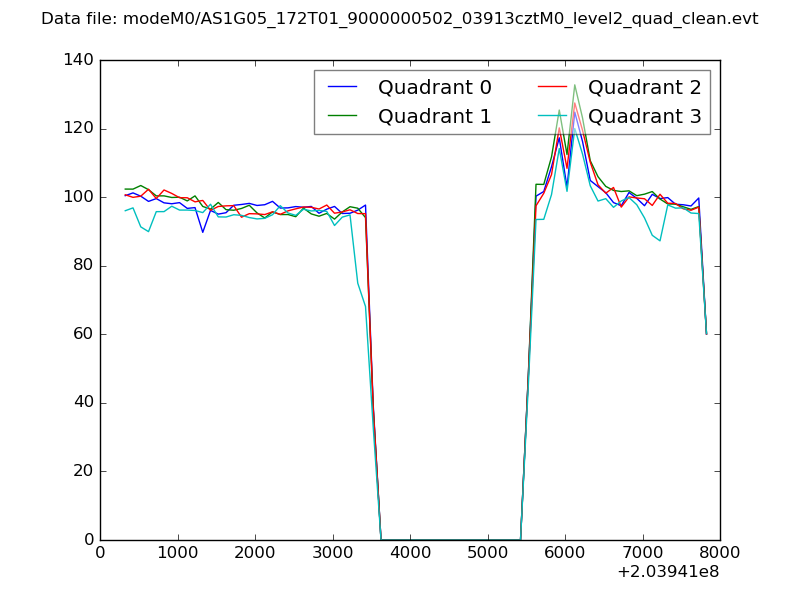 |
|
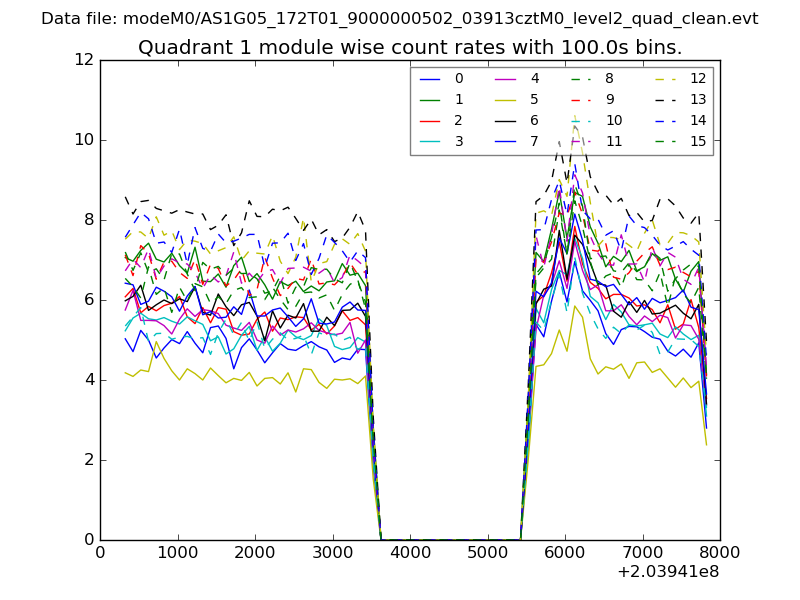
| Module-wise count rates for Quadrant A Data is divided into 100 sec bins |
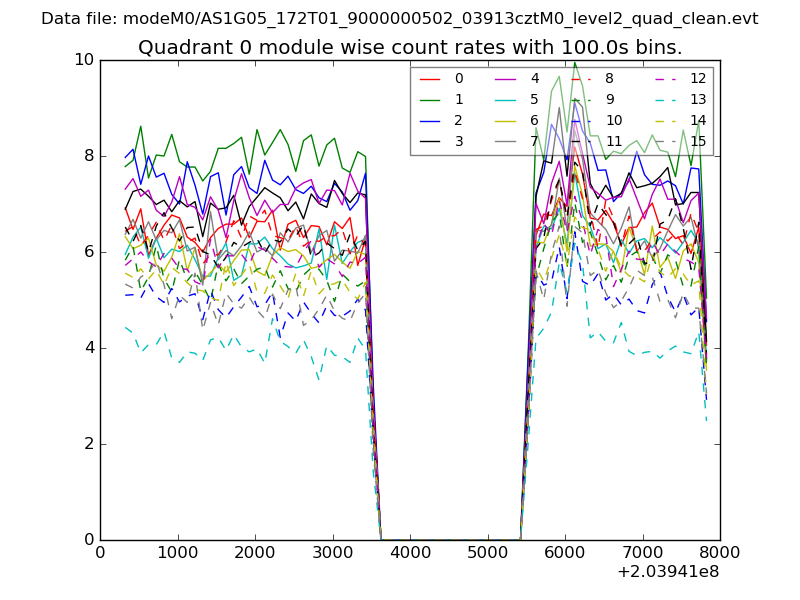 |
 |
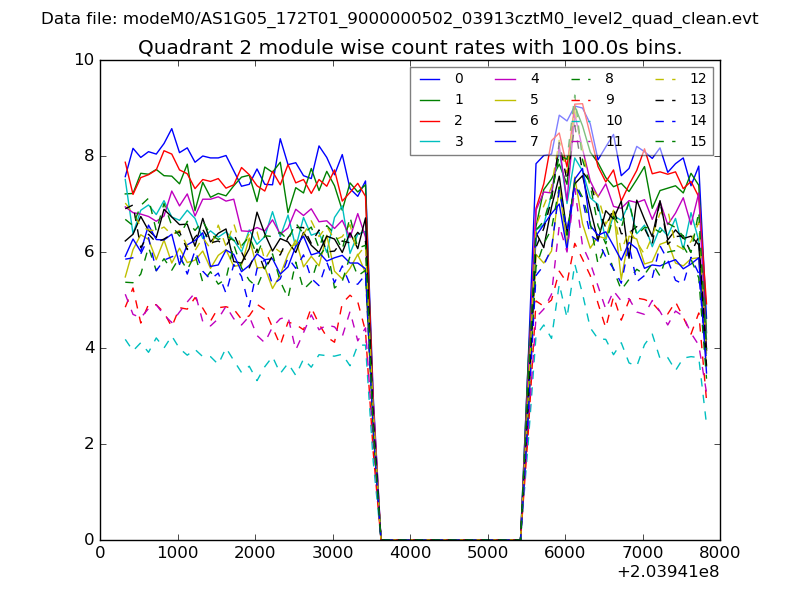
| Module-wise count rates for Quadrant B Data is divided into 100 sec bins |
 |
 |
| Module-wise count rates for Quadrant C Data is divided into 100 sec bins |
 |
 |
| Module-wise count rates for Quadrant D Data is divided into 100 sec bins |
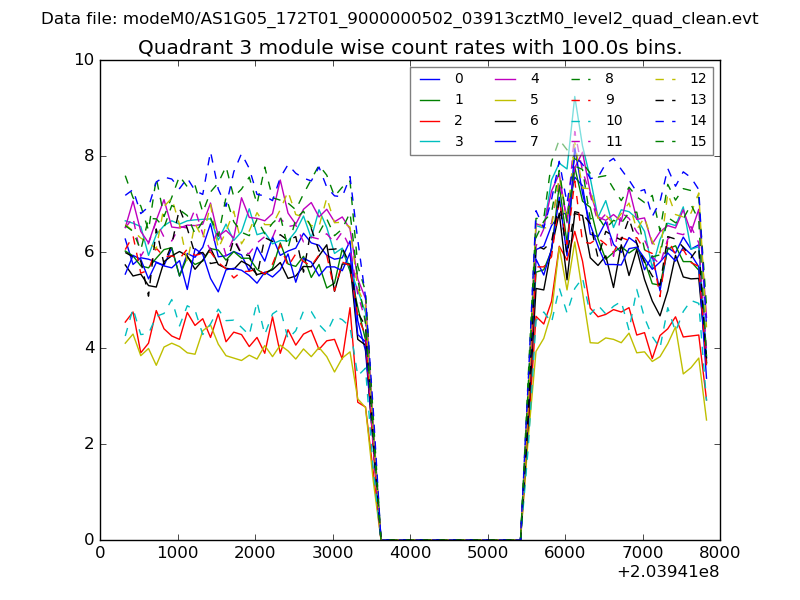 |
 |
| Parameter | Plot |
|---|---|
| CZT HV Monitor | 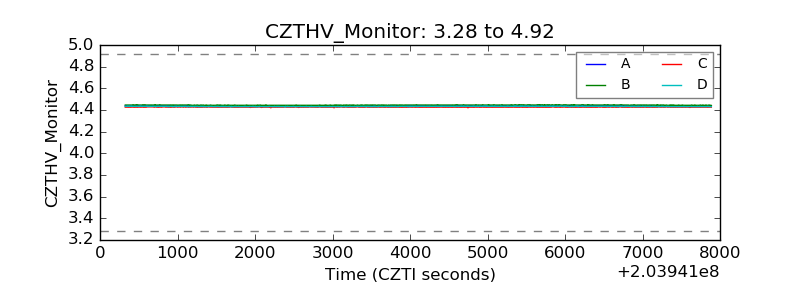 |
| D_VDD | 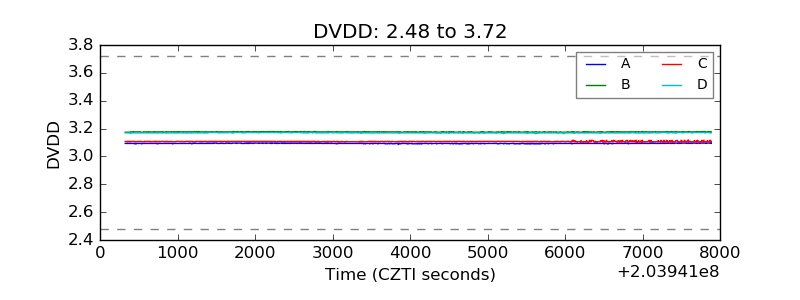 |
| Temperature 1 | 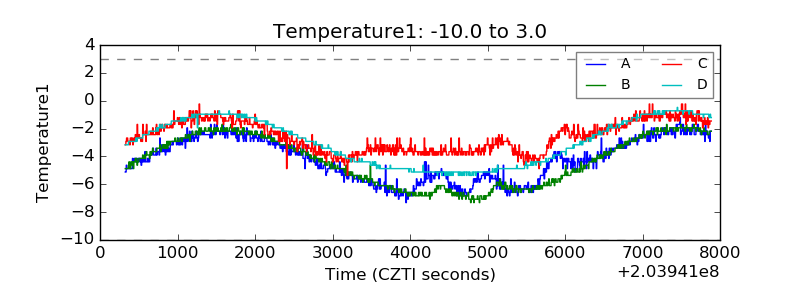 |
| Veto HV Monitor | 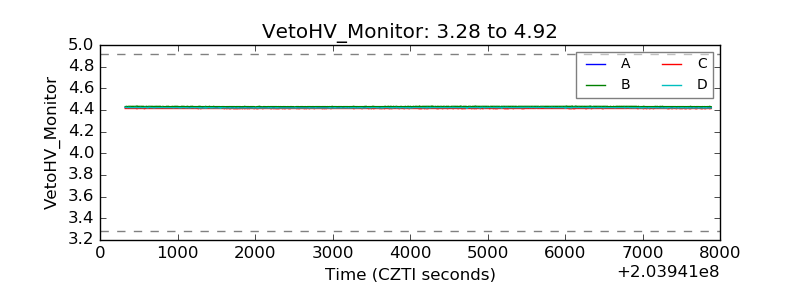 |
| Veto LLD | 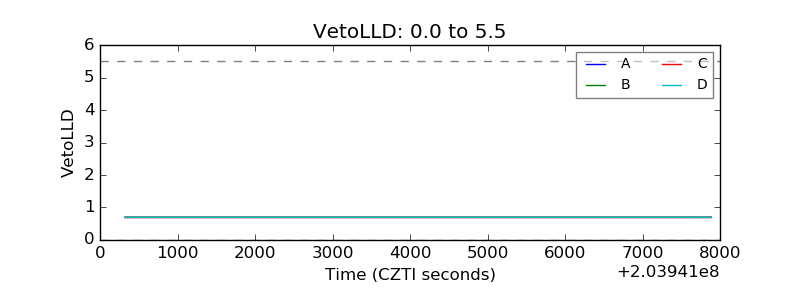 |
| Alpha Counter | 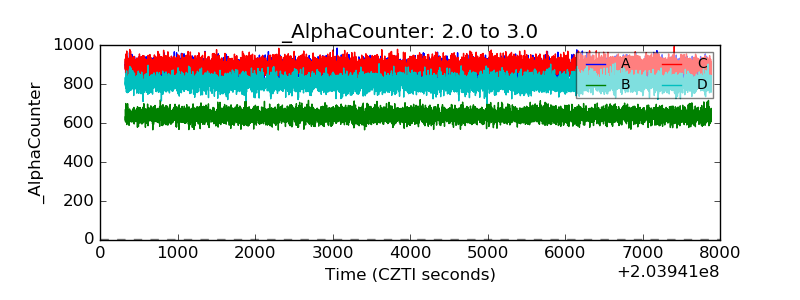 |
| _CPM_Rate | 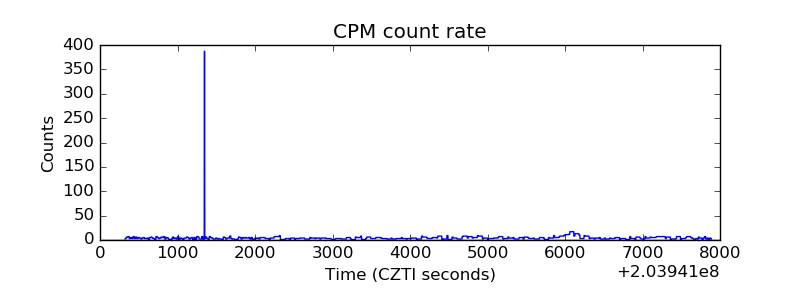 |
| CZT Counter | 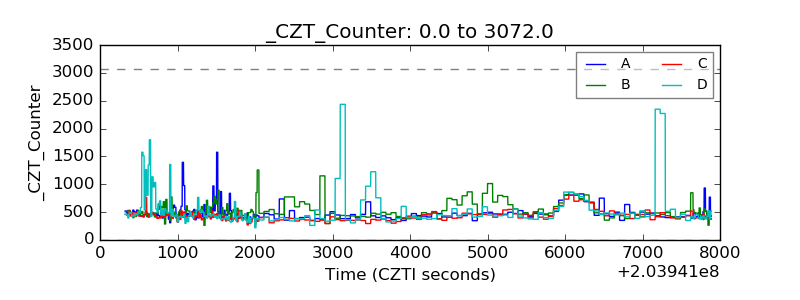 |
| +2.5 Volts monitor |  |
| +5 Volts monitor | 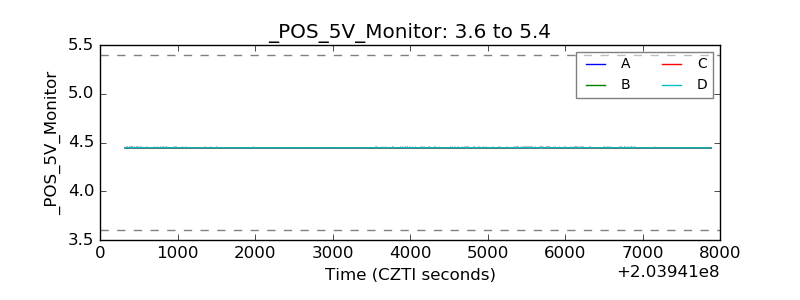 |
| Veto Counter | 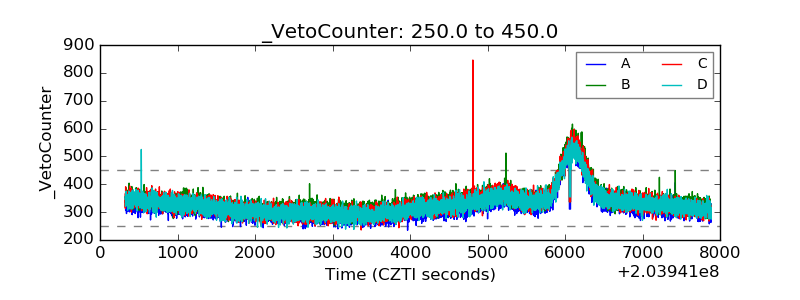 |