| Param | Original file | Final file |
|---|---|---|
| Filename | modeM0/AS1G05_172T01_9000000502_03916cztM0_level2.evt | modeM0/AS1G05_172T01_9000000502_03916cztM0_level2_quad_clean.evt |
| Size (bytes) | 1,306,837,440 | 195,808,320 |
| Size | 1.2 GB | 186.7 MB |
| Events in quadrant A | 9,353,546 | 1,184,940 |
| Events in quadrant B | 9,673,721 | 1,185,306 |
| Events in quadrant C | 7,642,382 | 1,193,144 |
| Events in quadrant D | 11,695,784 | 1,130,198 |
| Mode SS | |||
|---|---|---|---|
| Quadrant | BADHDUFLAG | Total packets | Discarded packets |
| A | 0 | 366 | 0 |
| B | 0 | 366 | 0 |
| C | 0 | 366 | 2 |
| D | 0 | 366 | 4 |
| Mode M9 | |||
|---|---|---|---|
| Quadrant | BADHDUFLAG | Total packets | Discarded packets |
| A | 0 | 16 | 0 |
| B | 0 | 16 | 0 |
| C | 0 | 16 | 0 |
| D | 0 | 16 | 0 |
| Mode M0 | |||
|---|---|---|---|
| Quadrant | BADHDUFLAG | Total packets | Discarded packets |
| A | 0 | 40429 | 136 |
| B | 0 | 40579 | 107 |
| C | 0 | 36376 | 83 |
| D | 0 | 47696 | 251 |
| Quadrant | Total seconds | Saturated seconds | Saturation percentage |
|---|---|---|---|
| A | 17932 | 479 | 2.671202% |
| B | 17937 | 344 | 1.917823% |
| C | 17939 | 45 | 0.250850% |
| D | 17919 | 1041 | 5.809476% |
Noise dominated data is calculated using 1-second bins in cleaned event files. If a bin has >2000 counts, and if more than 50% of those come from <1% of pixels, then it is considered to be noise-dominated and hence unusable.
| Quadrant | # 1 sec bins | Bins with >0 counts | Bins with >2000 counts | High rate bins dominated by noise | Noise dominated (total time) | Noise dominated (detector-on time) | Marked lightcurve |
|---|---|---|---|---|---|---|---|
| A | 19624 | 17981 | 297 | 297 | 1.51% | 1.65% | 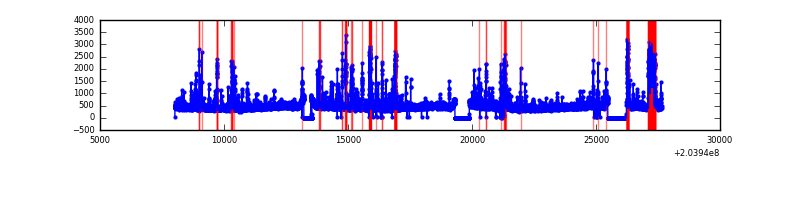 |
| B | 19624 | 17980 | 204 | 204 | 1.04% | 1.13% | 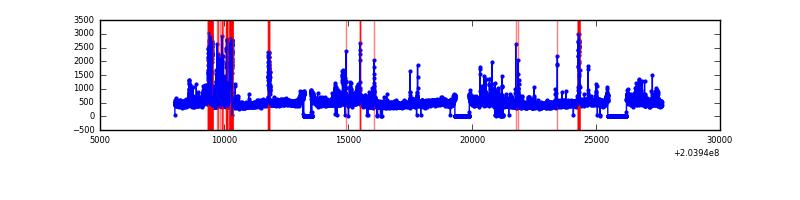 |
| C | 19624 | 17982 | 1 | 1 | 0.01% | 0.01% | 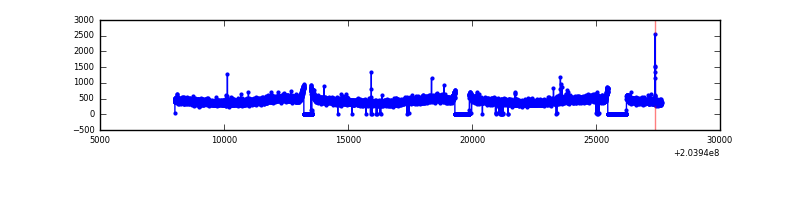 |
| D | 19624 | 17973 | 899 | 899 | 4.58% | 5.00% | 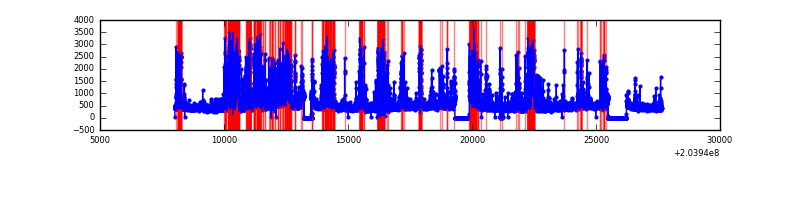 |
Top three noisy pixels from each quadrant. If the there are fewer than three noisy pixels in the level2.evt file, extra rows are filled as -1
| Pixel properties | Quadrant properties | ||||||
|---|---|---|---|---|---|---|---|
| Quadrant | DetID | PixID | Counts | Sigma | Mean | Median | Sigma |
| A | 0 | 50 | 687338 | 1698.89 | 1983 | 1937 | 403.4 |
| A | 0 | 118 | 548424 | 1354.57 | 1983 | 1937 | 403.4 |
| A | 2 | 79 | 108921 | 265.18 | 1983 | 1937 | 403.4 |
| B | 15 | 204 | 833649 | 2138.85 | 2011 | 1963 | 388.8 |
| B | 10 | 16 | 678535 | 1739.94 | 2011 | 1963 | 388.8 |
| B | 5 | 172 | 144109 | 365.56 | 2011 | 1963 | 388.8 |
| C | 8 | 128 | 32141 | 67.07 | 1931 | 1935 | 450.4 |
| C | 10 | 65 | 23045 | 46.87 | 1931 | 1935 | 450.4 |
| C | 13 | 61 | 16388 | 32.09 | 1931 | 1935 | 450.4 |
| D | 2 | 232 | 2376556 | 5247.89 | 1880 | 1824 | 452.5 |
| D | 9 | 82 | 981963 | 2166.0 | 1880 | 1824 | 452.5 |
| D | 12 | 233 | 287370 | 631.02 | 1880 | 1824 | 452.5 |
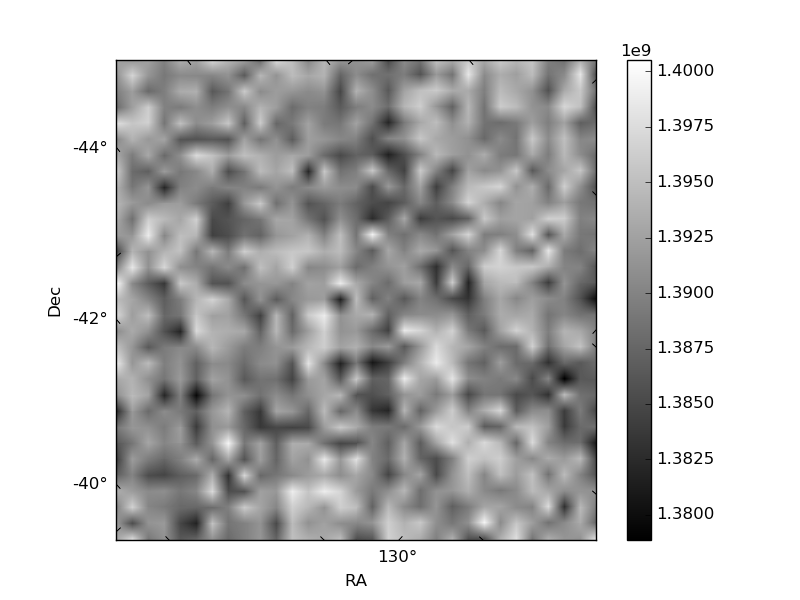
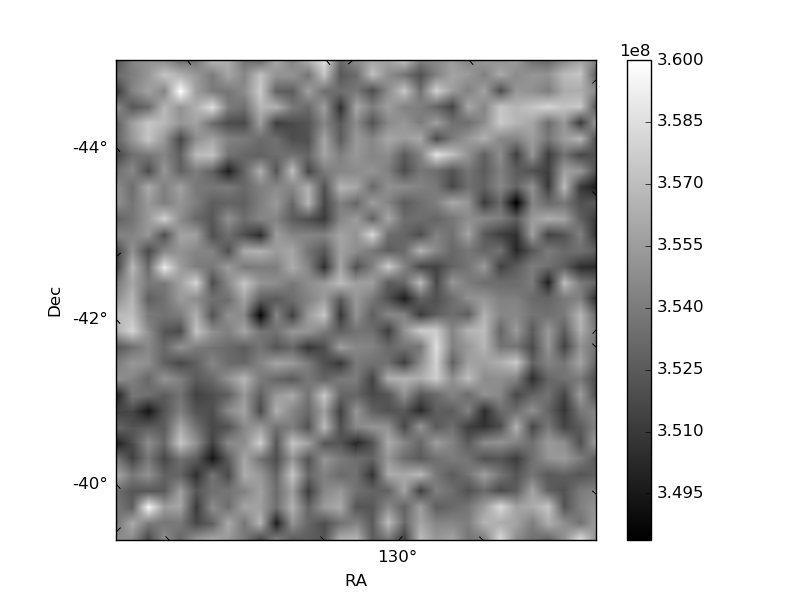
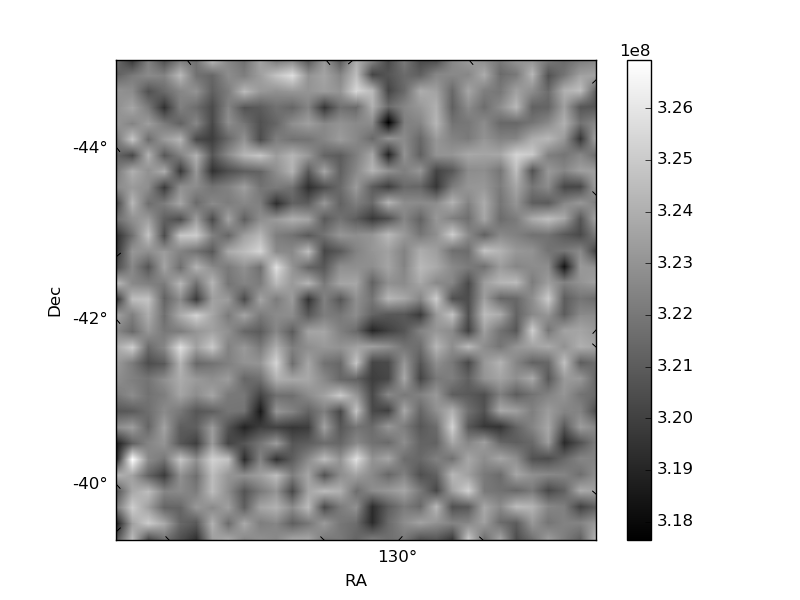
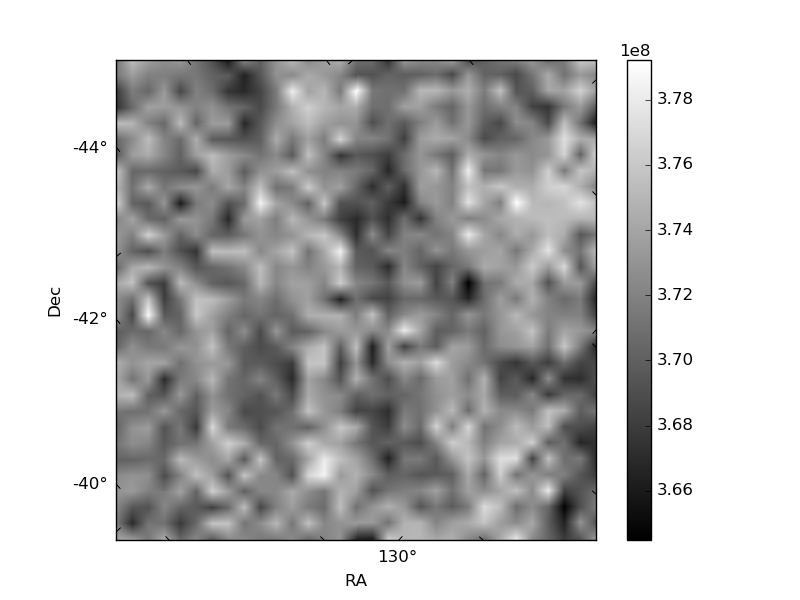
Histogram calculated using DETX and DETY for each event in the final _common_clean file
| Quadrant A | 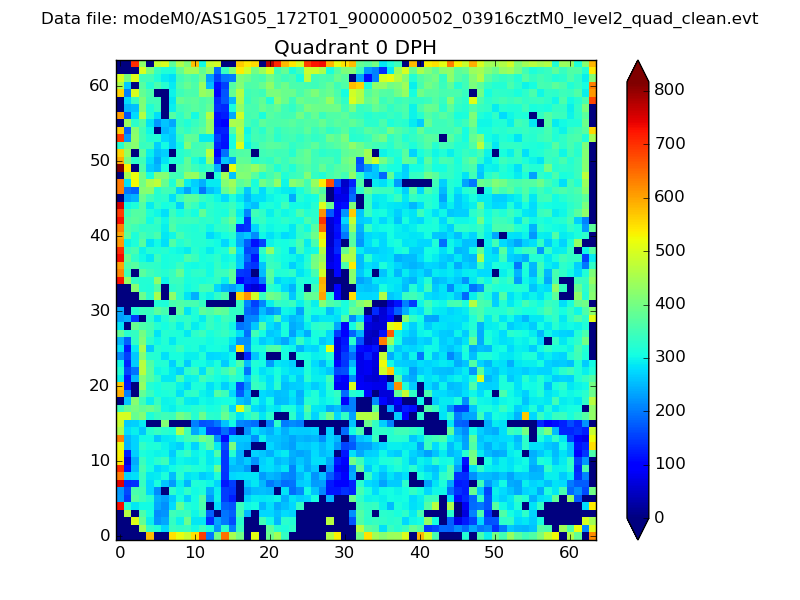 |
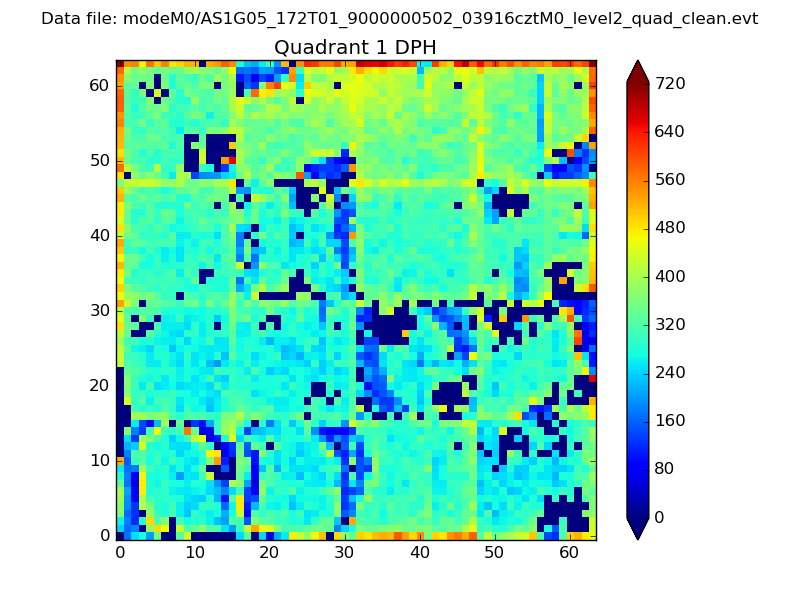 |
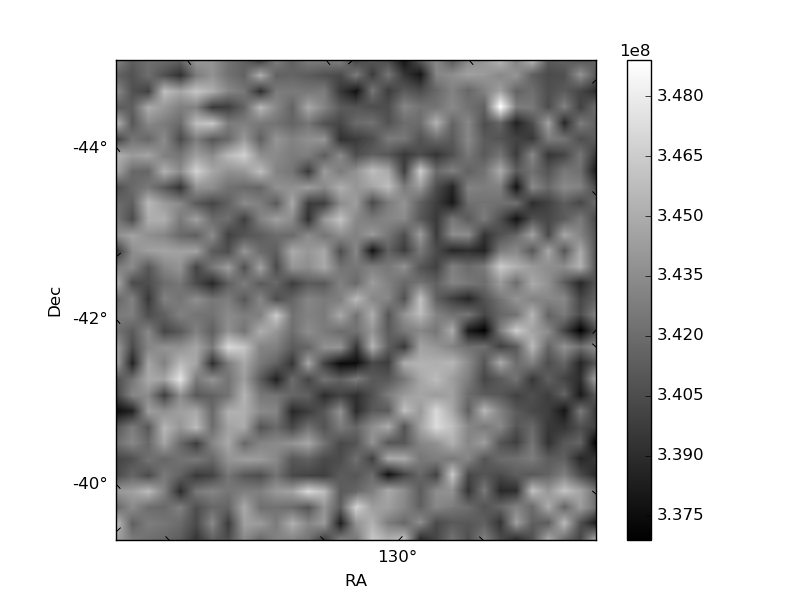
Quadrant B |
|---|---|---|---|
| Quadrant D | 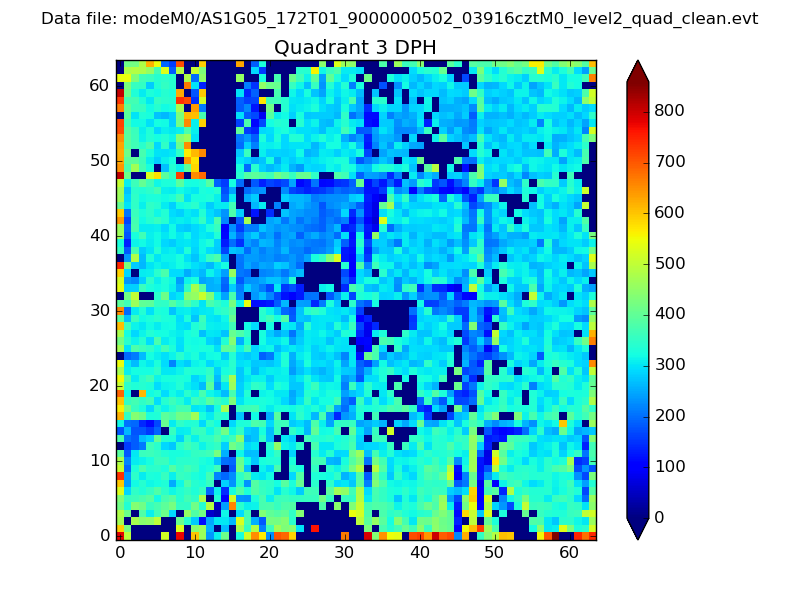 |
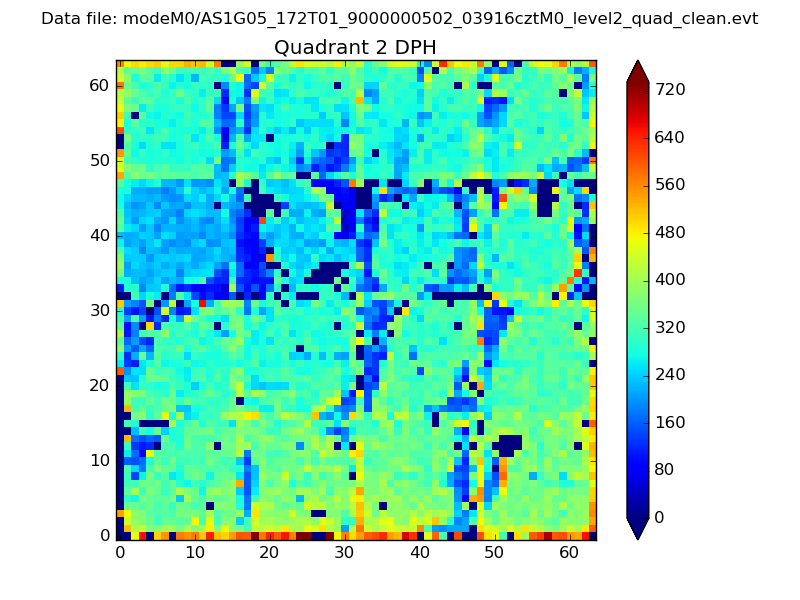 |
Quadrant C |
| Plot type | Count rate plots | Images |
|---|---|---|
| Comparison with Poisson distribution Blue bars denote a histogram of data divided into 1 sec bins. Red curve is a Poisson curve with rate = median count rate of data. |
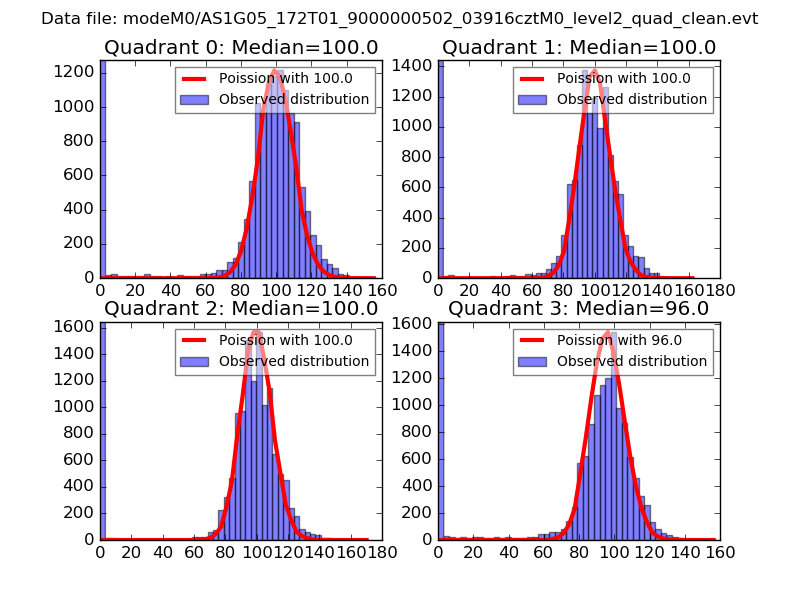 |
 |
| Quadrant-wise count rates Data is divided into 100 sec bins |
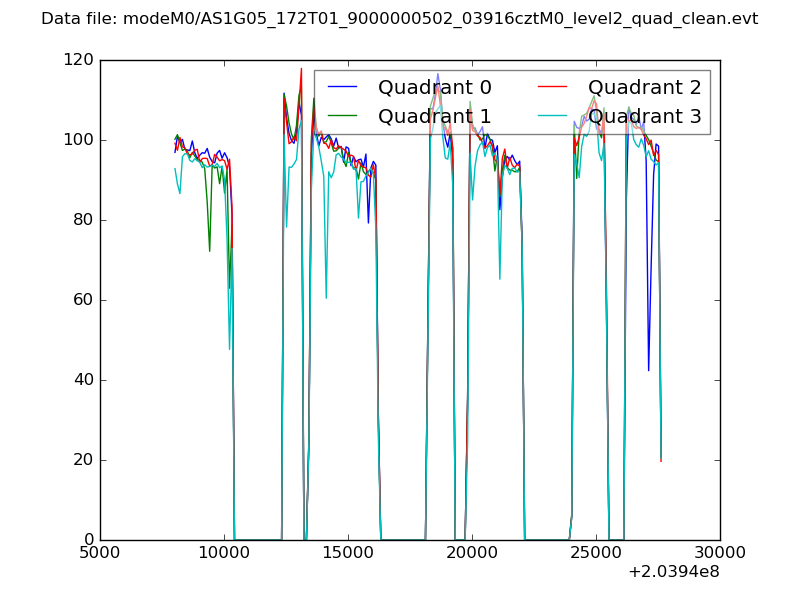 |
|
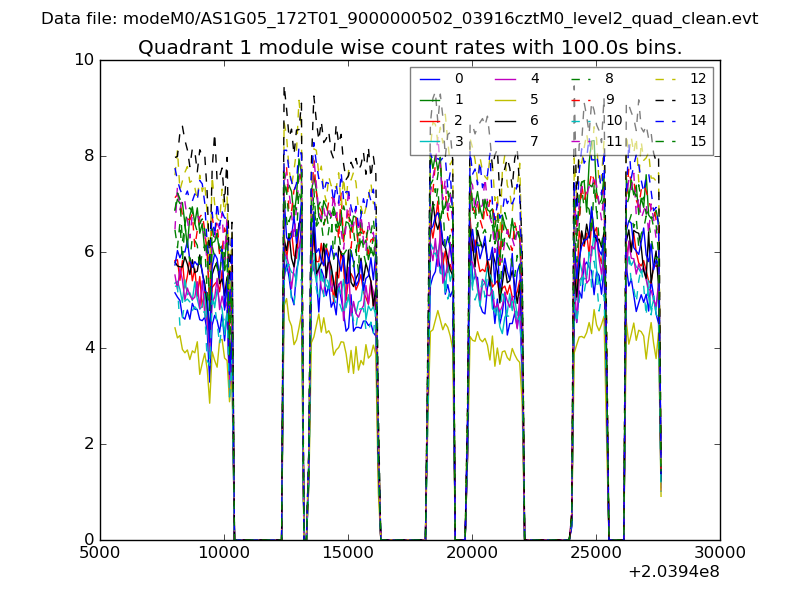
| Module-wise count rates for Quadrant A Data is divided into 100 sec bins |
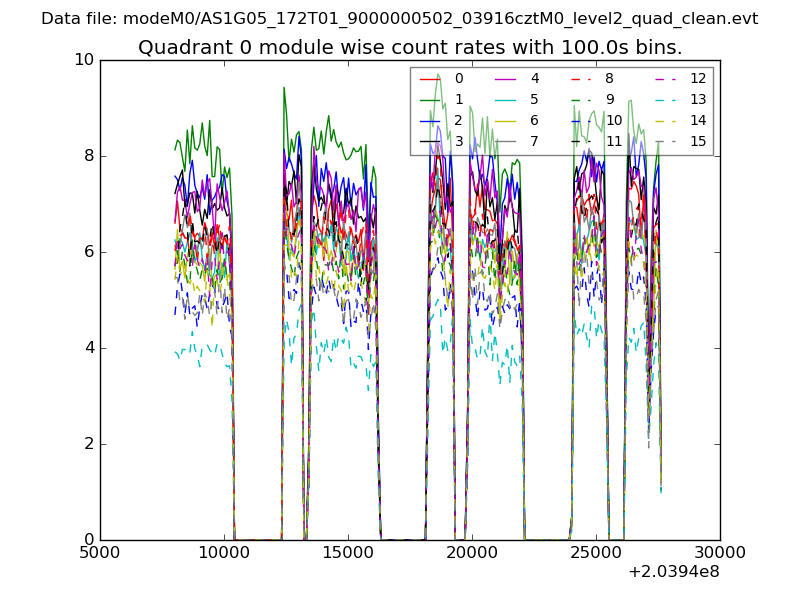 |
 |
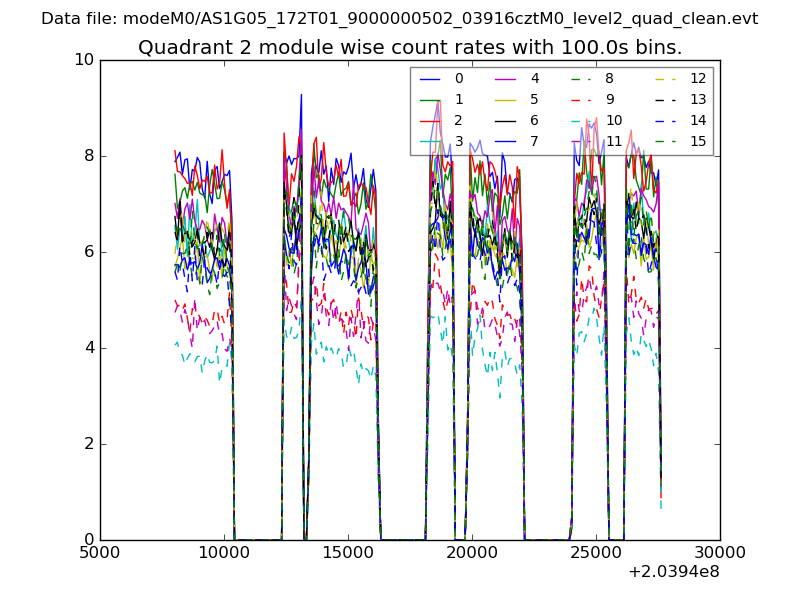
| Module-wise count rates for Quadrant B Data is divided into 100 sec bins |
 |
 |
| Module-wise count rates for Quadrant C Data is divided into 100 sec bins |
 |
 |
| Module-wise count rates for Quadrant D Data is divided into 100 sec bins |
 |
 |
| Parameter | Plot |
|---|---|
| CZT HV Monitor | 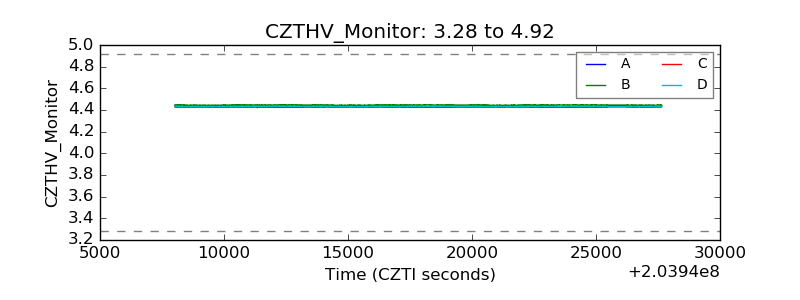 |
| D_VDD | 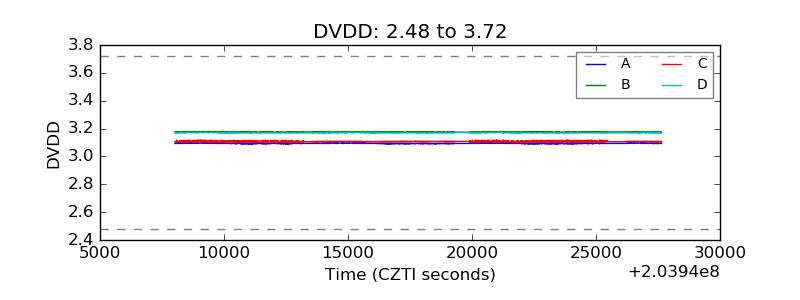 |
| Temperature 1 | 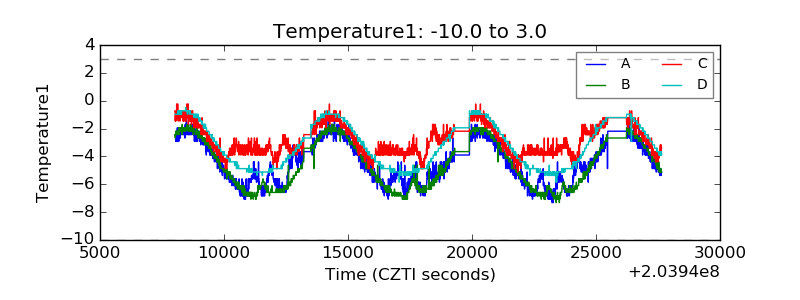 |
| Veto HV Monitor | 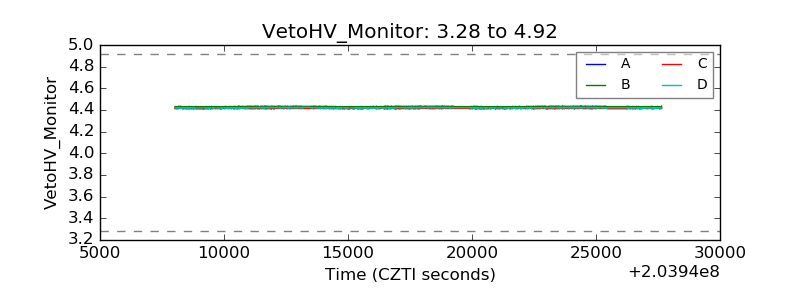 |
| Veto LLD | 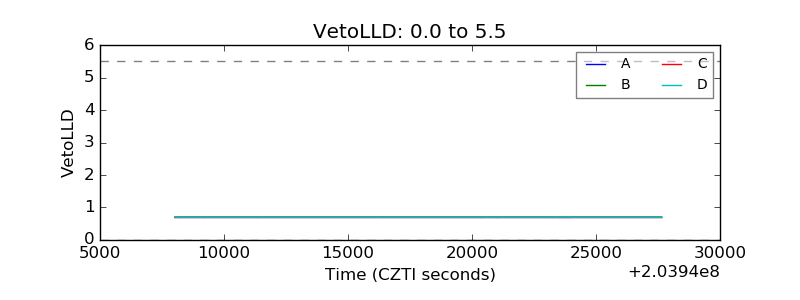 |
| Alpha Counter | 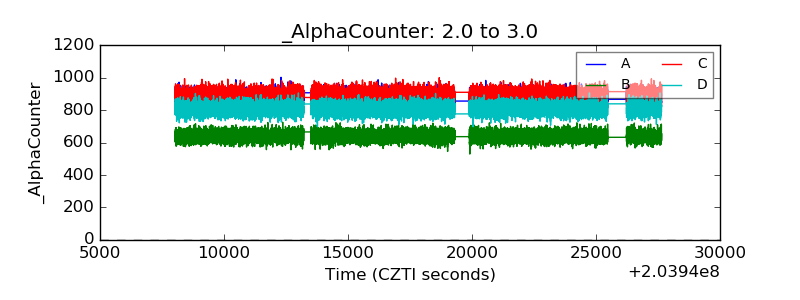 |
| _CPM_Rate | 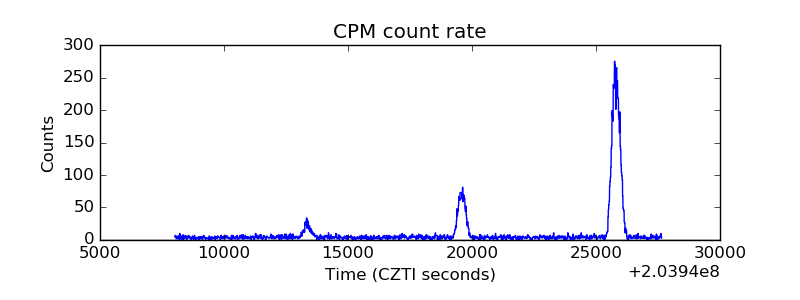 |
| CZT Counter | 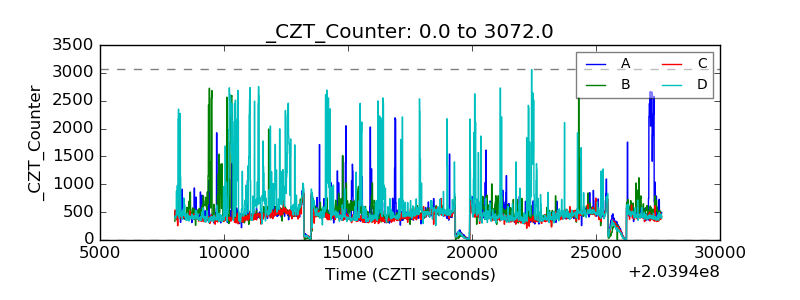 |
| +2.5 Volts monitor |  |
| +5 Volts monitor |  |
| Veto Counter | 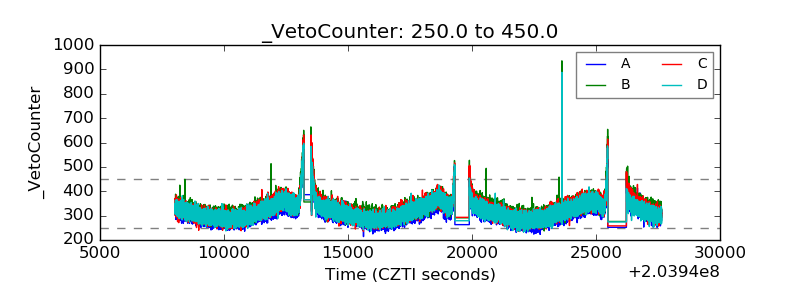 |