| Param | Original file | Final file |
|---|---|---|
| Filename | modeM0/AS1G05_172T01_9000000502_03917cztM0_level2.evt | modeM0/AS1G05_172T01_9000000502_03917cztM0_level2_quad_clean.evt |
| Size (bytes) | 498,631,680 | 77,590,080 |
| Size | 475.5 MB | 74.0 MB |
| Events in quadrant A | 4,042,136 | 465,235 |
| Events in quadrant B | 3,804,030 | 477,788 |
| Events in quadrant C | 2,849,769 | 476,318 |
| Events in quadrant D | 3,944,528 | 457,272 |
| Mode SS | |||
|---|---|---|---|
| Quadrant | BADHDUFLAG | Total packets | Discarded packets |
| A | 0 | 136 | 0 |
| B | 0 | 136 | 0 |
| C | 0 | 136 | 0 |
| D | 0 | 136 | 0 |
| Mode M9 | |||
|---|---|---|---|
| Quadrant | BADHDUFLAG | Total packets | Discarded packets |
| A | 0 | 12 | 0 |
| B | 0 | 12 | 0 |
| C | 0 | 12 | 0 |
| D | 0 | 13 | 0 |
| Mode M0 | |||
|---|---|---|---|
| Quadrant | BADHDUFLAG | Total packets | Discarded packets |
| A | 0 | 16575 | 3 |
| B | 0 | 16013 | 2 |
| C | 0 | 13656 | 2 |
| D | 0 | 16577 | 2 |
| Quadrant | Total seconds | Saturated seconds | Saturation percentage |
|---|---|---|---|
| A | 6789 | 319 | 4.698777% |
| B | 6789 | 41 | 0.603918% |
| C | 6789 | 7 | 0.103108% |
| D | 6789 | 139 | 2.047430% |
Noise dominated data is calculated using 1-second bins in cleaned event files. If a bin has >2000 counts, and if more than 50% of those come from <1% of pixels, then it is considered to be noise-dominated and hence unusable.
| Quadrant | # 1 sec bins | Bins with >0 counts | Bins with >2000 counts | High rate bins dominated by noise | Noise dominated (total time) | Noise dominated (detector-on time) | Marked lightcurve |
|---|---|---|---|---|---|---|---|
| A | 7739 | 6790 | 269 | 269 | 3.48% | 3.96% |  |
| B | 7739 | 6790 | 9 | 9 | 0.12% | 0.13% |  |
| C | 7739 | 6790 | 1 | 1 | 0.01% | 0.01% |  |
| D | 7739 | 6790 | 123 | 123 | 1.59% | 1.81% |  |
Top three noisy pixels from each quadrant. If the there are fewer than three noisy pixels in the level2.evt file, extra rows are filled as -1
| Pixel properties | Quadrant properties | ||||||
|---|---|---|---|---|---|---|---|
| Quadrant | DetID | PixID | Counts | Sigma | Mean | Median | Sigma |
| A | 0 | 50 | 739572 | 4813.97 | 741 | 723 | 153.5 |
| A | 8 | 15 | 183258 | 1189.31 | 741 | 723 | 153.5 |
| A | 0 | 118 | 110972 | 718.33 | 741 | 723 | 153.5 |
| B | 15 | 204 | 693187 | 4621.56 | 764 | 744 | 149.8 |
| B | 7 | 221 | 89627 | 593.23 | 764 | 744 | 149.8 |
| B | 14 | 167 | 21717 | 139.98 | 764 | 744 | 149.8 |
| C | 1 | 16 | 12794 | 71.03 | 724 | 726 | 169.9 |
| C | 13 | 61 | 6130 | 31.81 | 724 | 726 | 169.9 |
| C | 14 | 67 | 5855 | 30.19 | 724 | 726 | 169.9 |
| D | 2 | 63 | 470237 | 2686.92 | 716 | 694 | 174.8 |
| D | 2 | 232 | 390898 | 2232.91 | 716 | 694 | 174.8 |
| D | 9 | 82 | 113297 | 644.36 | 716 | 694 | 174.8 |
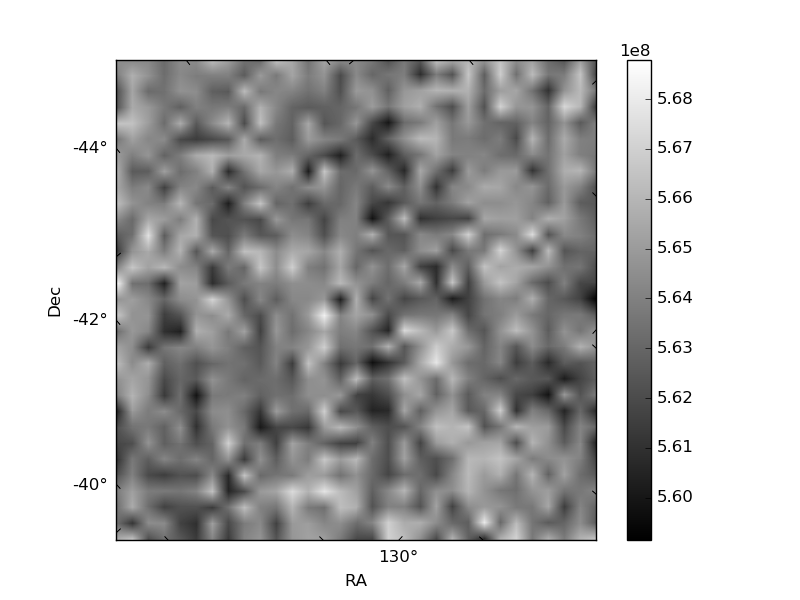
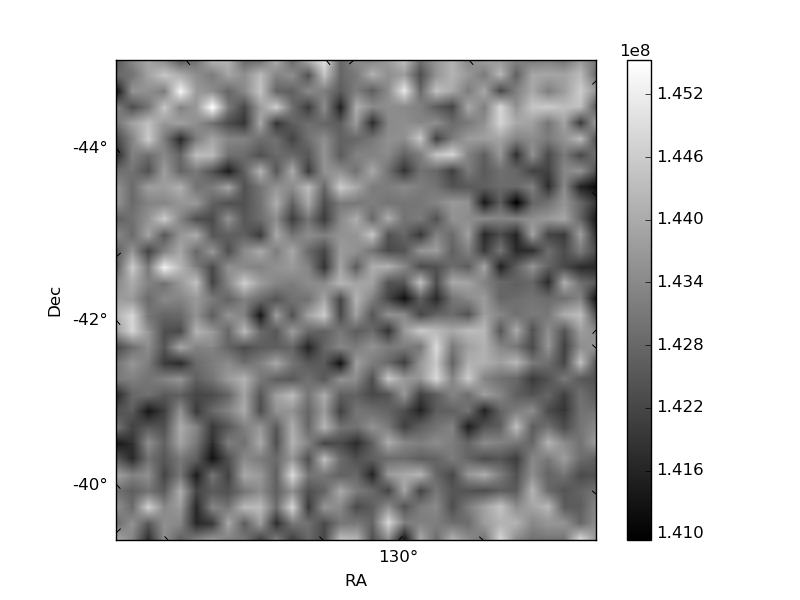
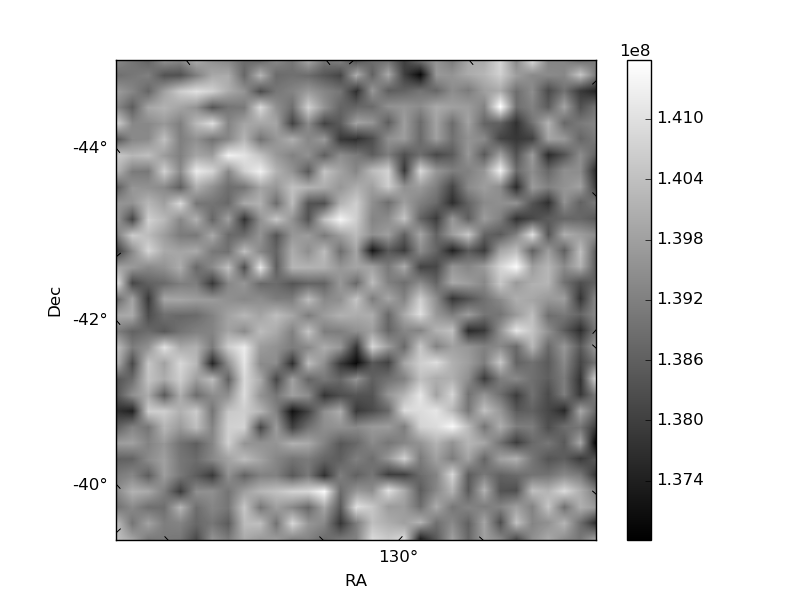
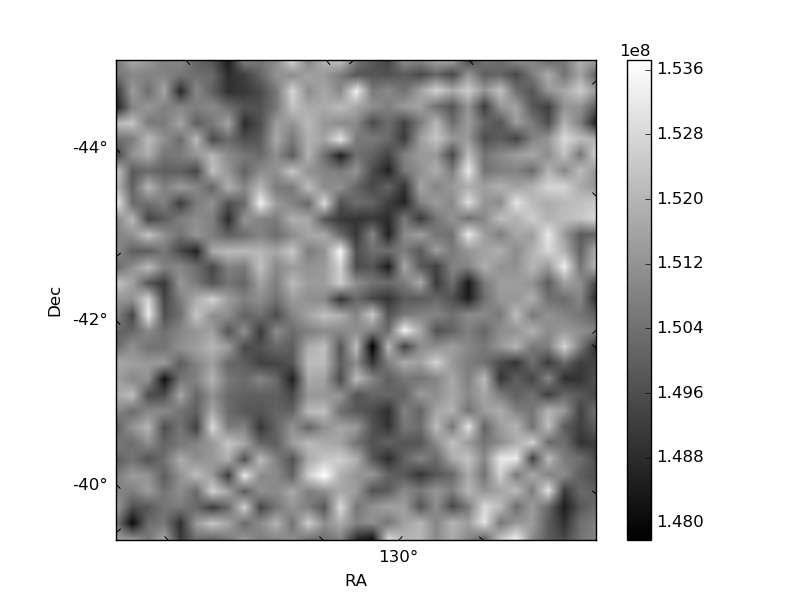
Histogram calculated using DETX and DETY for each event in the final _common_clean file
| Quadrant A | 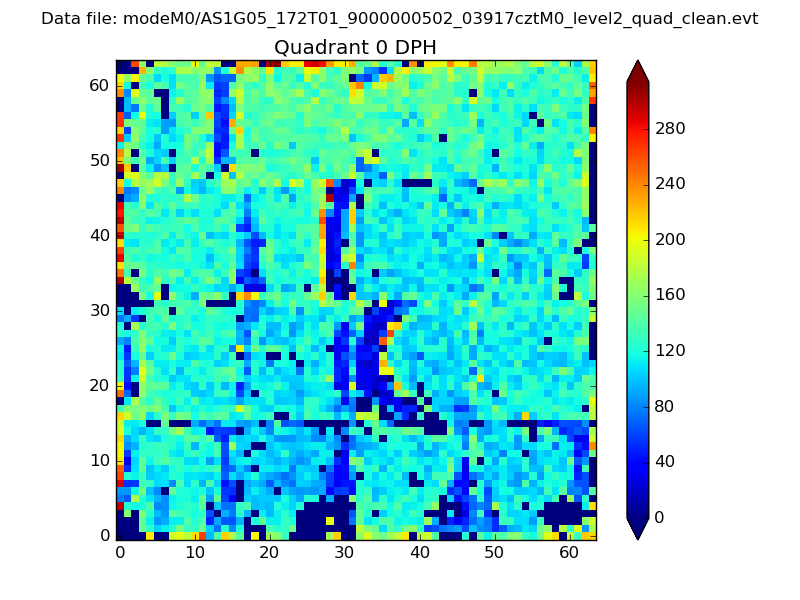 |
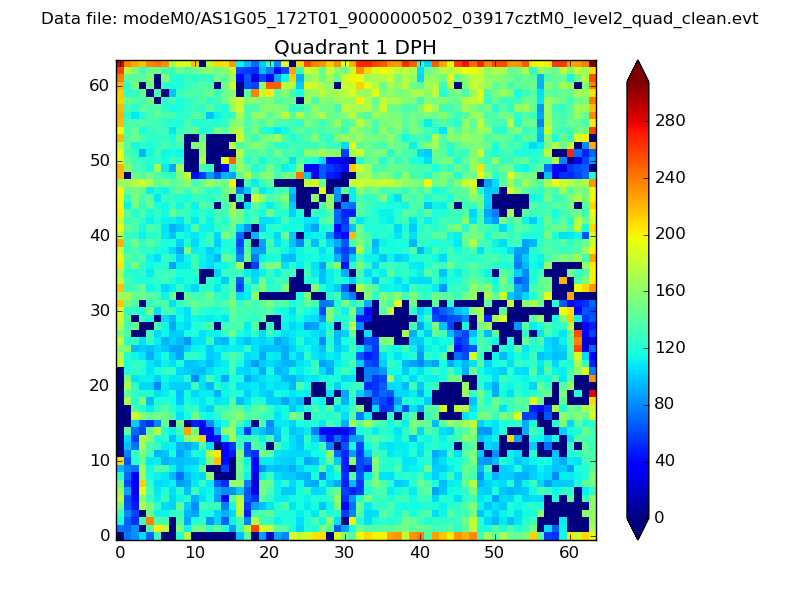 |
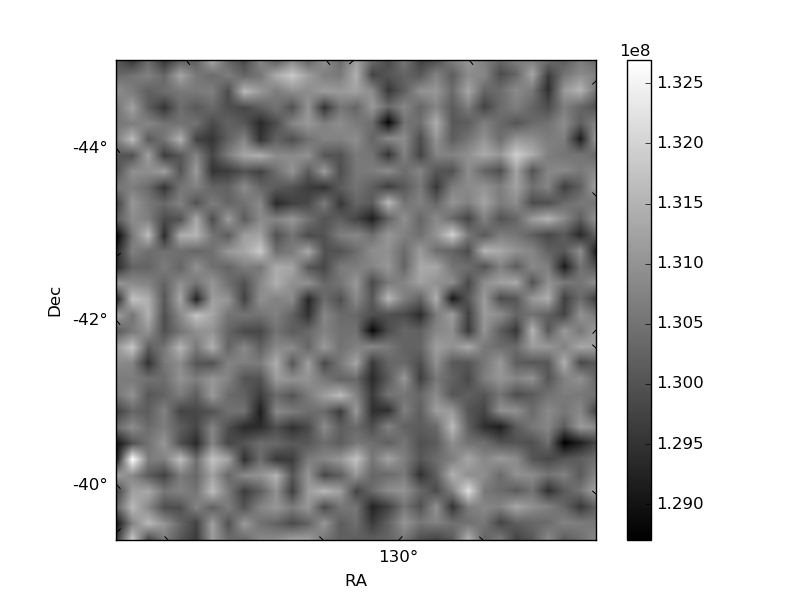
Quadrant B |
|---|---|---|---|
| Quadrant D |  |
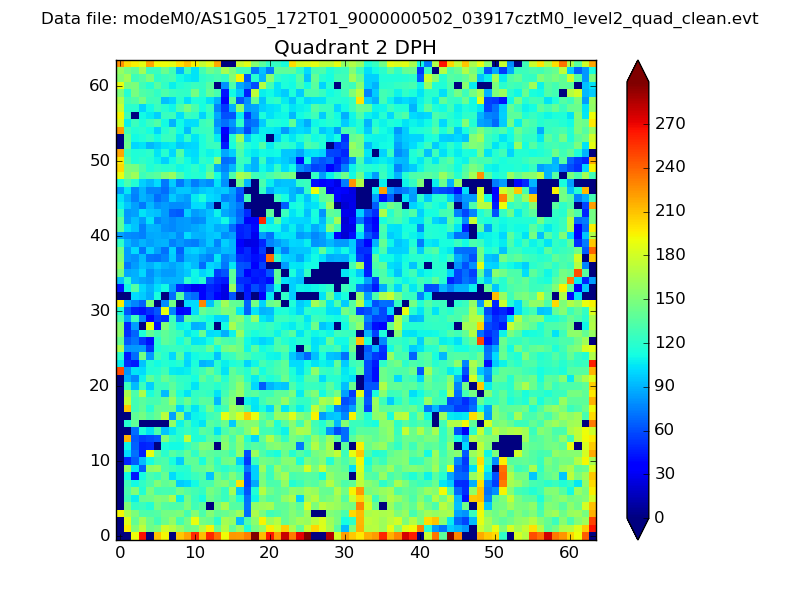 |
Quadrant C |
| Plot type | Count rate plots | Images |
|---|---|---|
| Comparison with Poisson distribution Blue bars denote a histogram of data divided into 1 sec bins. Red curve is a Poisson curve with rate = median count rate of data. |
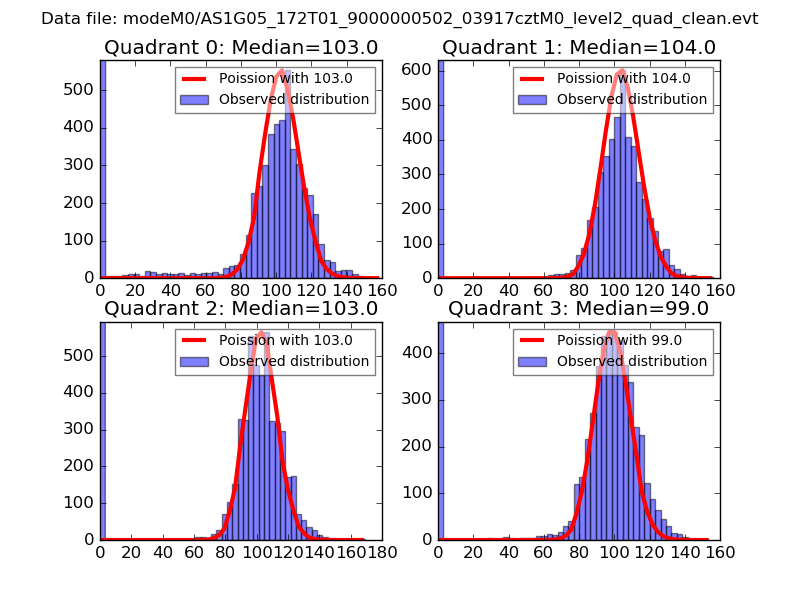 |
 |
| Quadrant-wise count rates Data is divided into 100 sec bins |
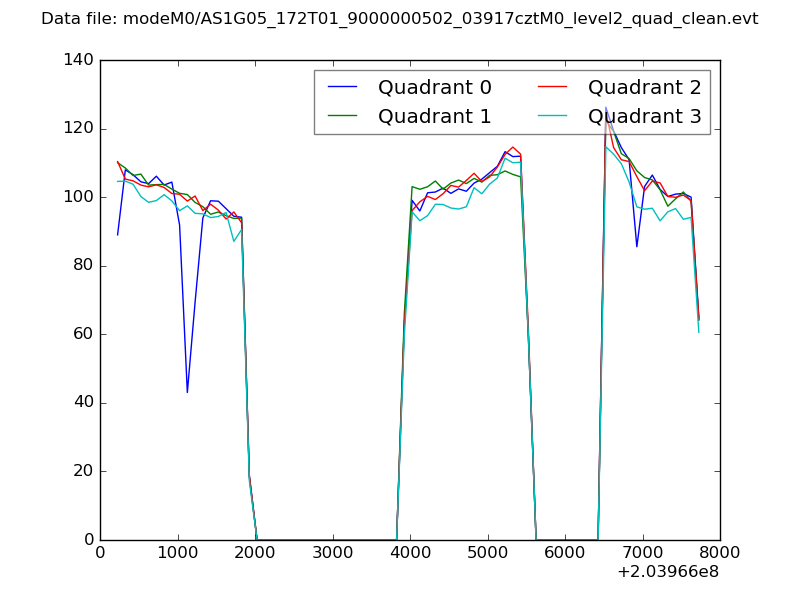 |
|
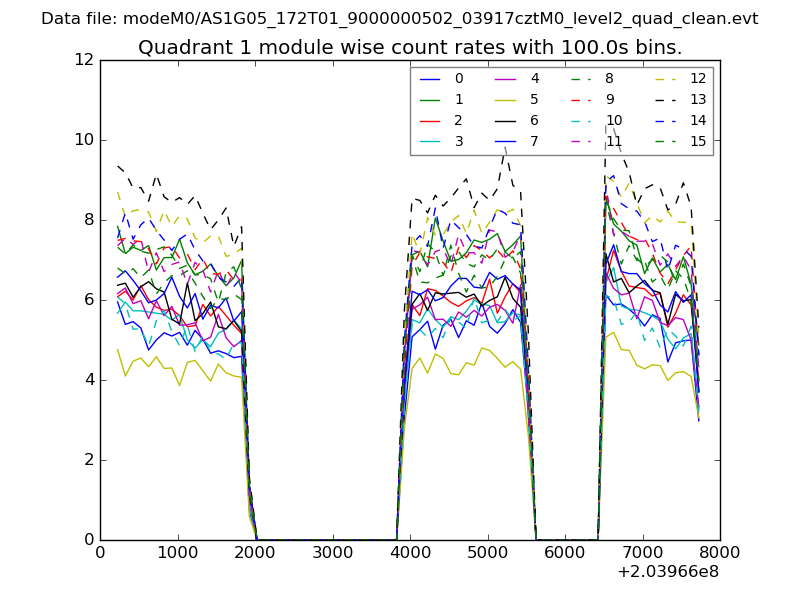
| Module-wise count rates for Quadrant A Data is divided into 100 sec bins |
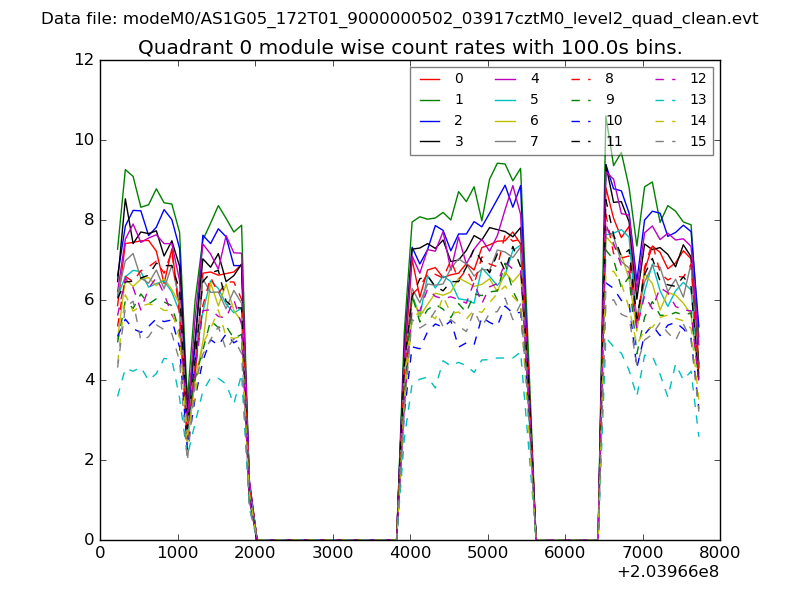 |
 |
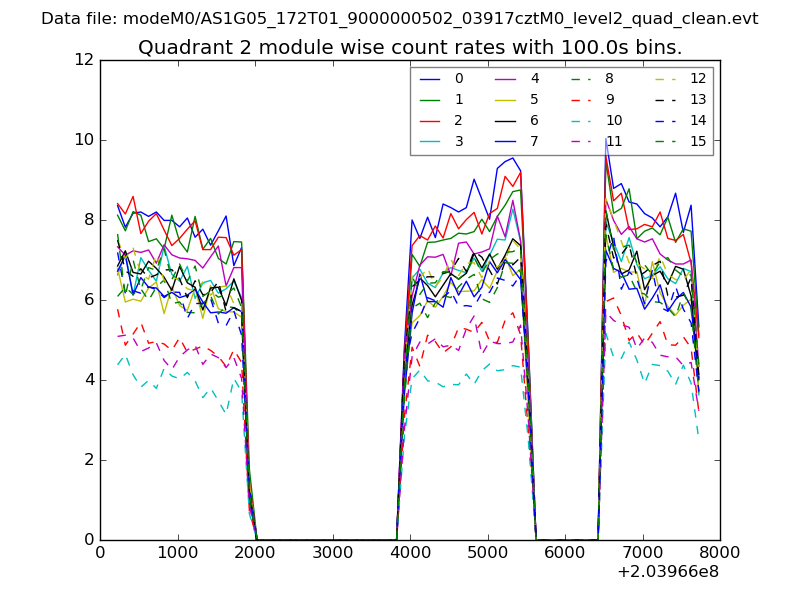
| Module-wise count rates for Quadrant B Data is divided into 100 sec bins |
 |
 |
| Module-wise count rates for Quadrant C Data is divided into 100 sec bins |
 |
 |
| Module-wise count rates for Quadrant D Data is divided into 100 sec bins |
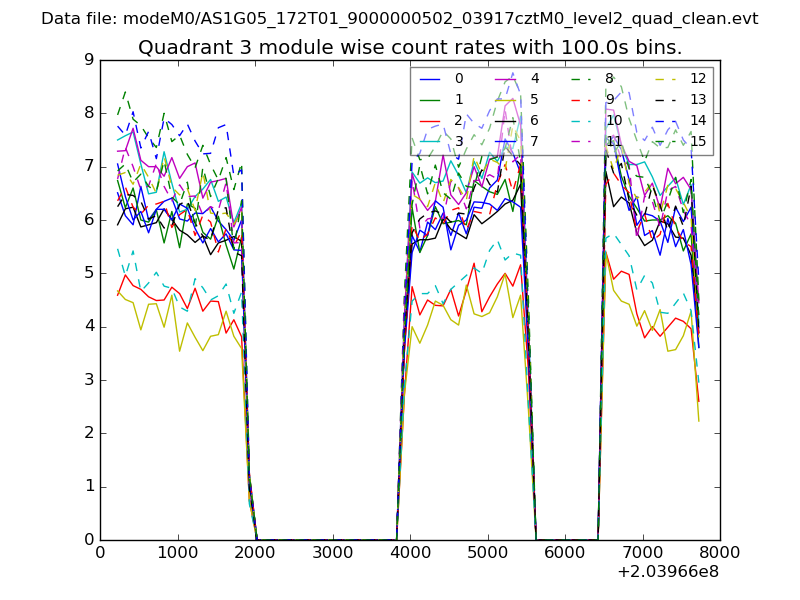 |
 |
| Parameter | Plot |
|---|---|
| CZT HV Monitor | 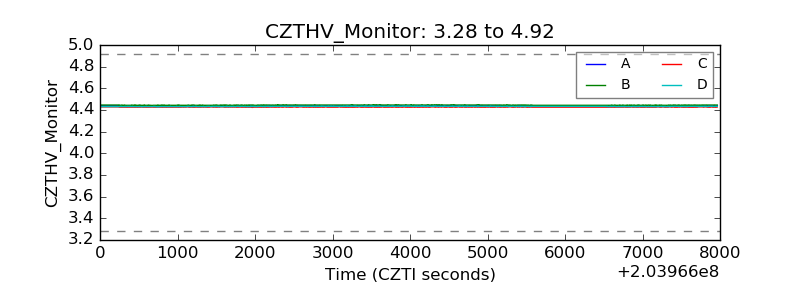 |
| D_VDD | 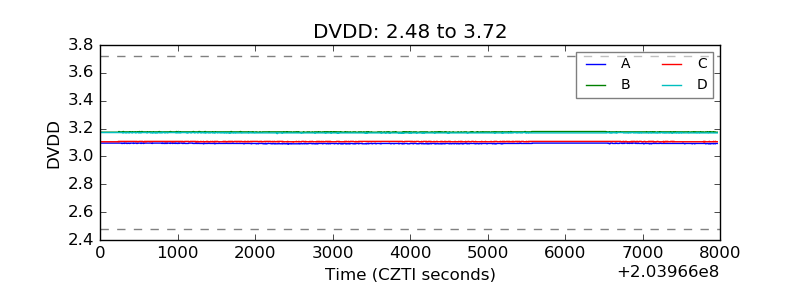 |
| Temperature 1 |  |
| Veto HV Monitor | 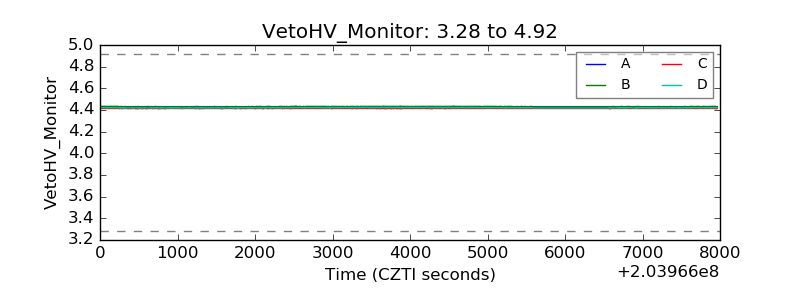 |
| Veto LLD |  |
| Alpha Counter | 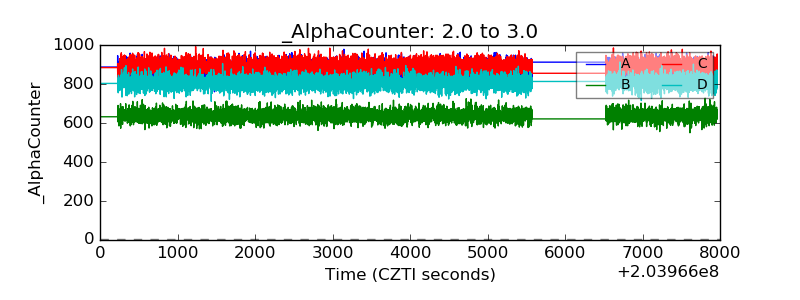 |
| _CPM_Rate | 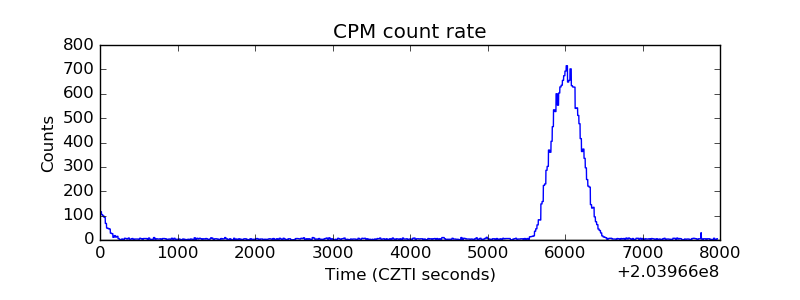 |
| CZT Counter | 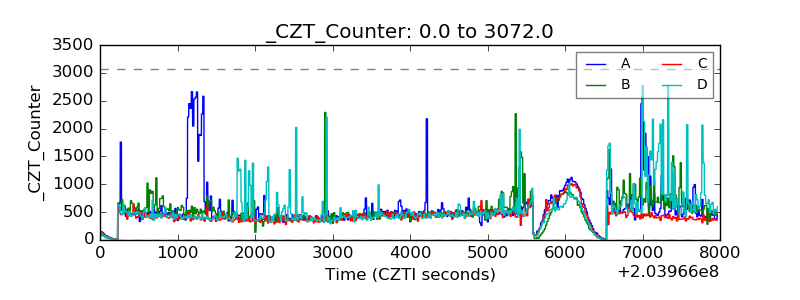 |
| +2.5 Volts monitor |  |
| +5 Volts monitor |  |
| Veto Counter | 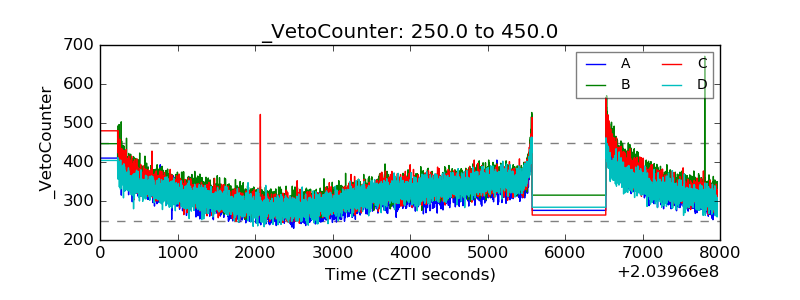 |