| Param | Original file | Final file |
|---|---|---|
| Filename | modeM0/AS1G05_172T01_9000000502_03919cztM0_level2.evt | modeM0/AS1G05_172T01_9000000502_03919cztM0_level2_quad_clean.evt |
| Size (bytes) | 498,548,160 | 71,611,200 |
| Size | 475.5 MB | 68.3 MB |
| Events in quadrant A | 3,883,715 | 432,054 |
| Events in quadrant B | 3,684,549 | 435,816 |
| Events in quadrant C | 2,791,754 | 430,628 |
| Events in quadrant D | 4,294,234 | 412,904 |
| Mode SS | |||
|---|---|---|---|
| Quadrant | BADHDUFLAG | Total packets | Discarded packets |
| A | 0 | 132 | 0 |
| B | 0 | 132 | 0 |
| C | 0 | 132 | 0 |
| D | 0 | 132 | 0 |
| Mode M9 | |||
|---|---|---|---|
| Quadrant | BADHDUFLAG | Total packets | Discarded packets |
| A | 0 | 16 | 0 |
| B | 0 | 16 | 0 |
| C | 0 | 16 | 0 |
| D | 0 | 17 | 0 |
| Mode M0 | |||
|---|---|---|---|
| Quadrant | BADHDUFLAG | Total packets | Discarded packets |
| A | 0 | 15784 | 3 |
| B | 0 | 15124 | 2 |
| C | 0 | 13250 | 2 |
| D | 0 | 17261 | 2 |
| Quadrant | Total seconds | Saturated seconds | Saturation percentage |
|---|---|---|---|
| A | 6554 | 102 | 1.556301% |
| B | 6554 | 25 | 0.381446% |
| C | 6554 | 5 | 0.076289% |
| D | 6554 | 146 | 2.227647% |
Noise dominated data is calculated using 1-second bins in cleaned event files. If a bin has >2000 counts, and if more than 50% of those come from <1% of pixels, then it is considered to be noise-dominated and hence unusable.
| Quadrant | # 1 sec bins | Bins with >0 counts | Bins with >2000 counts | High rate bins dominated by noise | Noise dominated (total time) | Noise dominated (detector-on time) | Marked lightcurve |
|---|---|---|---|---|---|---|---|
| A | 7654 | 6555 | 80 | 80 | 1.05% | 1.22% | 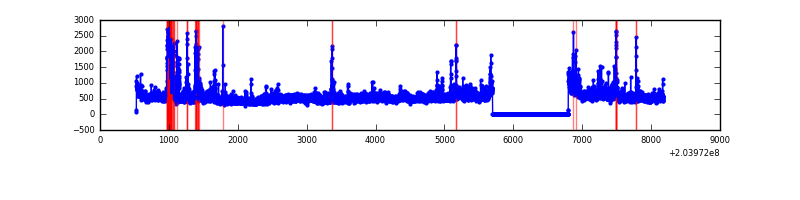 |
| B | 7654 | 6555 | 4 | 4 | 0.05% | 0.06% |  |
| C | 7654 | 6555 | 0 | 0 | 0.00% | 0.00% | 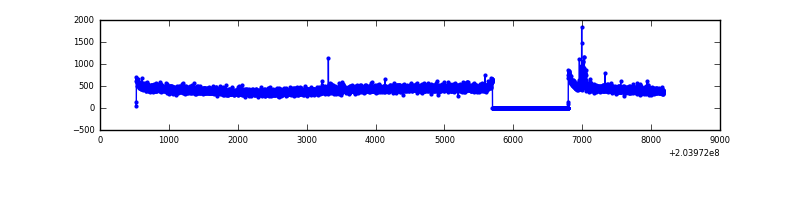 |
| D | 7654 | 6555 | 141 | 141 | 1.84% | 2.15% |  |
Top three noisy pixels from each quadrant. If the there are fewer than three noisy pixels in the level2.evt file, extra rows are filled as -1
| Pixel properties | Quadrant properties | ||||||
|---|---|---|---|---|---|---|---|
| Quadrant | DetID | PixID | Counts | Sigma | Mean | Median | Sigma |
| A | 8 | 15 | 604326 | 3997.32 | 736 | 722 | 151.0 |
| A | 0 | 50 | 255380 | 1686.45 | 736 | 722 | 151.0 |
| A | 0 | 118 | 133093 | 876.62 | 736 | 722 | 151.0 |
| B | 15 | 204 | 717603 | 4956.31 | 749 | 732 | 144.6 |
| B | 0 | 229 | 16781 | 110.96 | 749 | 732 | 144.6 |
| B | 14 | 167 | 16317 | 107.75 | 749 | 732 | 144.6 |
| C | 10 | 65 | 17086 | 98.84 | 708 | 710 | 165.7 |
| C | 1 | 16 | 6169 | 32.95 | 708 | 710 | 165.7 |
| C | 13 | 61 | 5997 | 31.91 | 708 | 710 | 165.7 |
| D | 2 | 63 | 934438 | 5498.17 | 698 | 677 | 169.8 |
| D | 2 | 232 | 369965 | 2174.44 | 698 | 677 | 169.8 |
| D | 9 | 82 | 112021 | 655.62 | 698 | 677 | 169.8 |
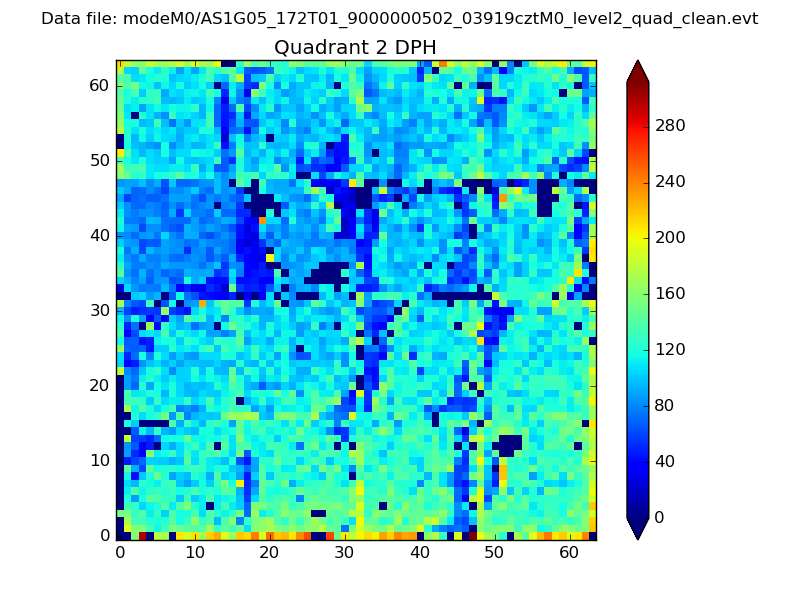
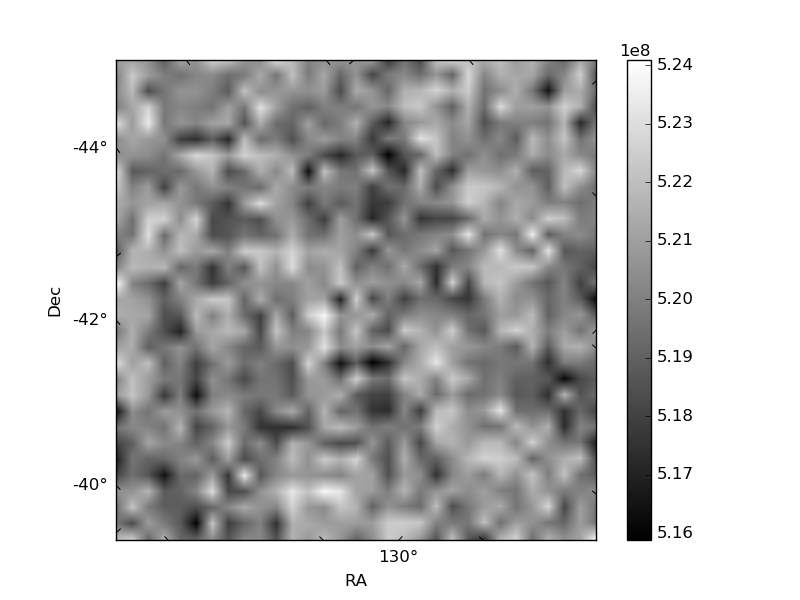
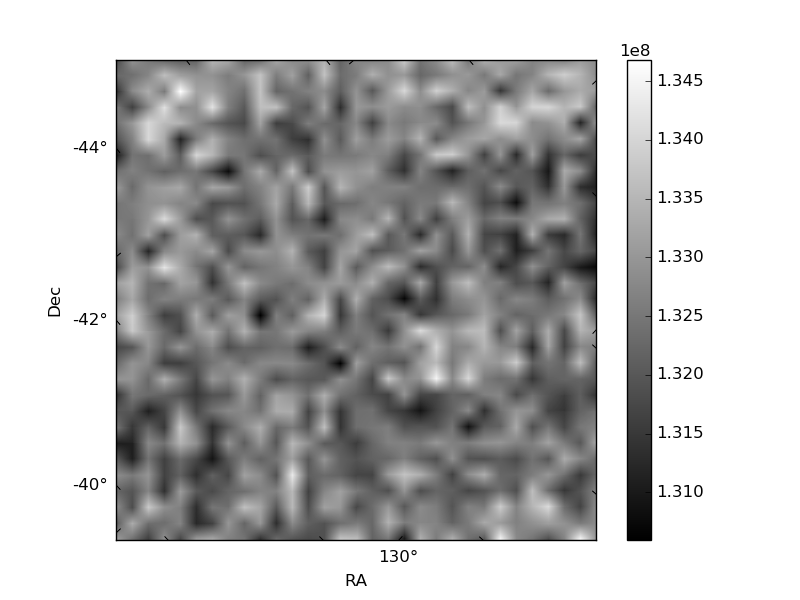
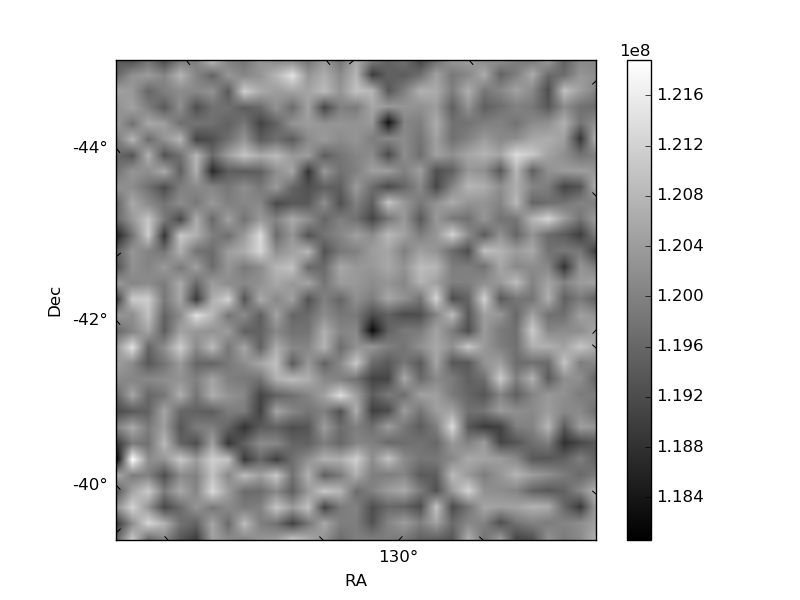
Histogram calculated using DETX and DETY for each event in the final _common_clean file
| Quadrant A | 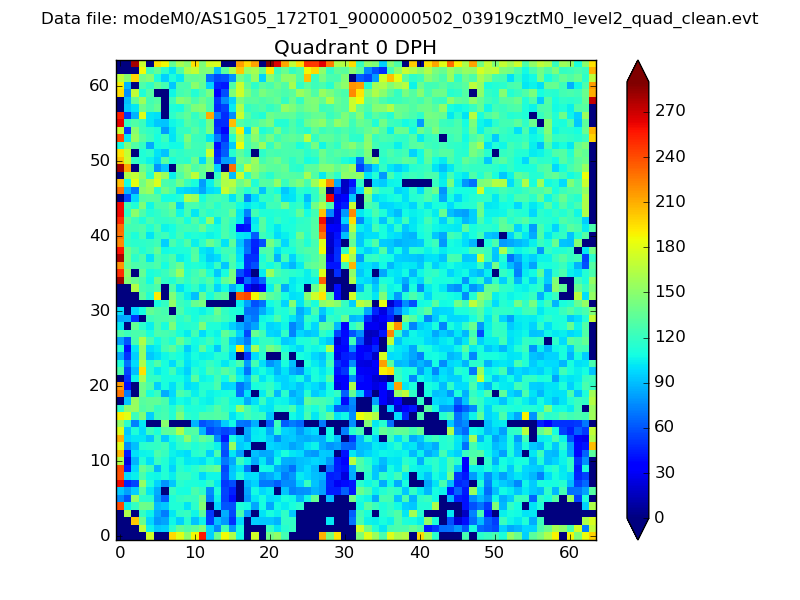 |
 |
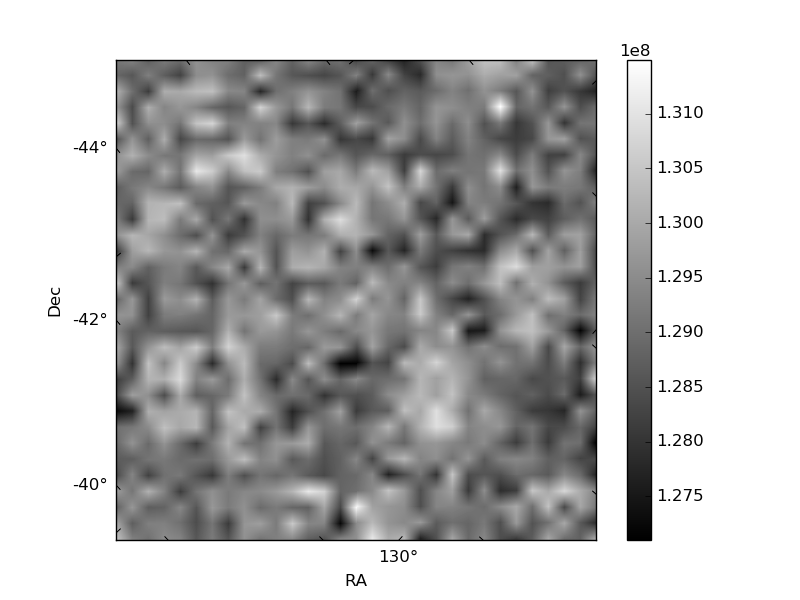
Quadrant B |
|---|---|---|---|
| Quadrant D |  |
 |
Quadrant C |
| Plot type | Count rate plots | Images |
|---|---|---|
| Comparison with Poisson distribution Blue bars denote a histogram of data divided into 1 sec bins. Red curve is a Poisson curve with rate = median count rate of data. |
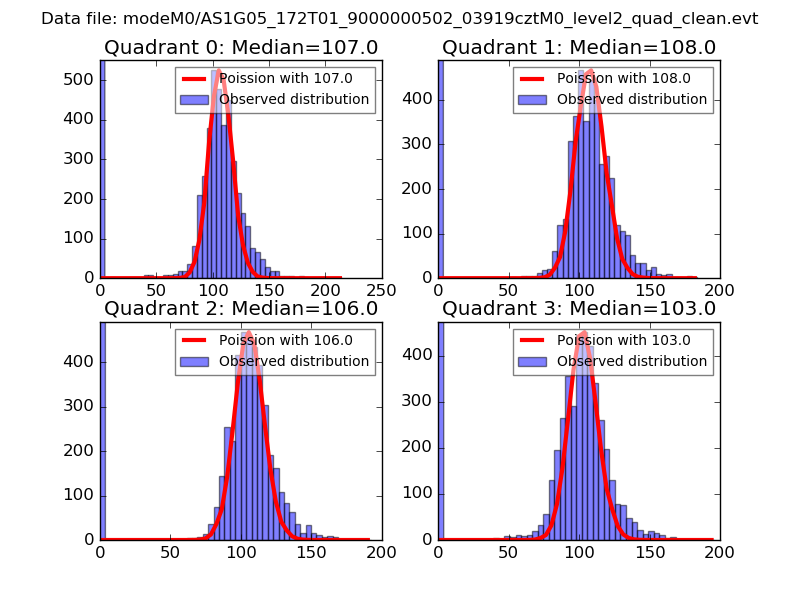 |
 |
| Quadrant-wise count rates Data is divided into 100 sec bins |
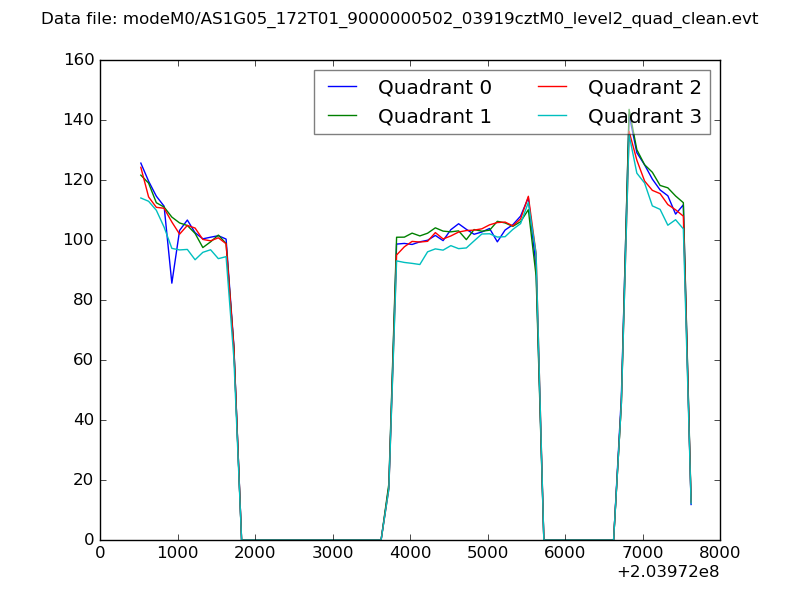 |
|
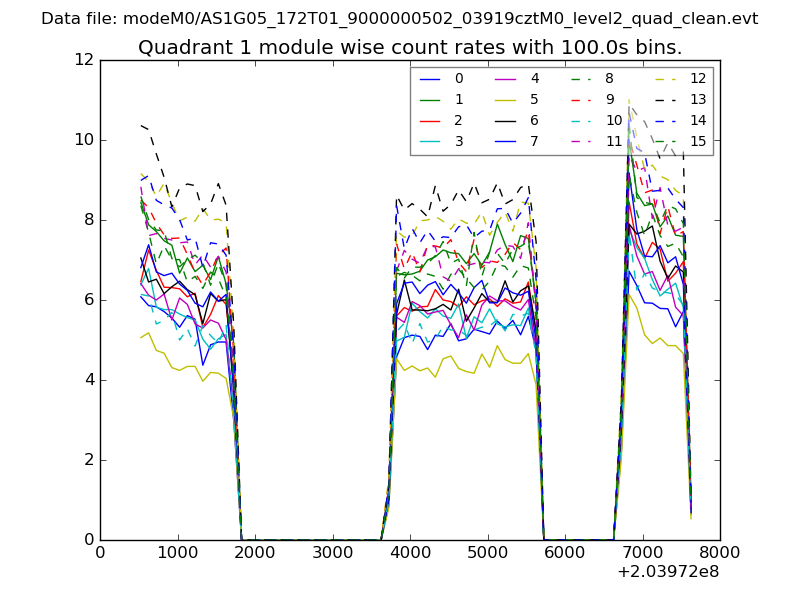
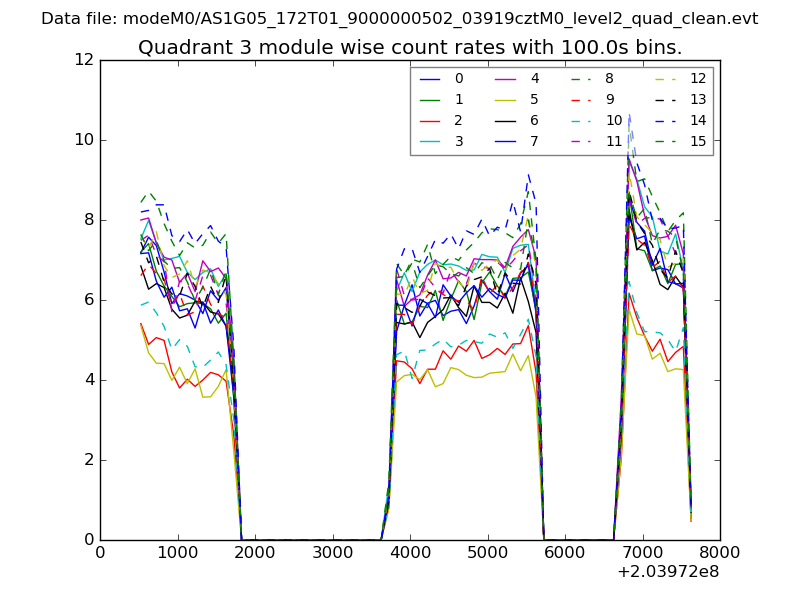
| Module-wise count rates for Quadrant A Data is divided into 100 sec bins |
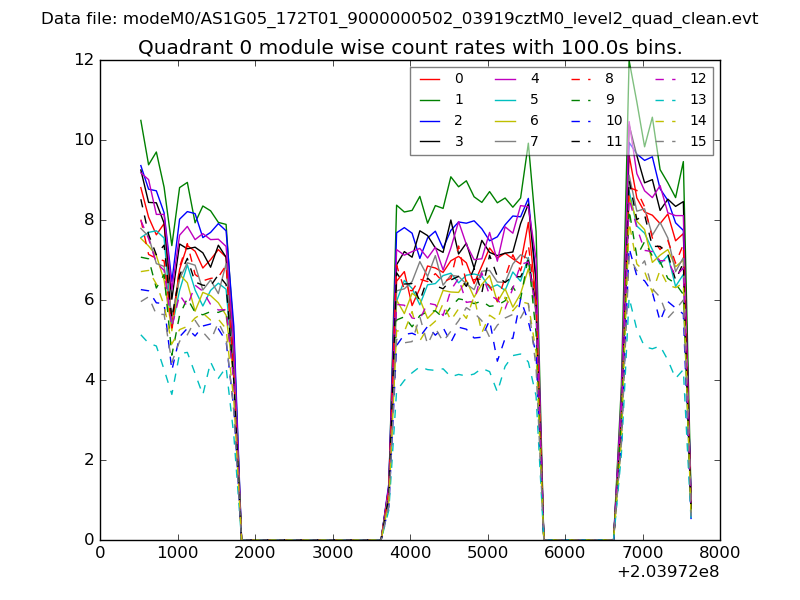 |
 |
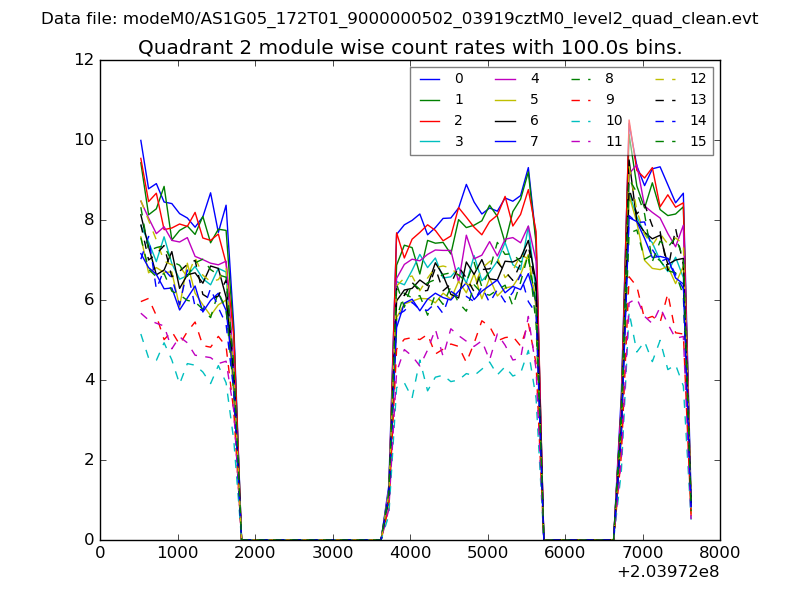
| Module-wise count rates for Quadrant B Data is divided into 100 sec bins |
 |
 |
| Module-wise count rates for Quadrant C Data is divided into 100 sec bins |
 |
 |
| Module-wise count rates for Quadrant D Data is divided into 100 sec bins |
 |
 |
| Parameter | Plot |
|---|---|
| CZT HV Monitor | 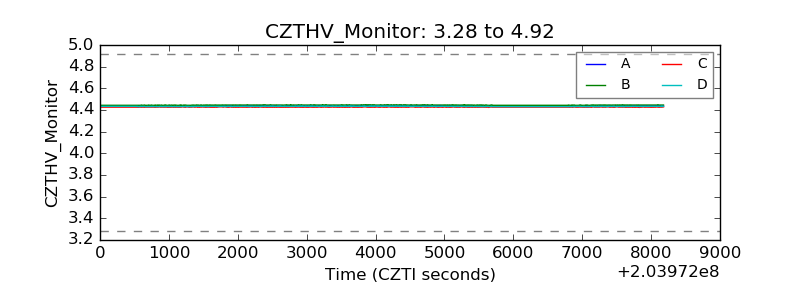 |
| D_VDD | 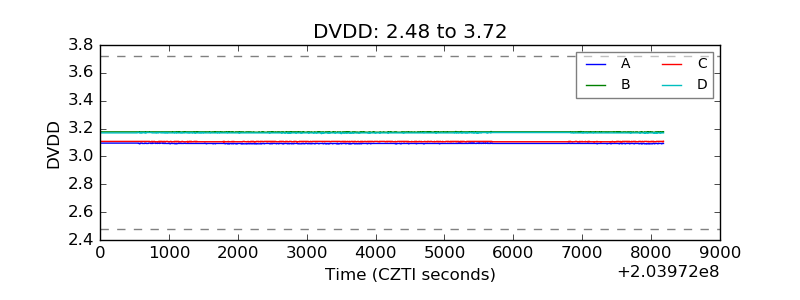 |
| Temperature 1 |  |
| Veto HV Monitor | 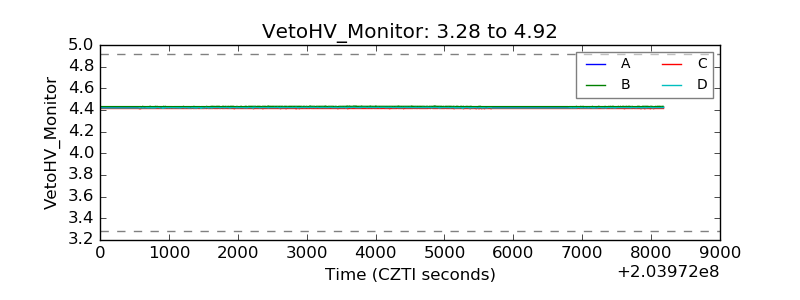 |
| Veto LLD | 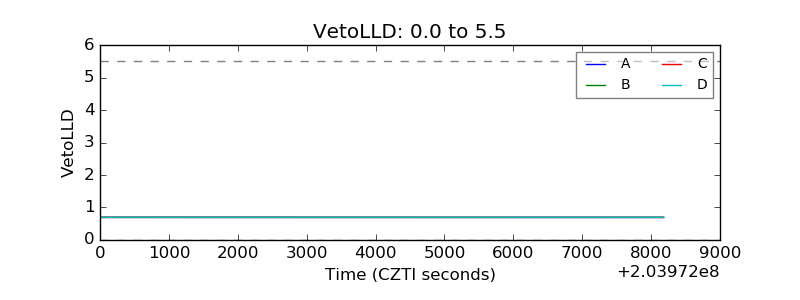 |
| Alpha Counter | 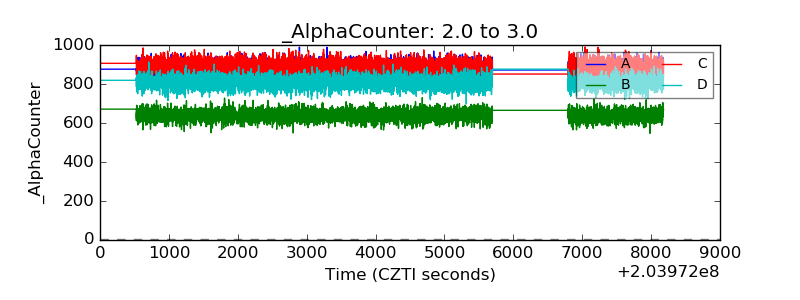 |
| _CPM_Rate | 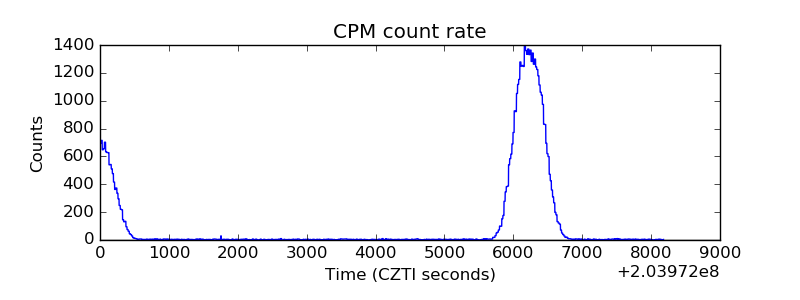 |
| CZT Counter | 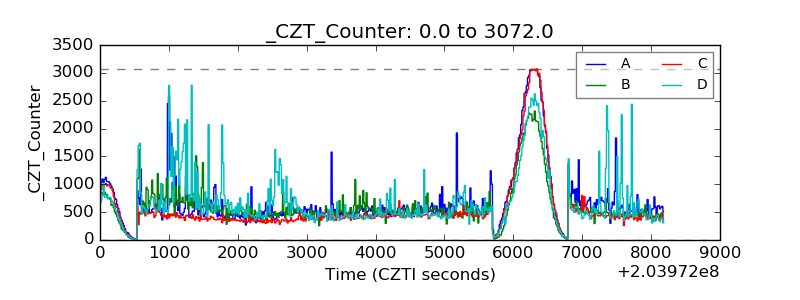 |
| +2.5 Volts monitor |  |
| +5 Volts monitor |  |
| Veto Counter | 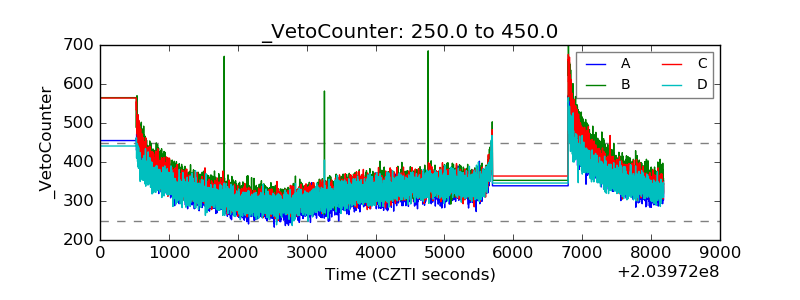 |