| Param | Original file | Final file |
|---|---|---|
| Filename | modeM0/AS1G05_172T01_9000000502_03920cztM0_level2.evt | modeM0/AS1G05_172T01_9000000502_03920cztM0_level2_quad_clean.evt |
| Size (bytes) | 450,875,520 | 65,122,560 |
| Size | 430.0 MB | 62.1 MB |
| Events in quadrant A | 3,795,663 | 386,022 |
| Events in quadrant B | 3,071,249 | 393,812 |
| Events in quadrant C | 2,790,076 | 385,296 |
| Events in quadrant D | 3,568,113 | 365,151 |
| Mode SS | |||
|---|---|---|---|
| Quadrant | BADHDUFLAG | Total packets | Discarded packets |
| A | 0 | 130 | 0 |
| B | 0 | 130 | 0 |
| C | 0 | 130 | 0 |
| D | 0 | 130 | 0 |
| Mode M9 | |||
|---|---|---|---|
| Quadrant | BADHDUFLAG | Total packets | Discarded packets |
| A | 0 | 12 | 0 |
| B | 0 | 12 | 0 |
| C | 0 | 12 | 0 |
| D | 0 | 12 | 0 |
| Mode M0 | |||
|---|---|---|---|
| Quadrant | BADHDUFLAG | Total packets | Discarded packets |
| A | 0 | 15366 | 3 |
| B | 0 | 13321 | 2 |
| C | 0 | 12847 | 2 |
| D | 0 | 15015 | 2 |
| Quadrant | Total seconds | Saturated seconds | Saturation percentage |
|---|---|---|---|
| A | 6318 | 45 | 0.712251% |
| B | 6318 | 41 | 0.648940% |
| C | 6318 | 5 | 0.079139% |
| D | 6319 | 164 | 2.595347% |
Noise dominated data is calculated using 1-second bins in cleaned event files. If a bin has >2000 counts, and if more than 50% of those come from <1% of pixels, then it is considered to be noise-dominated and hence unusable.
| Quadrant | # 1 sec bins | Bins with >0 counts | Bins with >2000 counts | High rate bins dominated by noise | Noise dominated (total time) | Noise dominated (detector-on time) | Marked lightcurve |
|---|---|---|---|---|---|---|---|
| A | 7543 | 6319 | 25 | 25 | 0.33% | 0.40% | 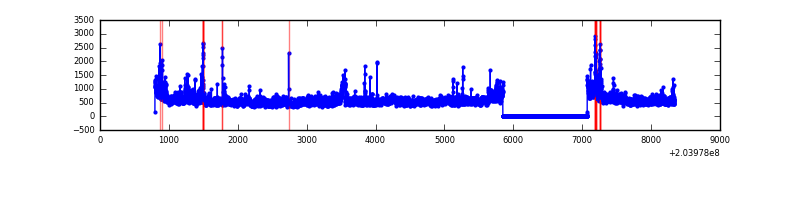 |
| B | 7543 | 6319 | 19 | 19 | 0.25% | 0.30% | 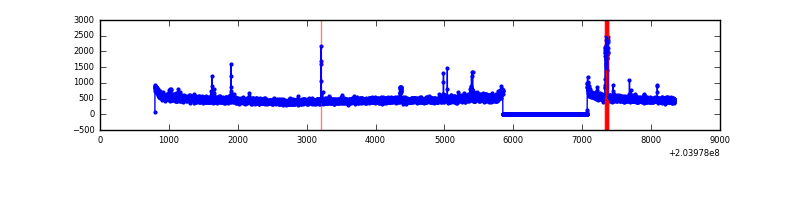 |
| C | 7543 | 6319 | 0 | 0 | 0.00% | 0.00% | 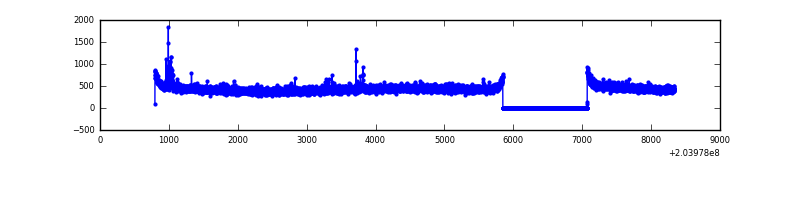 |
| D | 7544 | 6320 | 159 | 159 | 2.11% | 2.52% | 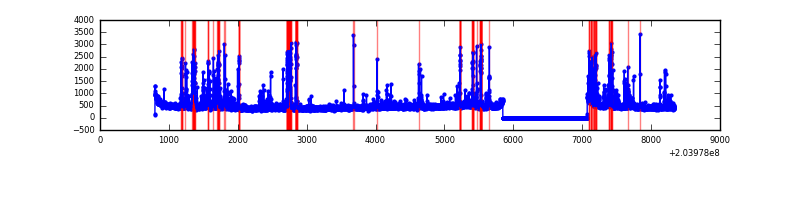 |
Top three noisy pixels from each quadrant. If the there are fewer than three noisy pixels in the level2.evt file, extra rows are filled as -1
| Pixel properties | Quadrant properties | ||||||
|---|---|---|---|---|---|---|---|
| Quadrant | DetID | PixID | Counts | Sigma | Mean | Median | Sigma |
| A | 8 | 15 | 676486 | 4574.51 | 732 | 718 | 147.7 |
| A | 0 | 118 | 150124 | 1011.38 | 732 | 718 | 147.7 |
| A | 0 | 50 | 81843 | 549.16 | 732 | 718 | 147.7 |
| B | 4 | 170 | 66460 | 461.83 | 744 | 726 | 142.3 |
| B | 15 | 204 | 31003 | 212.72 | 744 | 726 | 142.3 |
| B | 7 | 221 | 27073 | 185.11 | 744 | 726 | 142.3 |
| C | 10 | 65 | 29482 | 176.1 | 705 | 708 | 163.4 |
| C | 13 | 61 | 5979 | 32.26 | 705 | 708 | 163.4 |
| C | 1 | 16 | 2870 | 13.23 | 705 | 708 | 163.4 |
| D | 2 | 232 | 414846 | 2521.66 | 690 | 672 | 164.2 |
| D | 13 | 223 | 150668 | 913.24 | 690 | 672 | 164.2 |
| D | 13 | 239 | 113961 | 689.75 | 690 | 672 | 164.2 |
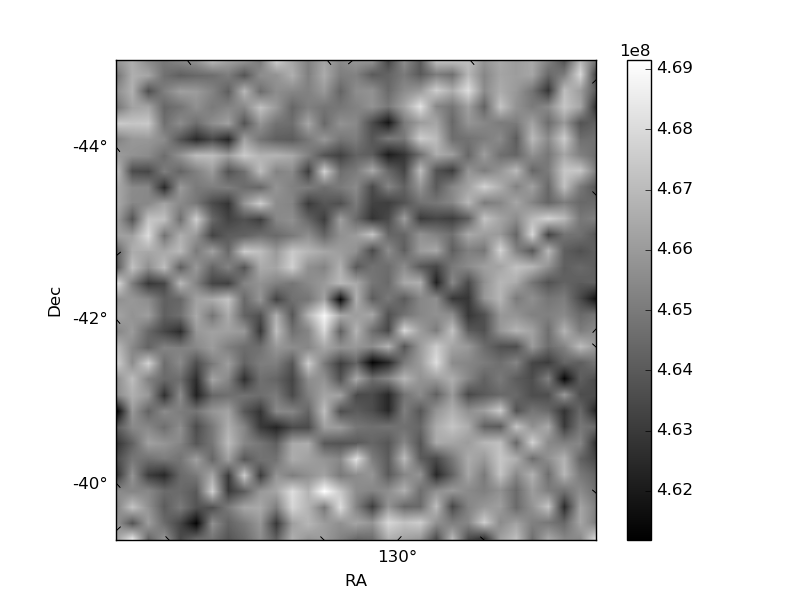
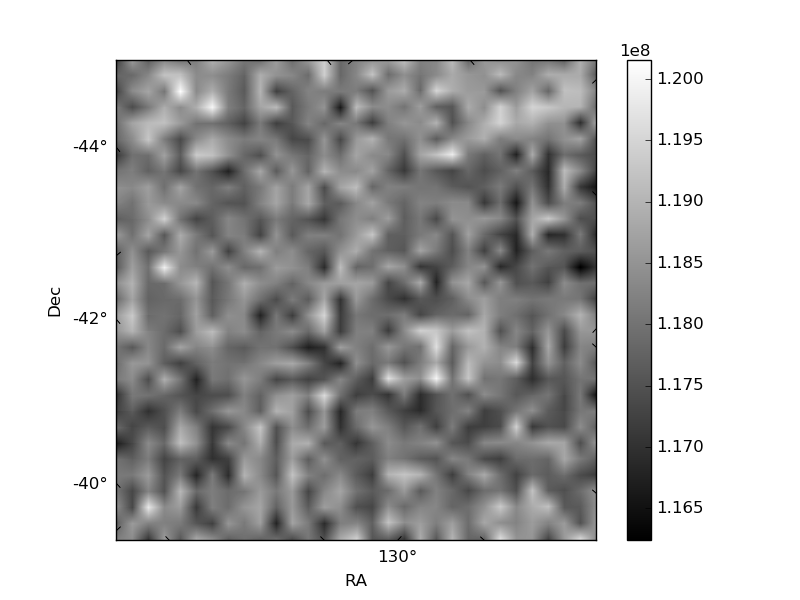
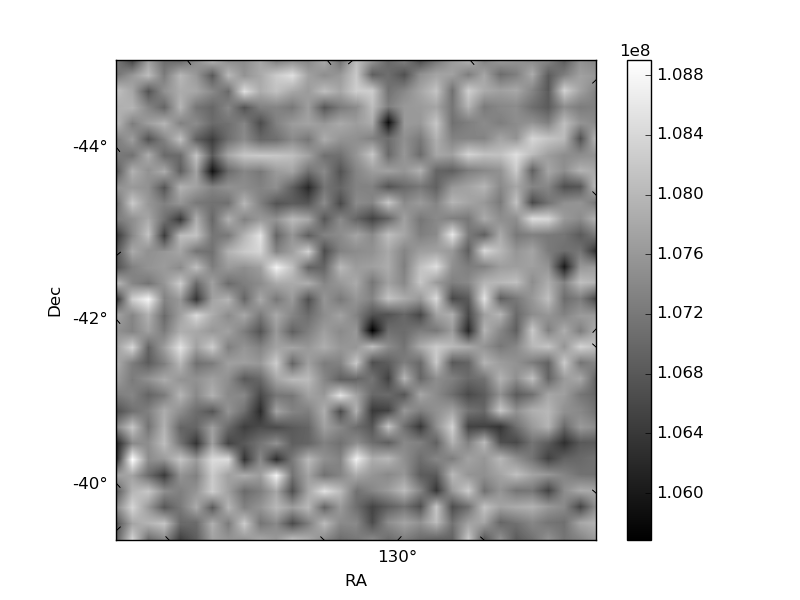
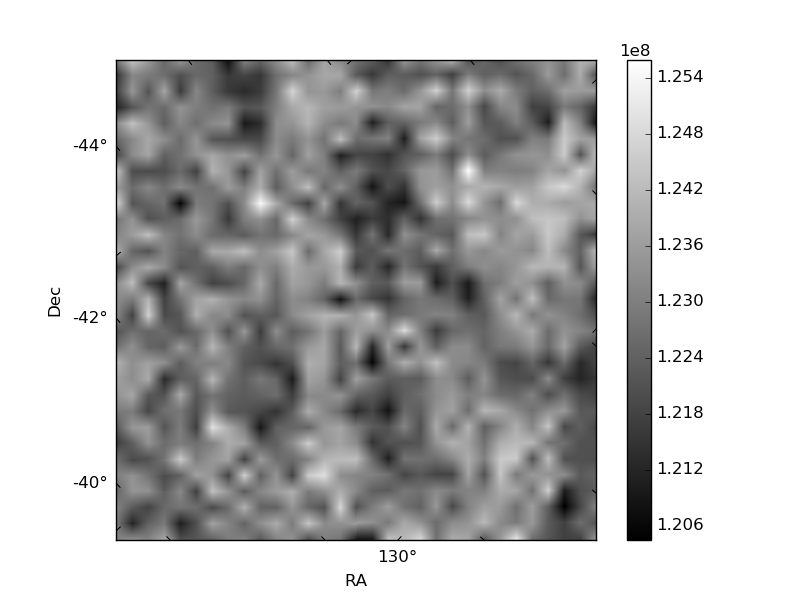
Histogram calculated using DETX and DETY for each event in the final _common_clean file
| Quadrant A | 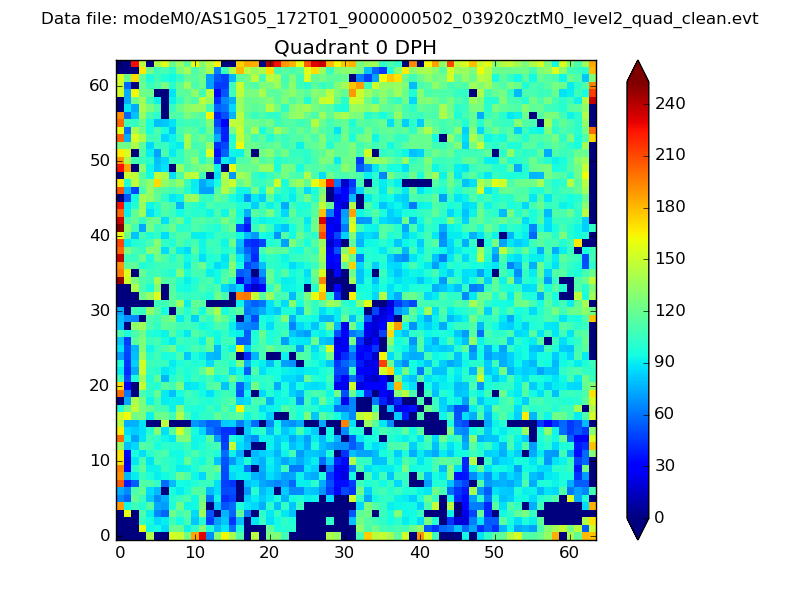 |
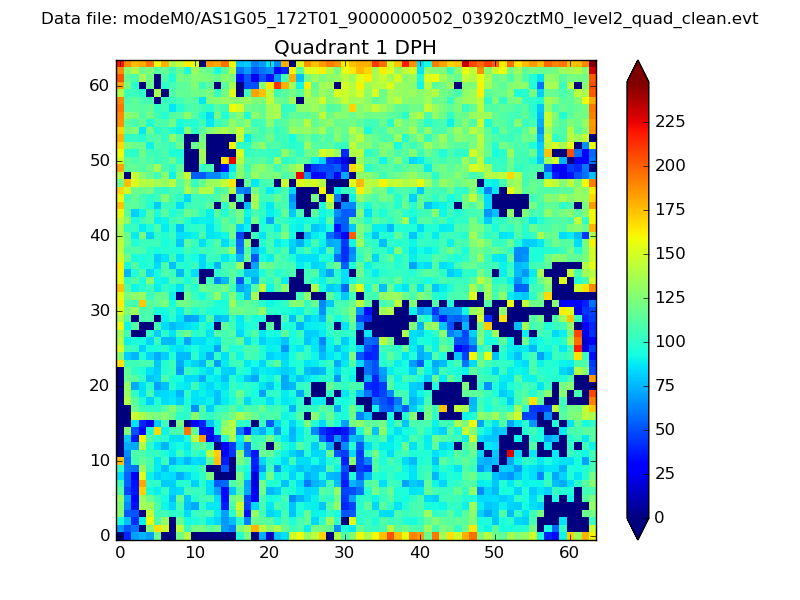 |
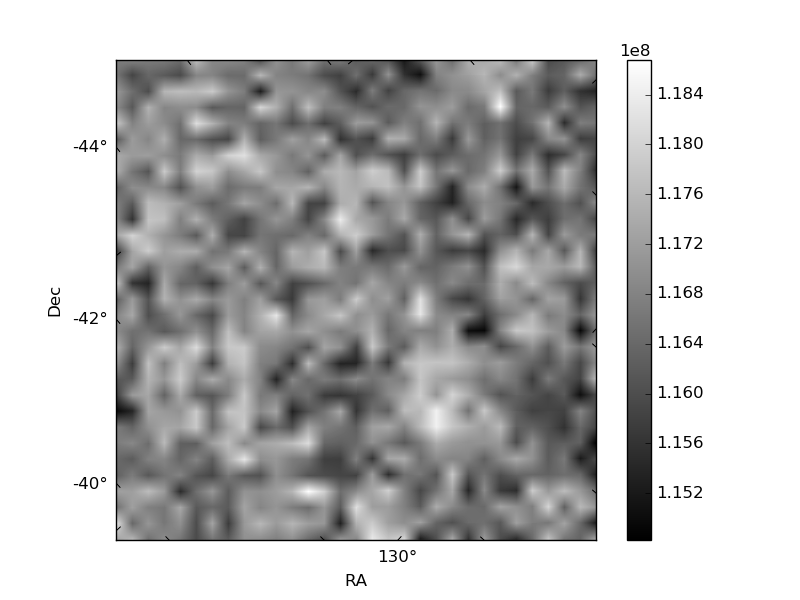
Quadrant B |
|---|---|---|---|
| Quadrant D | 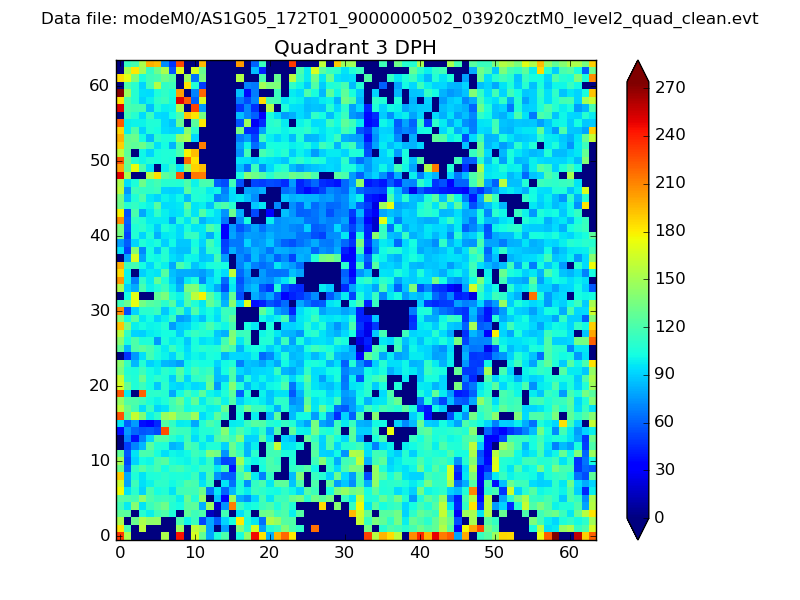 |
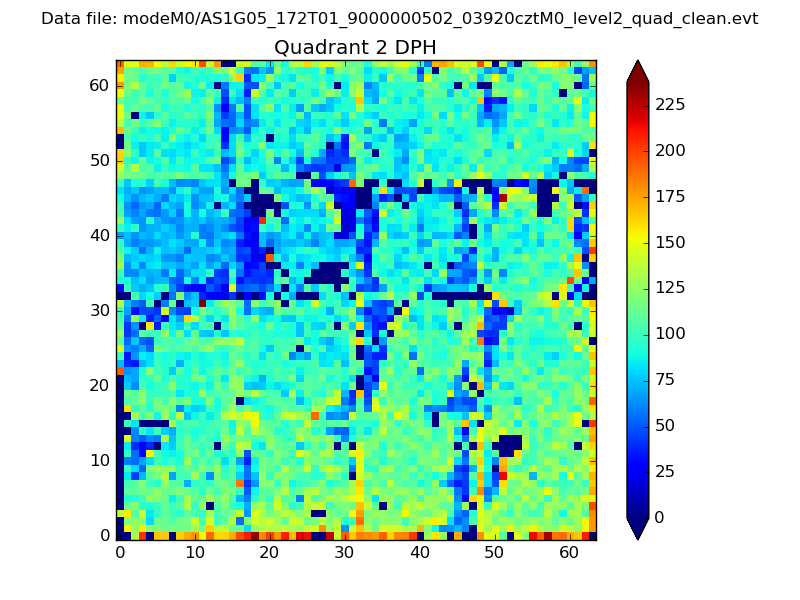 |
Quadrant C |
| Plot type | Count rate plots | Images |
|---|---|---|
| Comparison with Poisson distribution Blue bars denote a histogram of data divided into 1 sec bins. Red curve is a Poisson curve with rate = median count rate of data. |
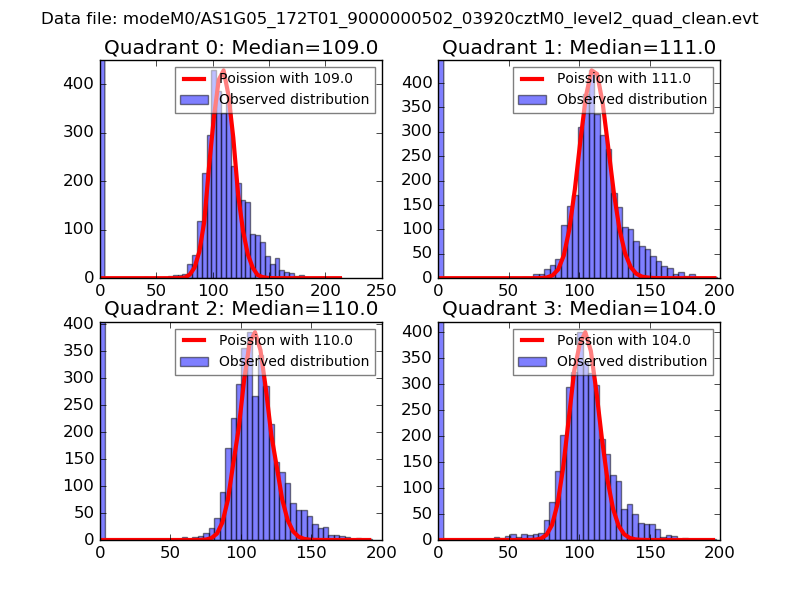 |
 |
| Quadrant-wise count rates Data is divided into 100 sec bins |
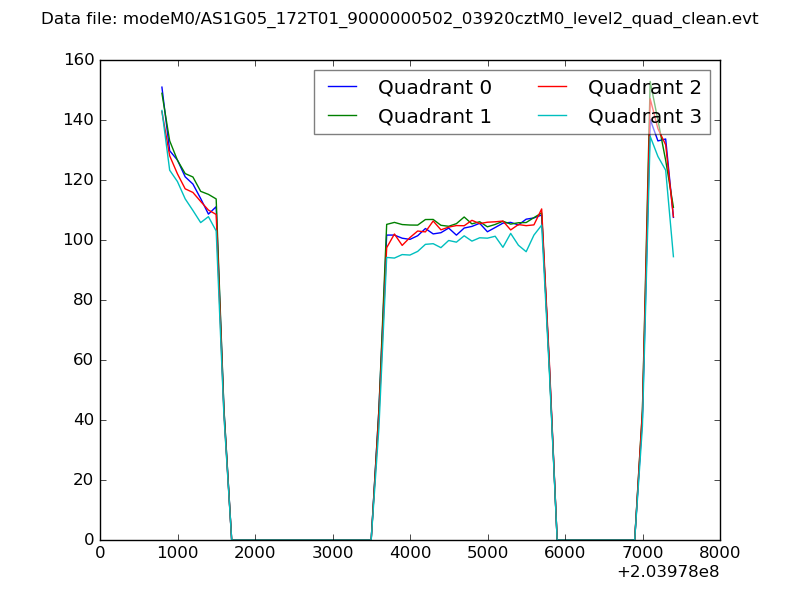 |
|
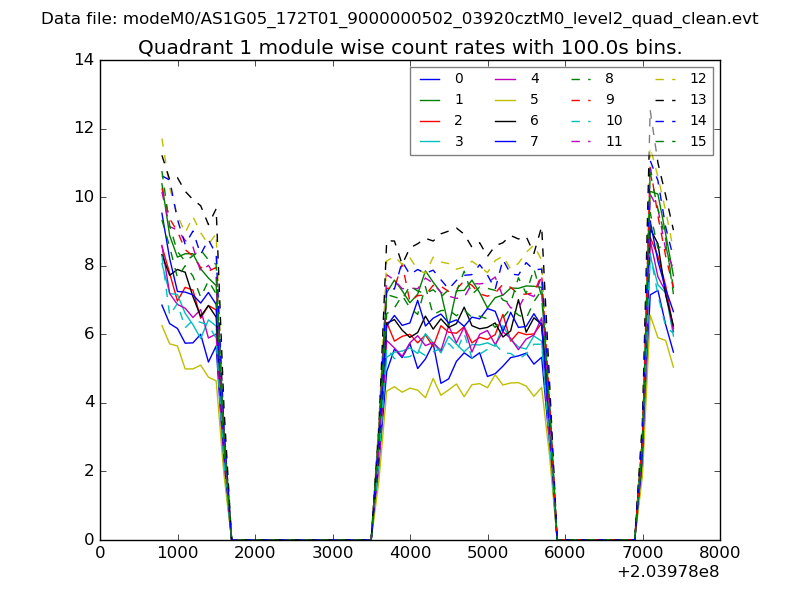
| Module-wise count rates for Quadrant A Data is divided into 100 sec bins |
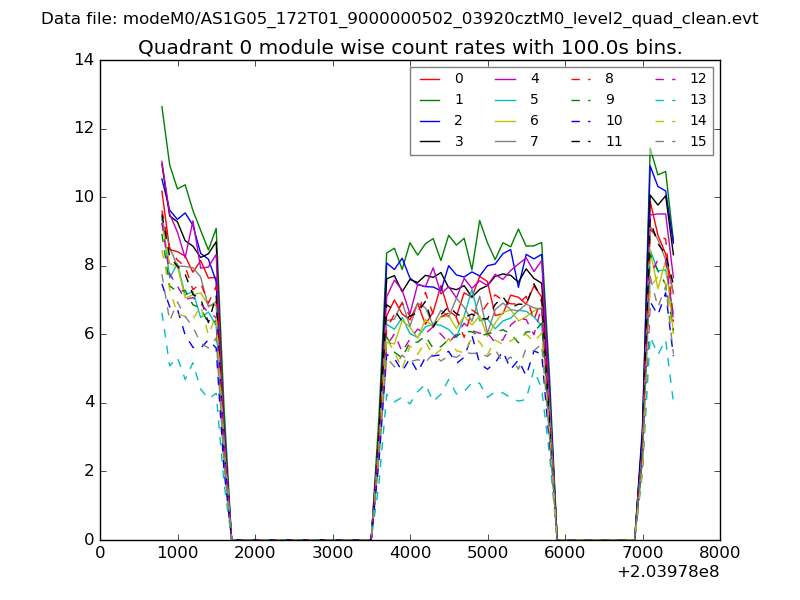 |
 |
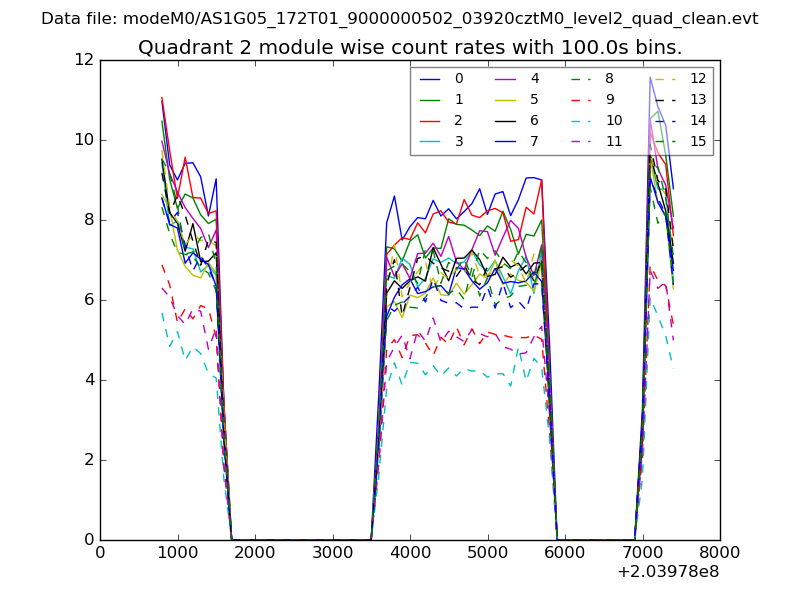
| Module-wise count rates for Quadrant B Data is divided into 100 sec bins |
 |
 |
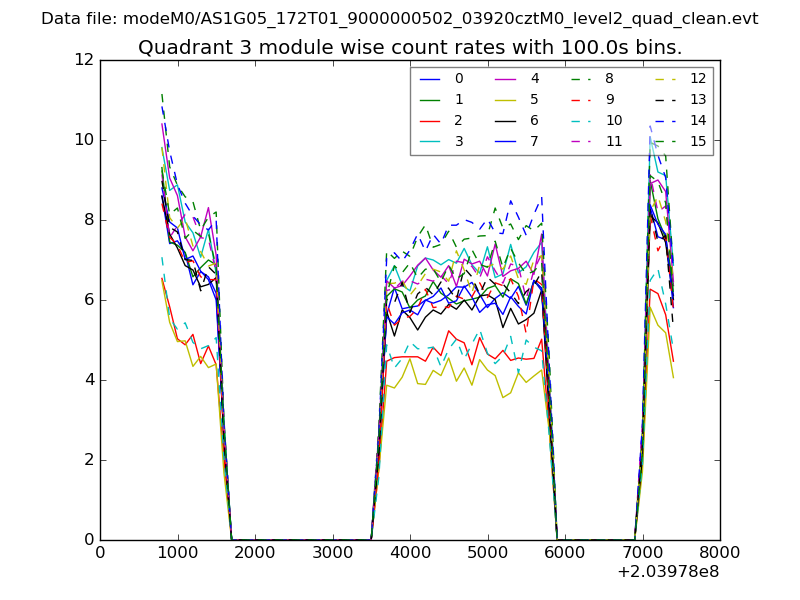
| Module-wise count rates for Quadrant C Data is divided into 100 sec bins |
 |
 |
| Module-wise count rates for Quadrant D Data is divided into 100 sec bins |
 |
 |
| Parameter | Plot |
|---|---|
| CZT HV Monitor | 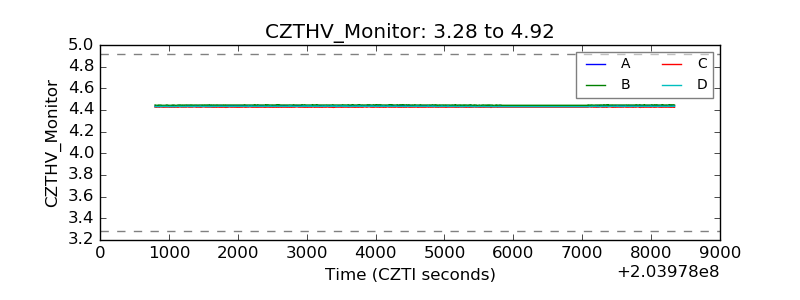 |
| D_VDD | 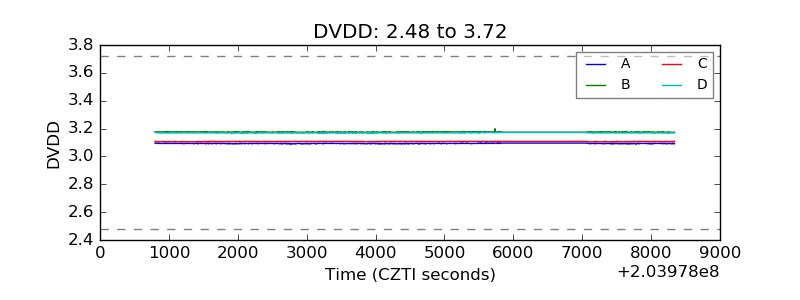 |
| Temperature 1 | 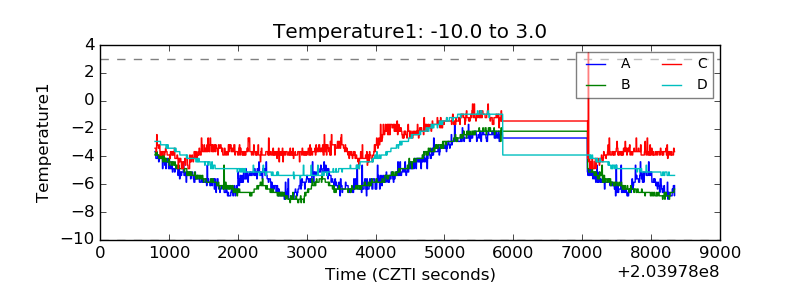 |
| Veto HV Monitor | 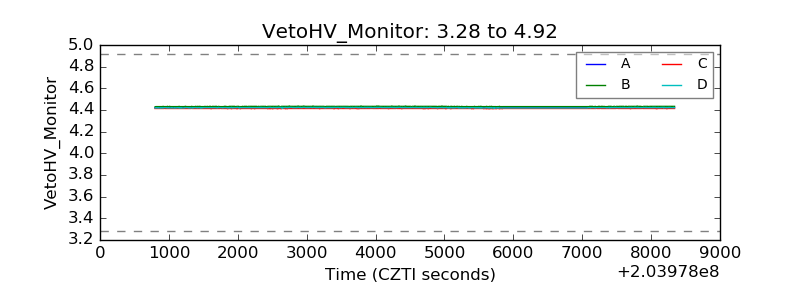 |
| Veto LLD | 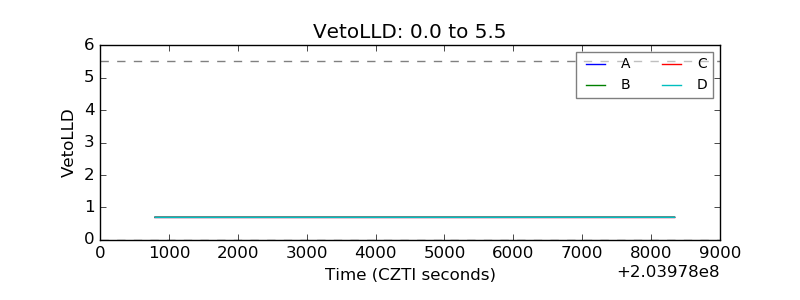 |
| Alpha Counter | 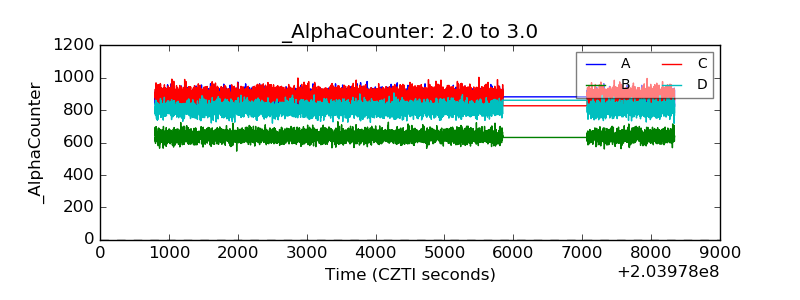 |
| _CPM_Rate | 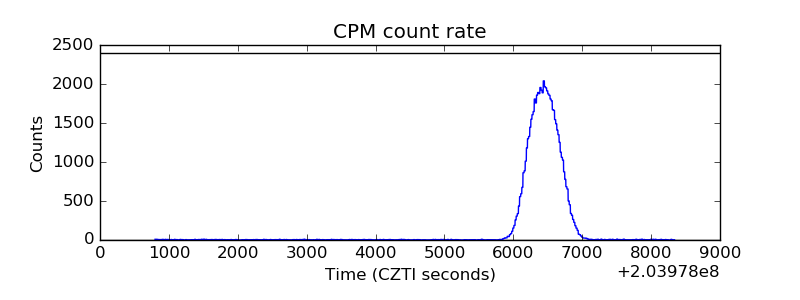 |
| CZT Counter | 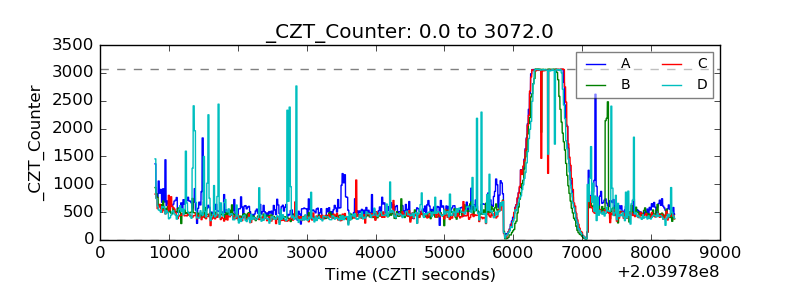 |
| +2.5 Volts monitor |  |
| +5 Volts monitor |  |
| Veto Counter | 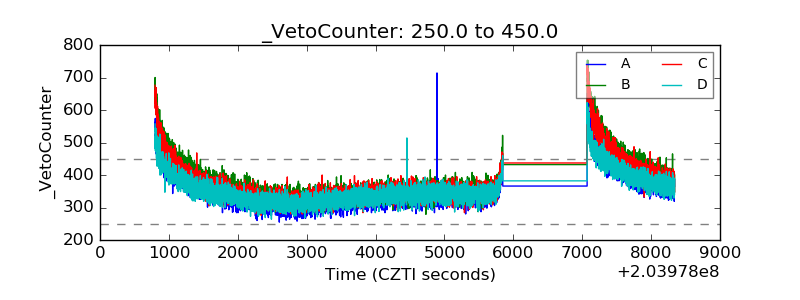 |