| Param | Original file | Final file |
|---|---|---|
| Filename | modeM0/AS1G05_172T01_9000000502_03921cztM0_level2.evt | modeM0/AS1G05_172T01_9000000502_03921cztM0_level2_quad_clean.evt |
| Size (bytes) | 460,797,120 | 57,640,320 |
| Size | 439.5 MB | 55.0 MB |
| Events in quadrant A | 3,881,863 | 326,581 |
| Events in quadrant B | 3,249,621 | 334,904 |
| Events in quadrant C | 2,880,802 | 331,065 |
| Events in quadrant D | 3,514,081 | 311,719 |
| Mode SS | |||
|---|---|---|---|
| Quadrant | BADHDUFLAG | Total packets | Discarded packets |
| A | 0 | 128 | 0 |
| B | 0 | 128 | 0 |
| C | 0 | 128 | 0 |
| D | 0 | 128 | 0 |
| Mode M9 | |||
|---|---|---|---|
| Quadrant | BADHDUFLAG | Total packets | Discarded packets |
| A | 0 | 16 | 0 |
| B | 0 | 16 | 0 |
| C | 0 | 16 | 0 |
| D | 0 | 17 | 0 |
| Mode M0 | |||
|---|---|---|---|
| Quadrant | BADHDUFLAG | Total packets | Discarded packets |
| A | 0 | 15715 | 3 |
| B | 0 | 13651 | 2 |
| C | 0 | 12859 | 2 |
| D | 0 | 14869 | 2 |
| Quadrant | Total seconds | Saturated seconds | Saturation percentage |
|---|---|---|---|
| A | 6314 | 65 | 1.029458% |
| B | 6314 | 81 | 1.282863% |
| C | 6314 | 16 | 0.253405% |
| D | 6314 | 119 | 1.884701% |
Noise dominated data is calculated using 1-second bins in cleaned event files. If a bin has >2000 counts, and if more than 50% of those come from <1% of pixels, then it is considered to be noise-dominated and hence unusable.
| Quadrant | # 1 sec bins | Bins with >0 counts | Bins with >2000 counts | High rate bins dominated by noise | Noise dominated (total time) | Noise dominated (detector-on time) | Marked lightcurve |
|---|---|---|---|---|---|---|---|
| A | 7599 | 6315 | 21 | 21 | 0.28% | 0.33% | 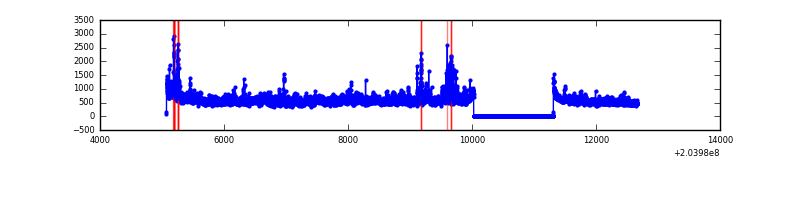 |
| B | 7599 | 6315 | 45 | 45 | 0.59% | 0.71% | 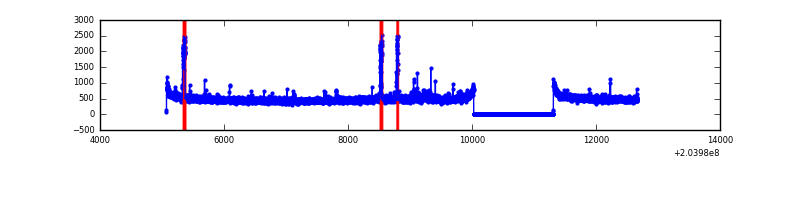 |
| C | 7599 | 6315 | 0 | 0 | 0.00% | 0.00% | 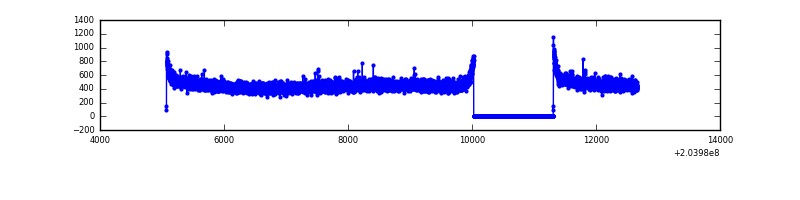 |
| D | 7599 | 6315 | 106 | 106 | 1.39% | 1.68% | 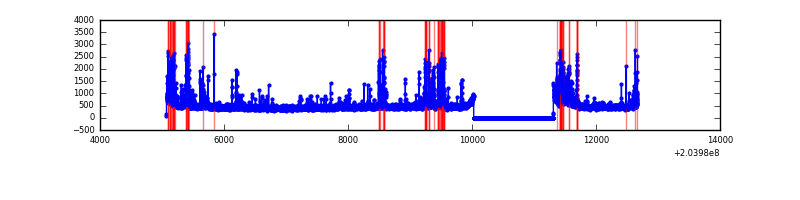 |
Top three noisy pixels from each quadrant. If the there are fewer than three noisy pixels in the level2.evt file, extra rows are filled as -1
| Pixel properties | Quadrant properties | ||||||
|---|---|---|---|---|---|---|---|
| Quadrant | DetID | PixID | Counts | Sigma | Mean | Median | Sigma |
| A | 8 | 15 | 686535 | 4459.01 | 758 | 741 | 153.8 |
| A | 0 | 118 | 207426 | 1343.86 | 758 | 741 | 153.8 |
| A | 13 | 251 | 30525 | 193.65 | 758 | 741 | 153.8 |
| B | 7 | 221 | 79805 | 541.28 | 771 | 753 | 146.0 |
| B | 4 | 170 | 66252 | 448.48 | 771 | 753 | 146.0 |
| B | 15 | 204 | 60939 | 412.1 | 771 | 753 | 146.0 |
| C | 13 | 61 | 6407 | 33.54 | 734 | 738 | 169.0 |
| C | 9 | 144 | 4164 | 20.27 | 734 | 738 | 169.0 |
| C | 10 | 65 | 3792 | 18.07 | 734 | 738 | 169.0 |
| D | 2 | 232 | 452140 | 2608.12 | 722 | 703 | 173.1 |
| D | 13 | 239 | 94381 | 541.21 | 722 | 703 | 173.1 |
| D | 12 | 233 | 41112 | 233.46 | 722 | 703 | 173.1 |
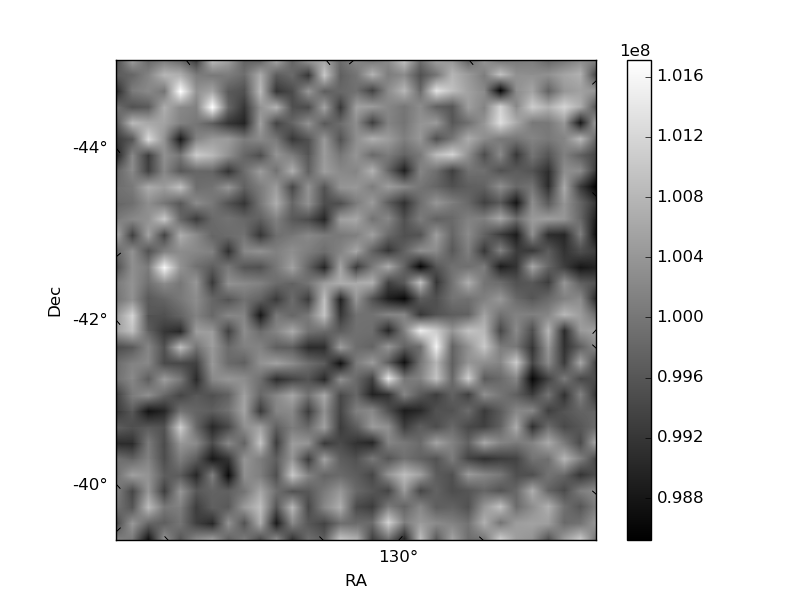
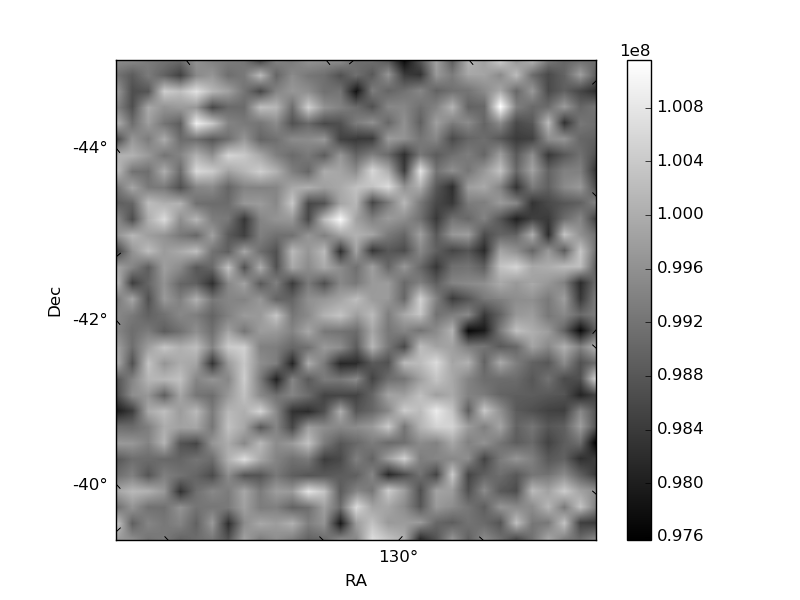
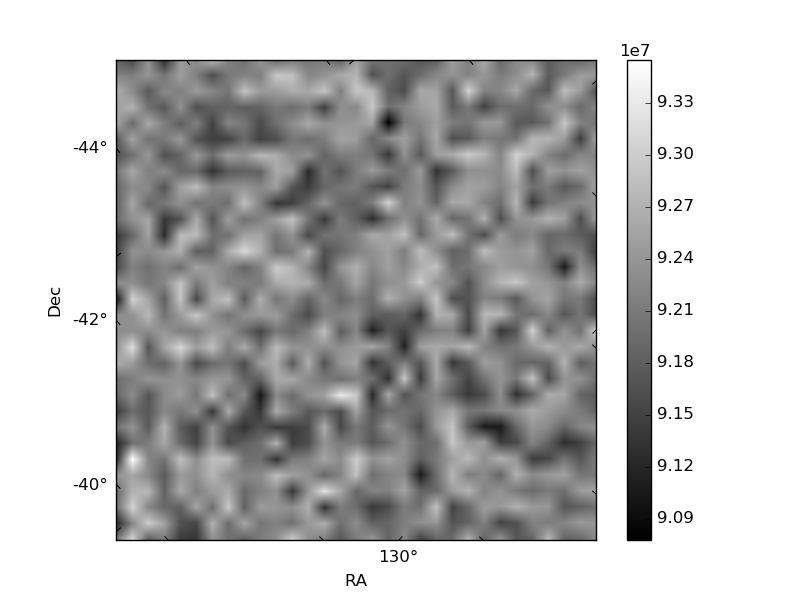
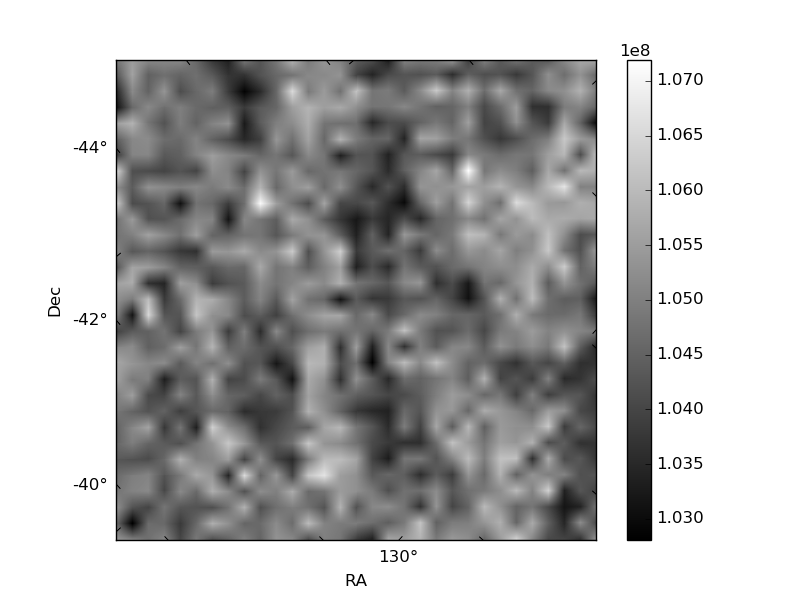
Histogram calculated using DETX and DETY for each event in the final _common_clean file
| Quadrant A | 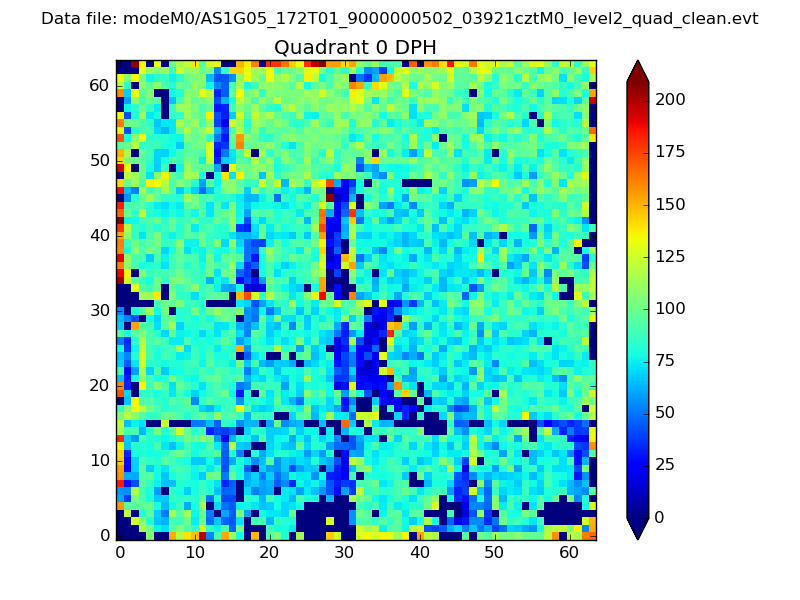 |
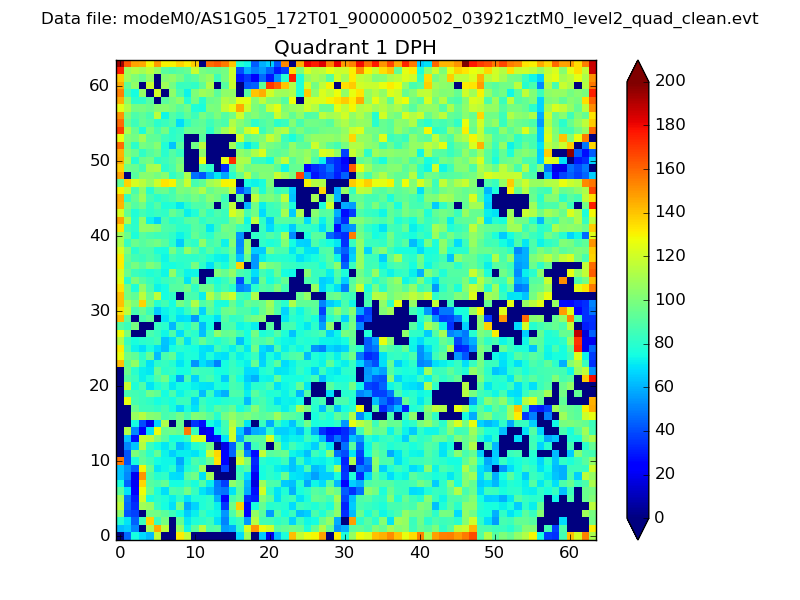 |
Quadrant B |
|---|---|---|---|
| Quadrant D | 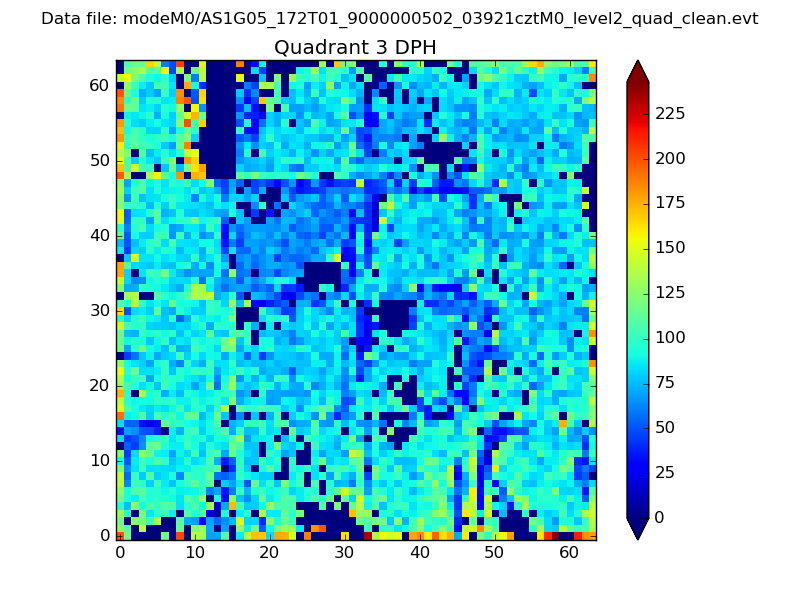 |
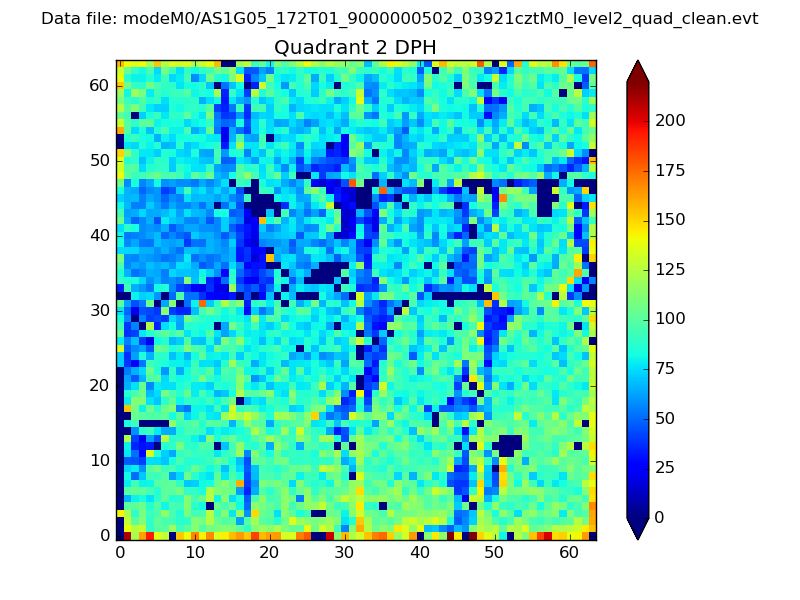 |
Quadrant C |
| Plot type | Count rate plots | Images |
|---|---|---|
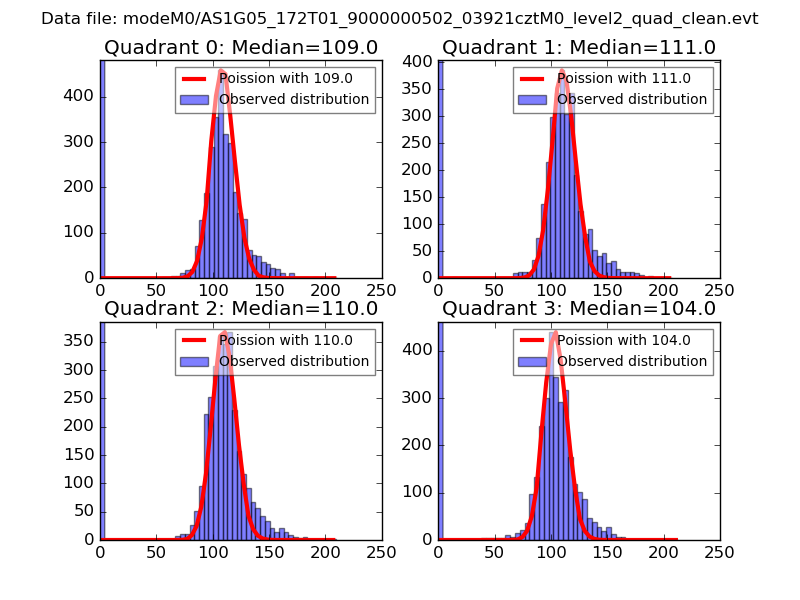
| Comparison with Poisson distribution Blue bars denote a histogram of data divided into 1 sec bins. Red curve is a Poisson curve with rate = median count rate of data. |
 |
 |
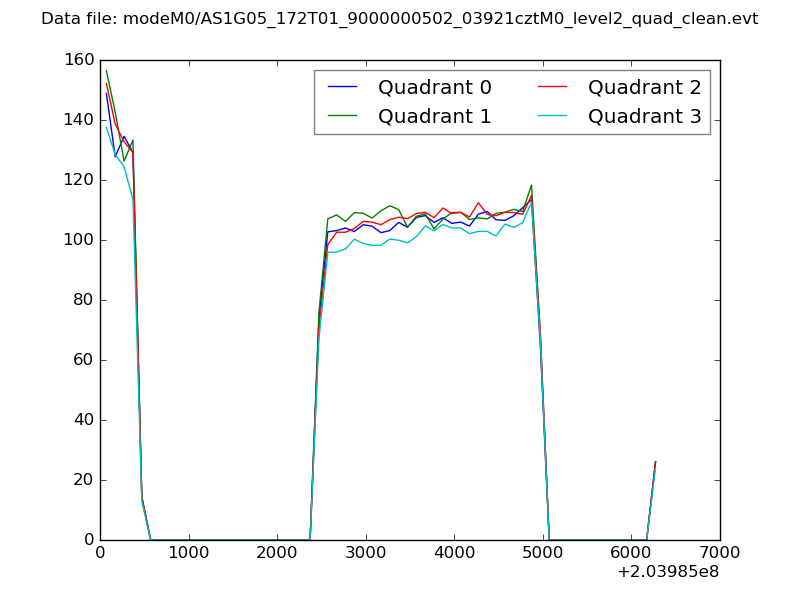
| Quadrant-wise count rates Data is divided into 100 sec bins |
 |
|
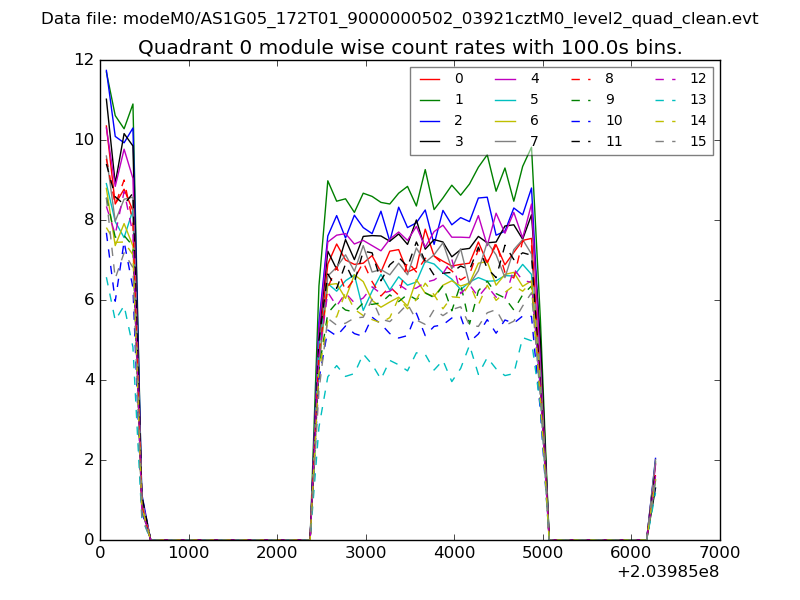
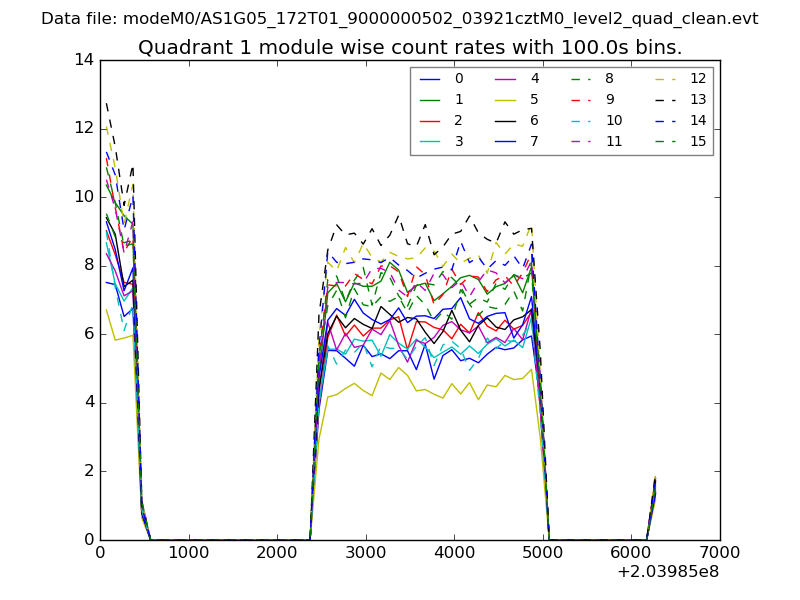
| Module-wise count rates for Quadrant A Data is divided into 100 sec bins |
 |
 |
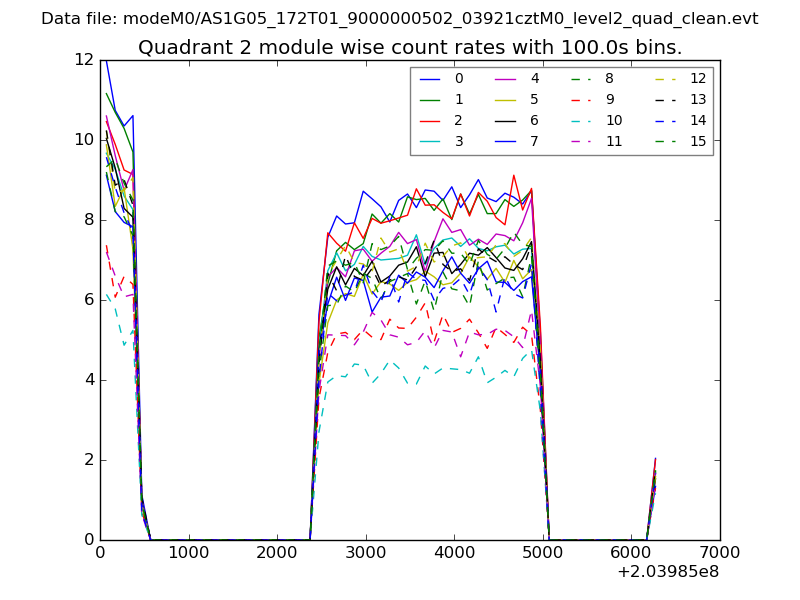
| Module-wise count rates for Quadrant B Data is divided into 100 sec bins |
 |
 |
| Module-wise count rates for Quadrant C Data is divided into 100 sec bins |
 |
 |
| Module-wise count rates for Quadrant D Data is divided into 100 sec bins |
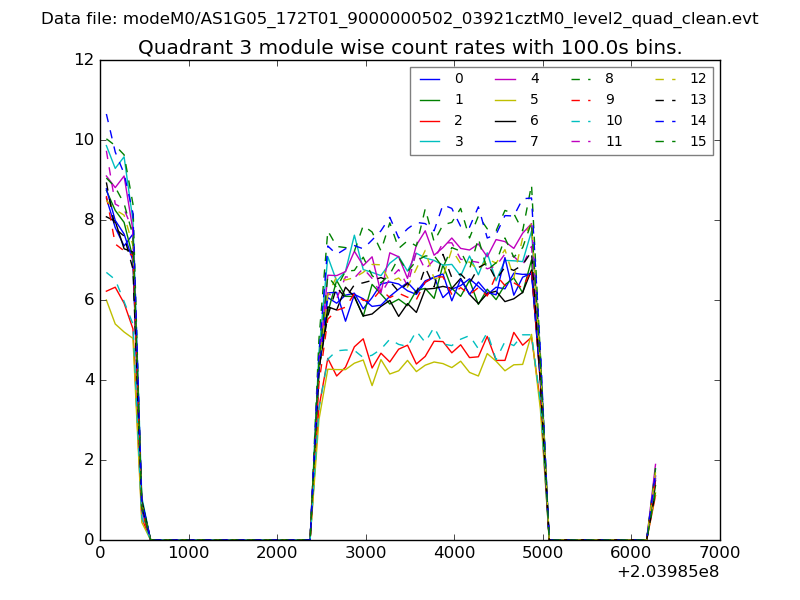 |
 |
| Parameter | Plot |
|---|---|
| CZT HV Monitor | 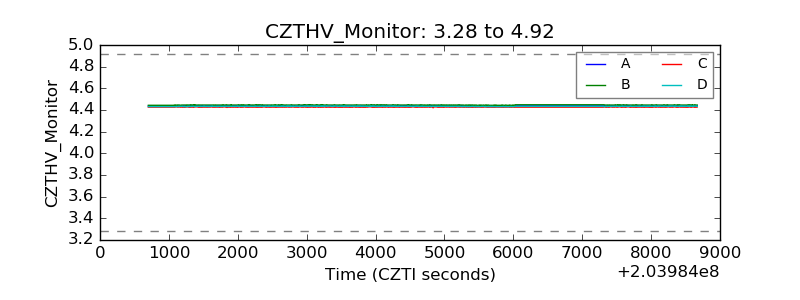 |
| D_VDD | 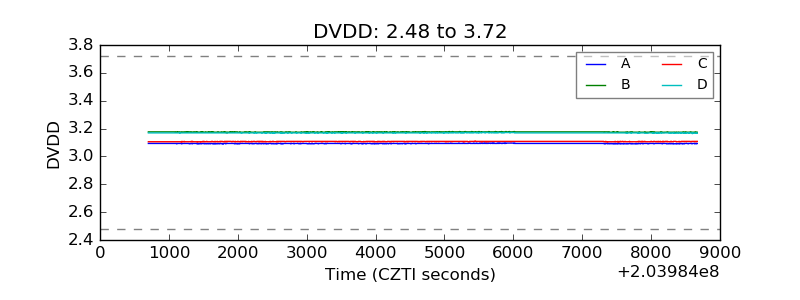 |
| Temperature 1 | 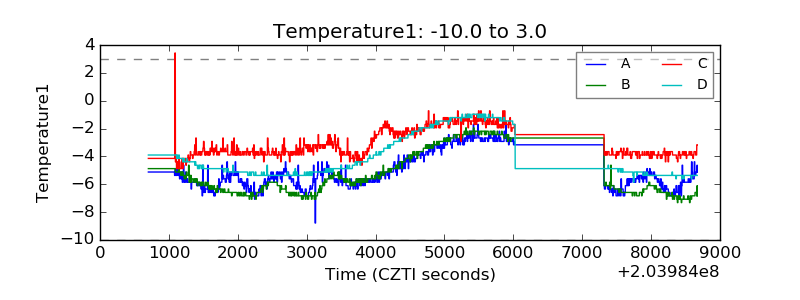 |
| Veto HV Monitor | 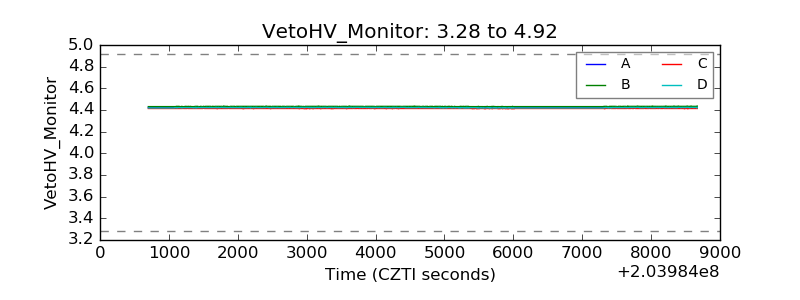 |
| Veto LLD | 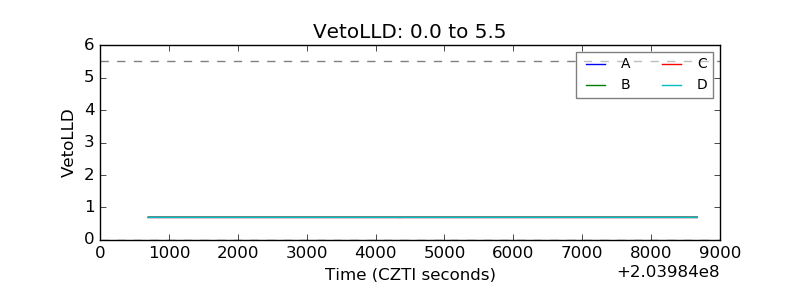 |
| Alpha Counter | 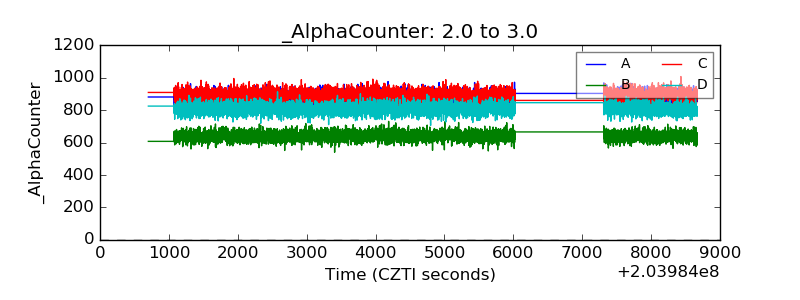 |
| _CPM_Rate | 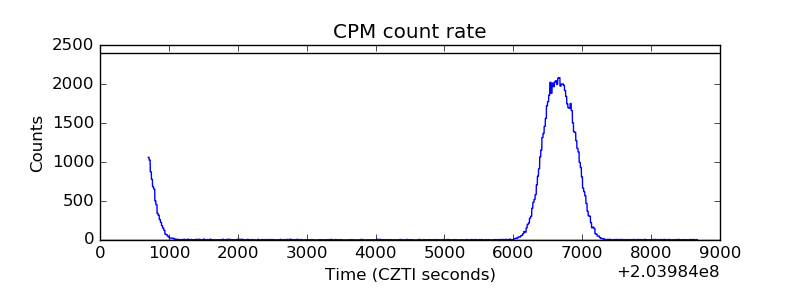 |
| CZT Counter | 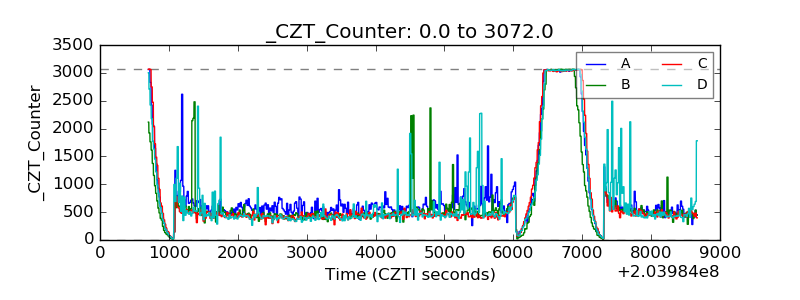 |
| +2.5 Volts monitor |  |
| +5 Volts monitor | 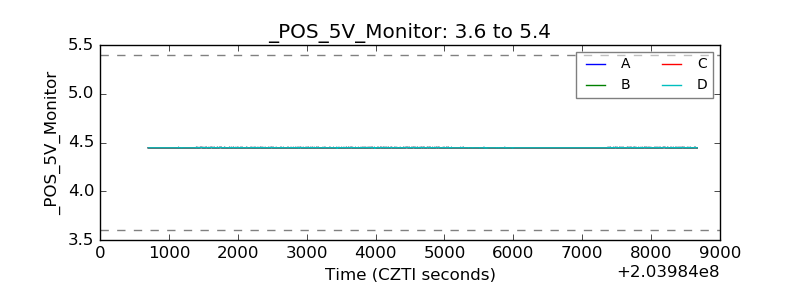 |
| Veto Counter | 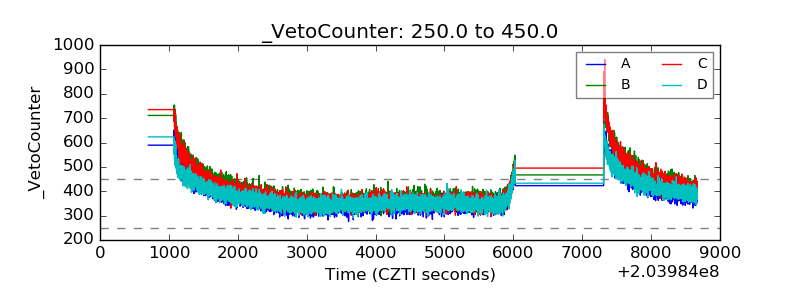 |