| Param | Original file | Final file |
|---|---|---|
| Filename | modeM0/AS1G05_172T01_9000000502_03922cztM0_level2.evt | modeM0/AS1G05_172T01_9000000502_03922cztM0_level2_quad_clean.evt |
| Size (bytes) | 434,652,480 | 55,831,680 |
| Size | 414.5 MB | 53.2 MB |
| Events in quadrant A | 3,548,772 | 315,638 |
| Events in quadrant B | 3,056,311 | 324,306 |
| Events in quadrant C | 2,875,272 | 320,319 |
| Events in quadrant D | 3,268,980 | 304,393 |
| Mode SS | |||
|---|---|---|---|
| Quadrant | BADHDUFLAG | Total packets | Discarded packets |
| A | 0 | 124 | 0 |
| B | 0 | 124 | 0 |
| C | 0 | 124 | 0 |
| D | 0 | 124 | 0 |
| Mode M9 | |||
|---|---|---|---|
| Quadrant | BADHDUFLAG | Total packets | Discarded packets |
| A | 0 | 20 | 0 |
| B | 0 | 20 | 0 |
| C | 0 | 20 | 0 |
| D | 0 | 21 | 0 |
| Mode M0 | |||
|---|---|---|---|
| Quadrant | BADHDUFLAG | Total packets | Discarded packets |
| A | 0 | 14393 | 3 |
| B | 0 | 12812 | 2 |
| C | 0 | 12511 | 2 |
| D | 0 | 13909 | 2 |
| Quadrant | Total seconds | Saturated seconds | Saturation percentage |
|---|---|---|---|
| A | 6093 | 90 | 1.477105% |
| B | 6093 | 43 | 0.705728% |
| C | 6093 | 24 | 0.393895% |
| D | 6093 | 86 | 1.411456% |
Noise dominated data is calculated using 1-second bins in cleaned event files. If a bin has >2000 counts, and if more than 50% of those come from <1% of pixels, then it is considered to be noise-dominated and hence unusable.
| Quadrant | # 1 sec bins | Bins with >0 counts | Bins with >2000 counts | High rate bins dominated by noise | Noise dominated (total time) | Noise dominated (detector-on time) | Marked lightcurve |
|---|---|---|---|---|---|---|---|
| A | 7433 | 6094 | 28 | 28 | 0.38% | 0.46% | 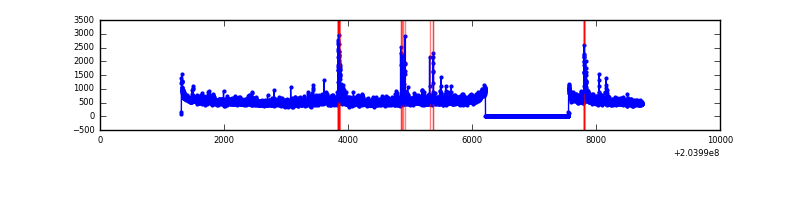 |
| B | 7433 | 6094 | 0 | 0 | 0.00% | 0.00% | 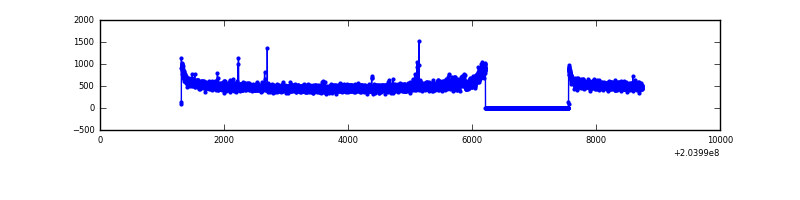 |
| C | 7433 | 6094 | 1 | 1 | 0.01% | 0.02% | 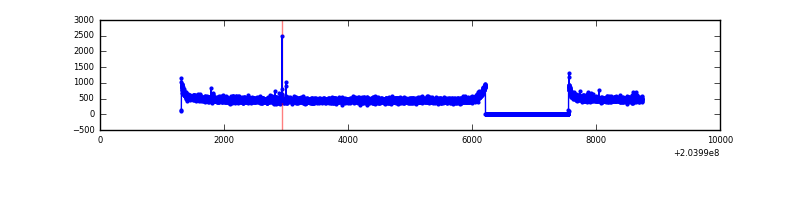 |
| D | 7433 | 6094 | 66 | 66 | 0.89% | 1.08% | 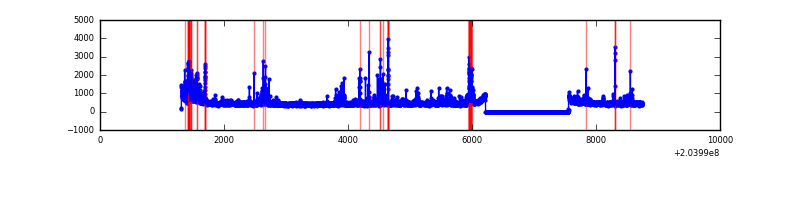 |
Top three noisy pixels from each quadrant. If the there are fewer than three noisy pixels in the level2.evt file, extra rows are filled as -1
| Pixel properties | Quadrant properties | ||||||
|---|---|---|---|---|---|---|---|
| Quadrant | DetID | PixID | Counts | Sigma | Mean | Median | Sigma |
| A | 8 | 15 | 440519 | 2931.97 | 747 | 733 | 150.0 |
| A | 0 | 118 | 131469 | 871.59 | 747 | 733 | 150.0 |
| A | 0 | 50 | 55899 | 367.78 | 747 | 733 | 150.0 |
| B | 15 | 204 | 54033 | 371.41 | 760 | 742 | 143.5 |
| B | 3 | 0 | 34180 | 233.04 | 760 | 742 | 143.5 |
| B | 0 | 229 | 16962 | 113.04 | 760 | 742 | 143.5 |
| C | 10 | 65 | 15152 | 86.31 | 730 | 736 | 167.0 |
| C | 13 | 61 | 6256 | 33.05 | 730 | 736 | 167.0 |
| C | 7 | 221 | 5176 | 26.58 | 730 | 736 | 167.0 |
| D | 2 | 232 | 284090 | 1672.29 | 716 | 696 | 169.5 |
| D | 12 | 233 | 45756 | 265.9 | 716 | 696 | 169.5 |
| D | 13 | 239 | 43349 | 251.69 | 716 | 696 | 169.5 |
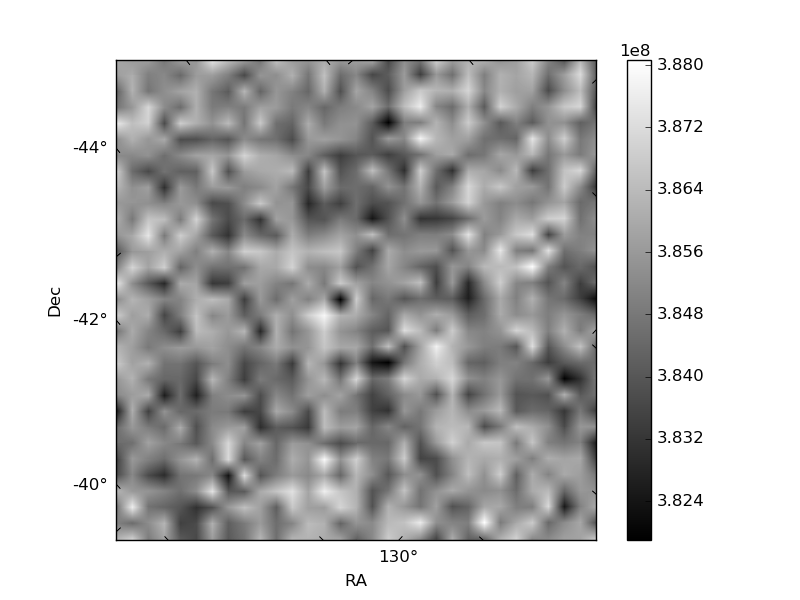
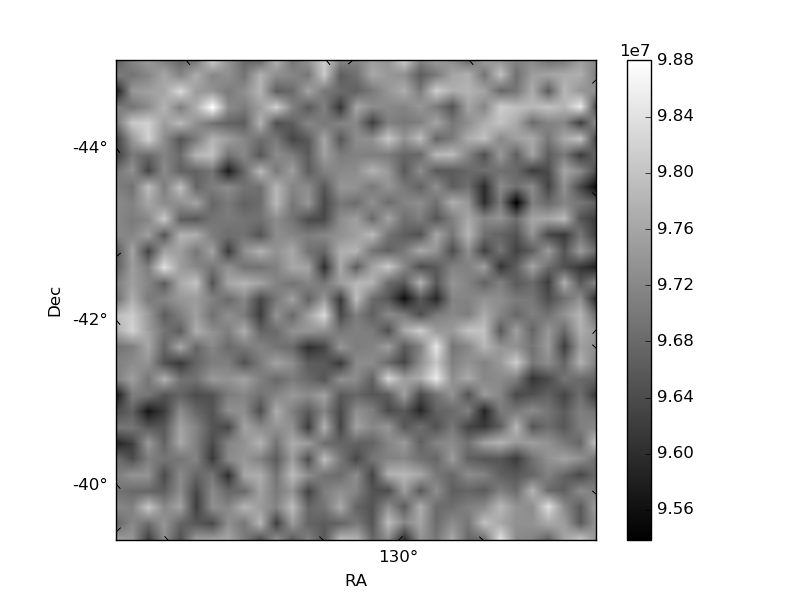
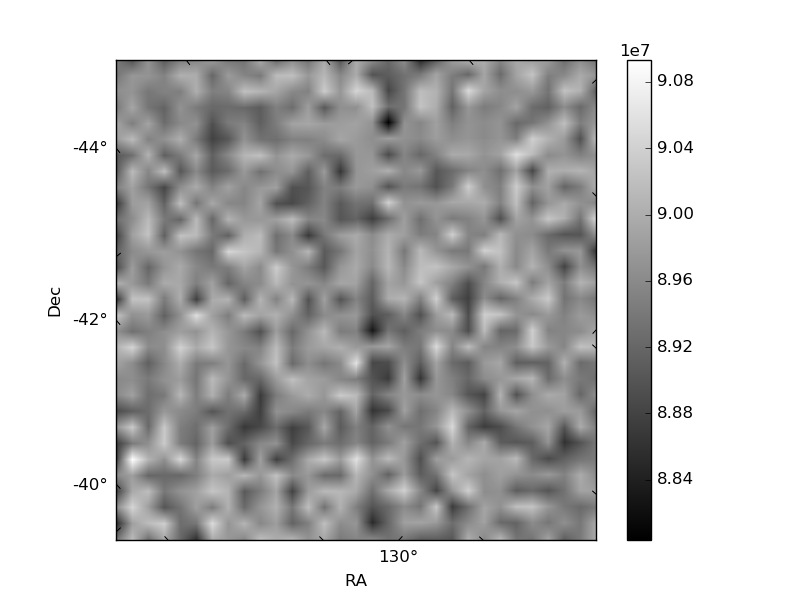
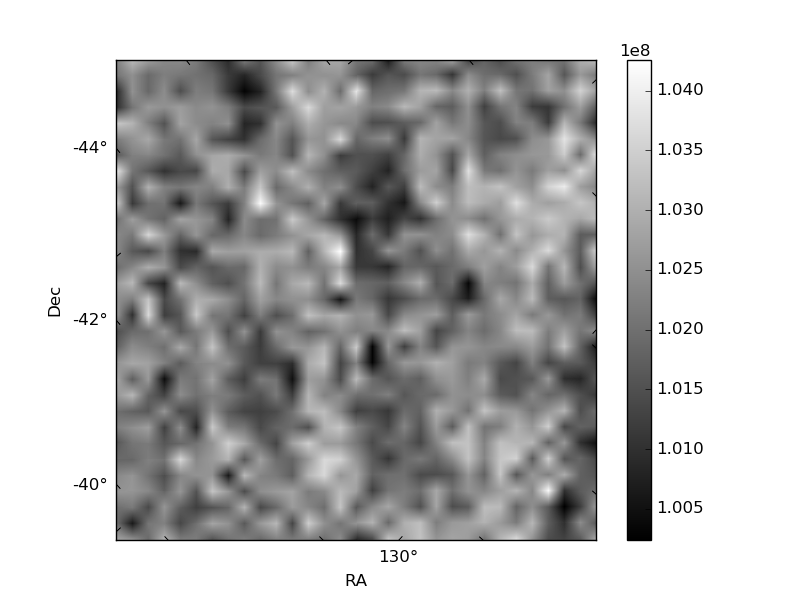
Histogram calculated using DETX and DETY for each event in the final _common_clean file
| Quadrant A | 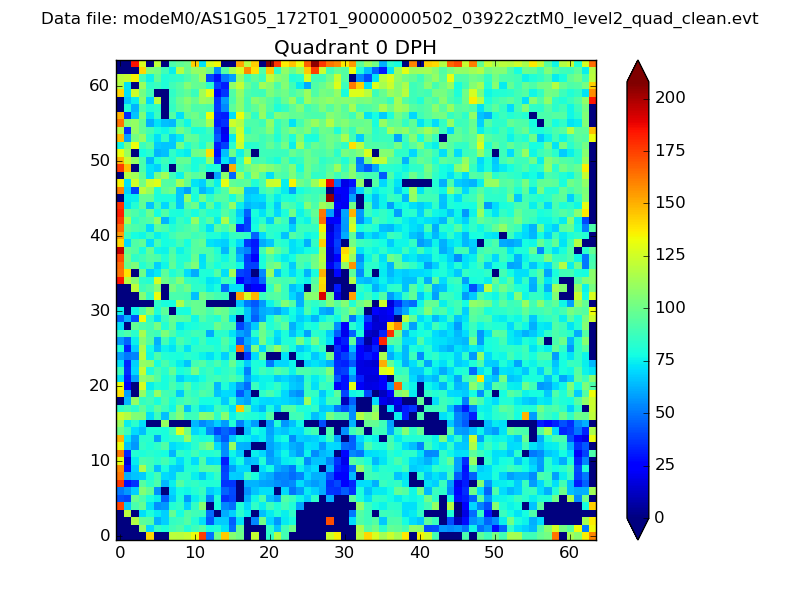 |
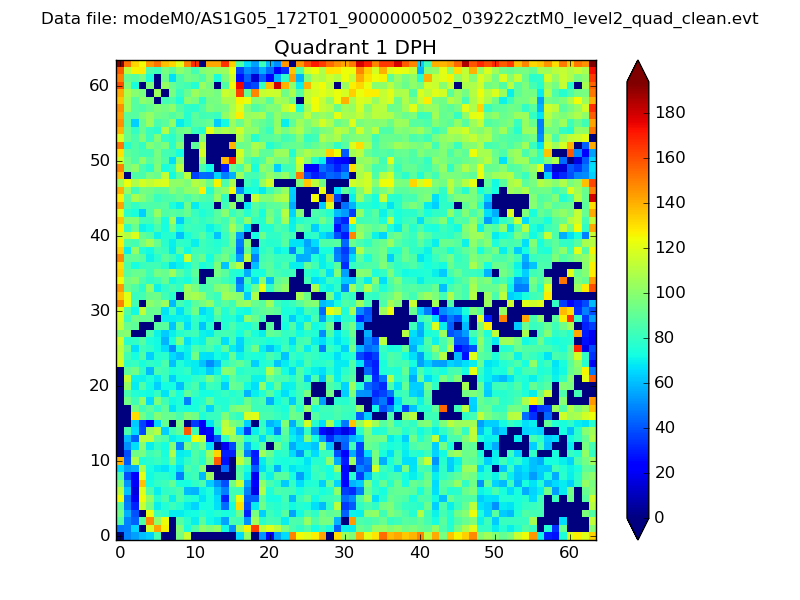 |
Quadrant B |
|---|---|---|---|
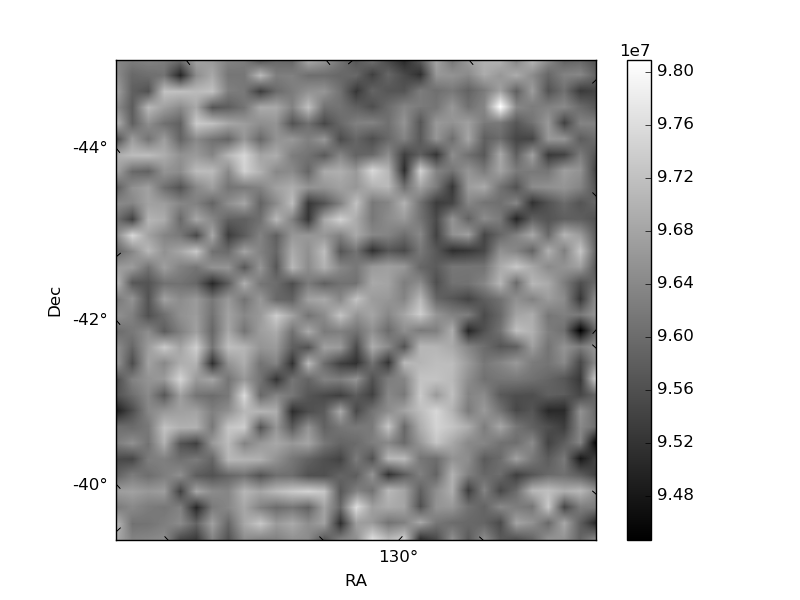
| Quadrant D | 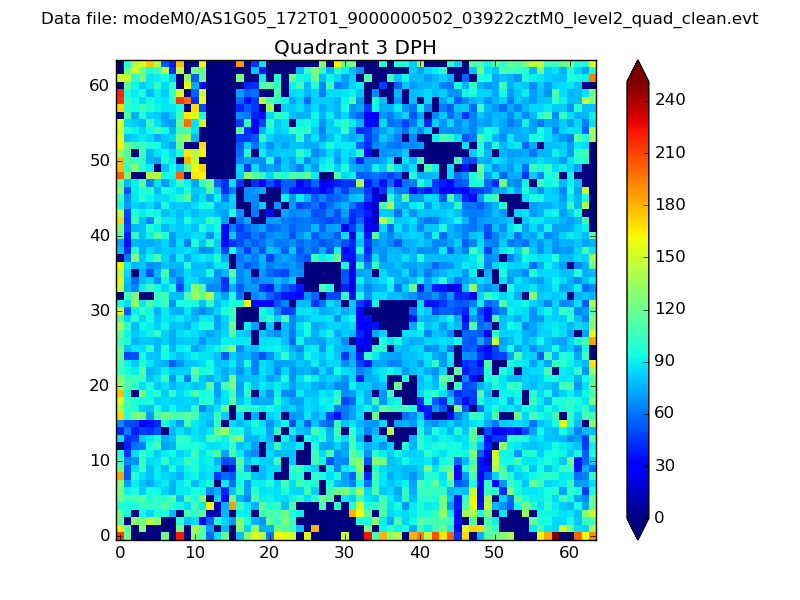 |
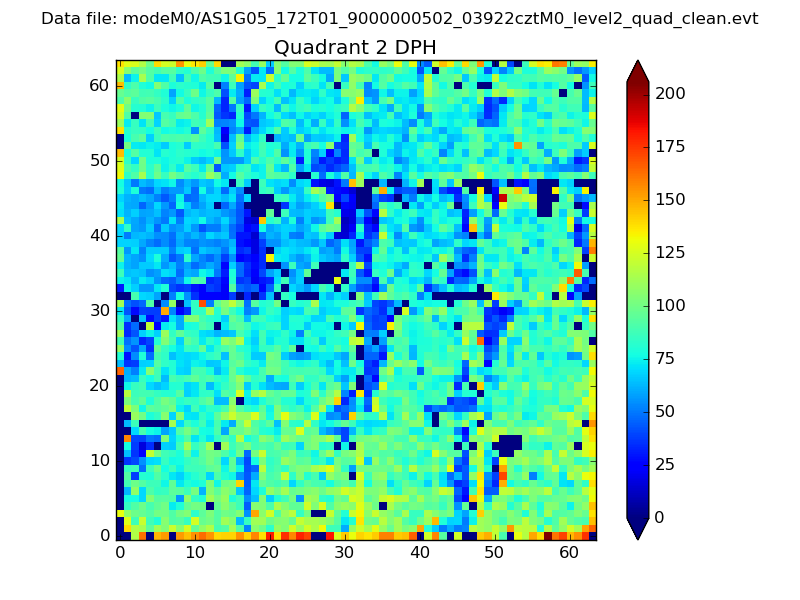 |
Quadrant C |
| Plot type | Count rate plots | Images |
|---|---|---|
| Comparison with Poisson distribution Blue bars denote a histogram of data divided into 1 sec bins. Red curve is a Poisson curve with rate = median count rate of data. |
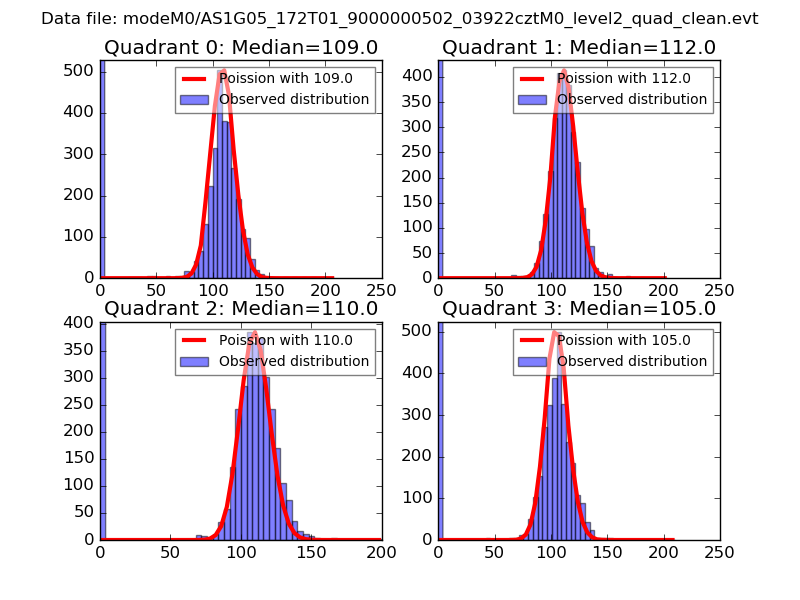 |
 |
| Quadrant-wise count rates Data is divided into 100 sec bins |
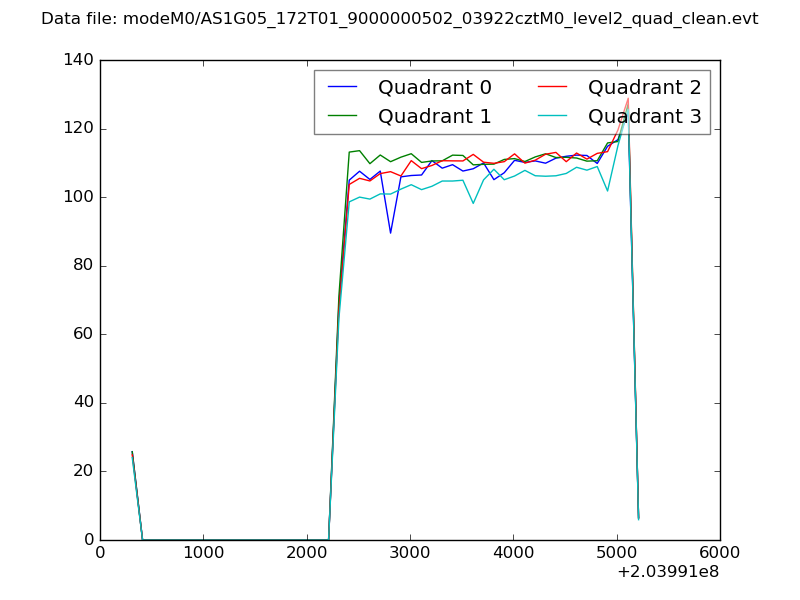 |
|
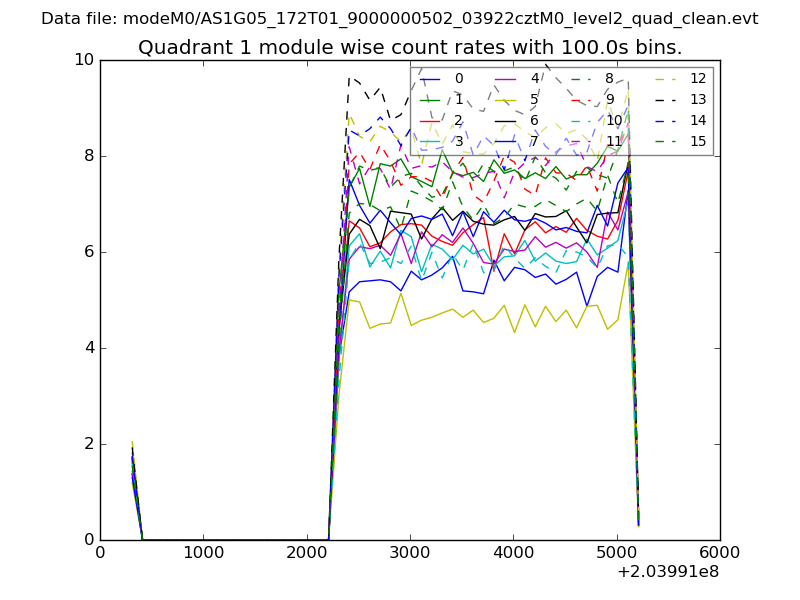
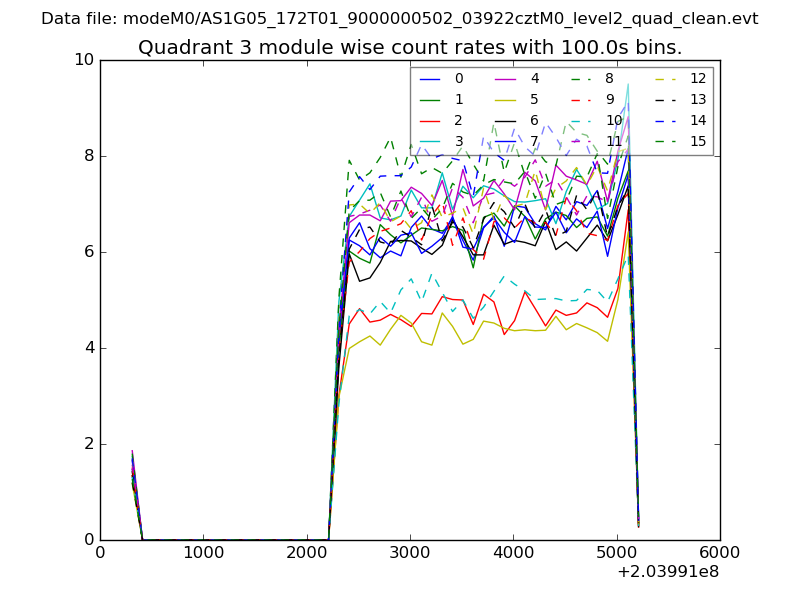
| Module-wise count rates for Quadrant A Data is divided into 100 sec bins |
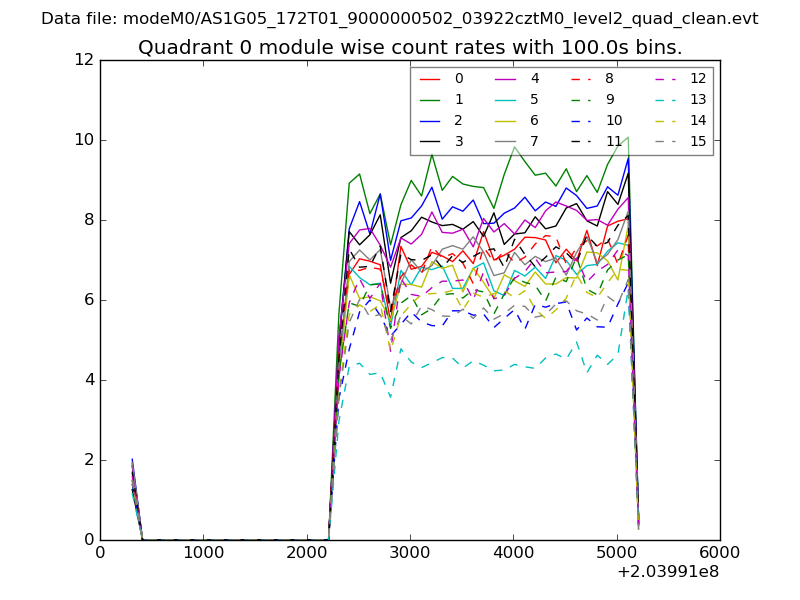 |
 |
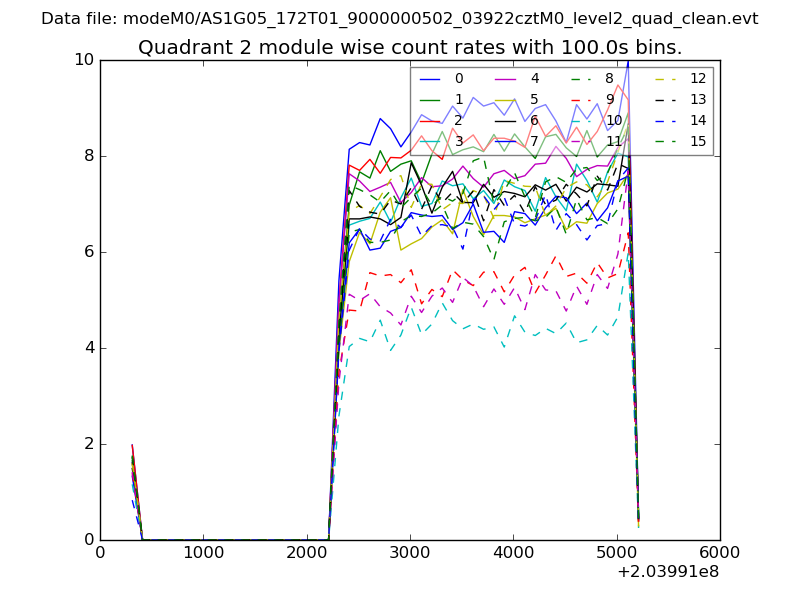
| Module-wise count rates for Quadrant B Data is divided into 100 sec bins |
 |
 |
| Module-wise count rates for Quadrant C Data is divided into 100 sec bins |
 |
 |
| Module-wise count rates for Quadrant D Data is divided into 100 sec bins |
 |
 |
| Parameter | Plot |
|---|---|
| CZT HV Monitor | 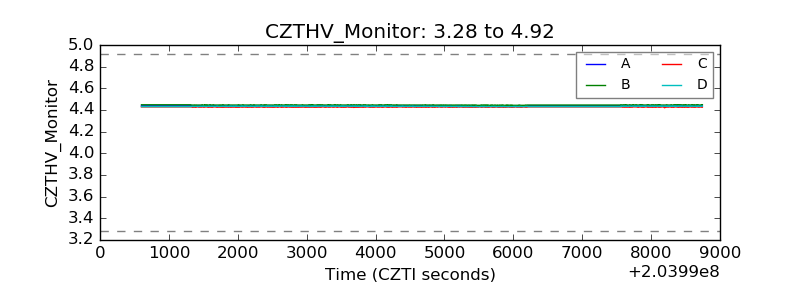 |
| D_VDD | 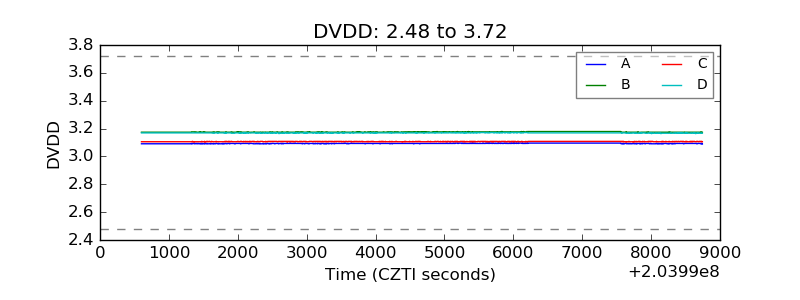 |
| Temperature 1 | 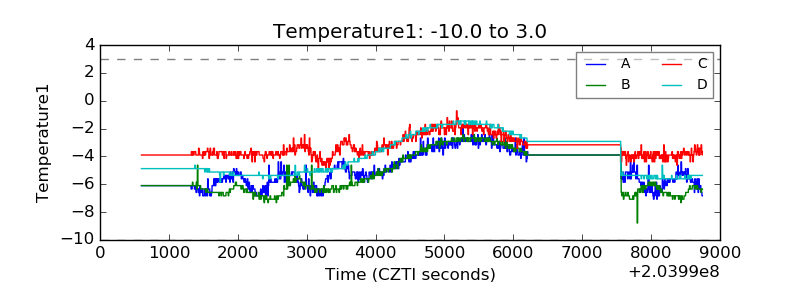 |
| Veto HV Monitor | 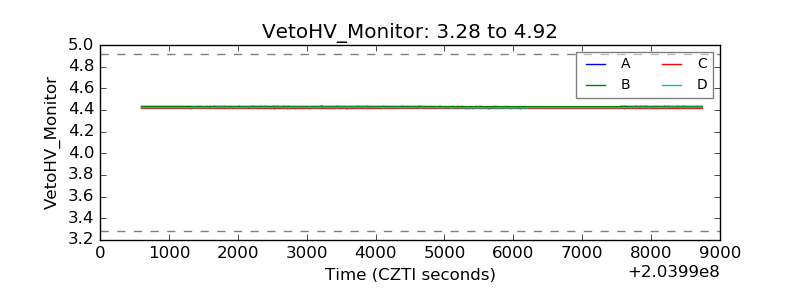 |
| Veto LLD | 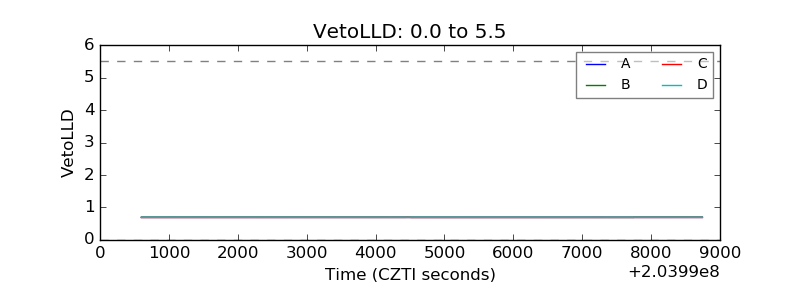 |
| Alpha Counter | 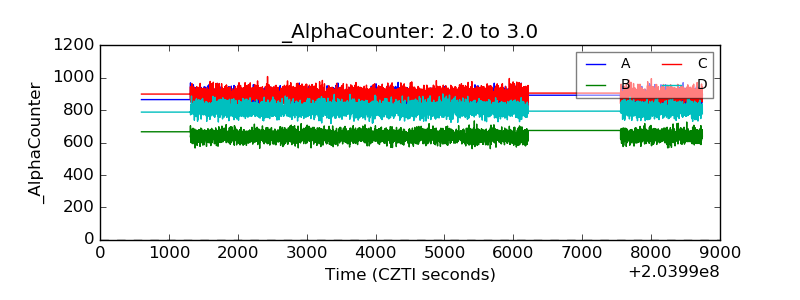 |
| _CPM_Rate | 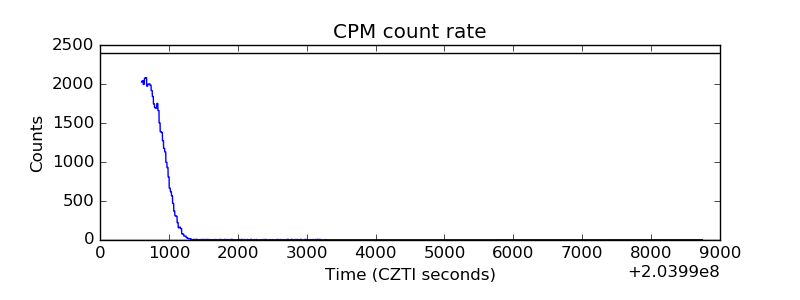 |
| CZT Counter | 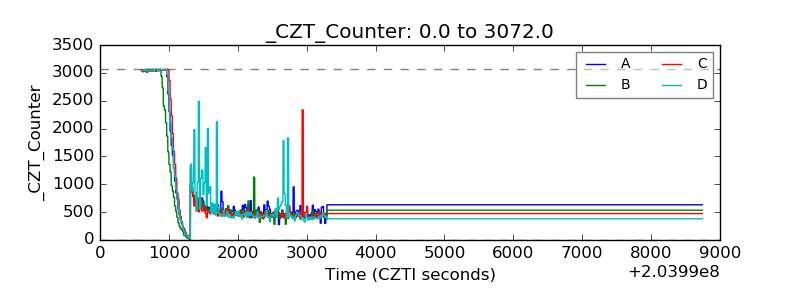 |
| +2.5 Volts monitor |  |
| +5 Volts monitor |  |
| Veto Counter | 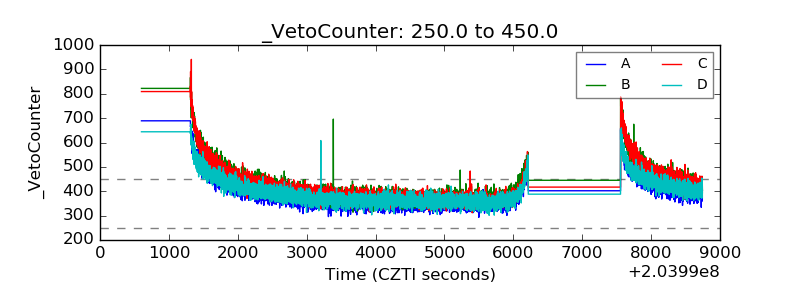 |