| Param | Original file | Final file |
|---|---|---|
| Filename | modeM0/AS1G05_172T01_9000000502_03923cztM0_level2.evt | modeM0/AS1G05_172T01_9000000502_03923cztM0_level2_quad_clean.evt |
| Size (bytes) | 422,173,440 | 63,480,960 |
| Size | 402.6 MB | 60.5 MB |
| Events in quadrant A | 3,145,938 | 375,439 |
| Events in quadrant B | 3,066,823 | 381,291 |
| Events in quadrant C | 2,883,086 | 377,904 |
| Events in quadrant D | 3,271,946 | 358,559 |
| Mode SS | |||
|---|---|---|---|
| Quadrant | BADHDUFLAG | Total packets | Discarded packets |
| A | 0 | 124 | 0 |
| B | 0 | 124 | 0 |
| C | 0 | 124 | 0 |
| D | 0 | 124 | 0 |
| Mode M9 | |||
|---|---|---|---|
| Quadrant | BADHDUFLAG | Total packets | Discarded packets |
| A | 0 | 14 | 0 |
| B | 0 | 14 | 0 |
| C | 0 | 14 | 0 |
| D | 0 | 14 | 0 |
| Mode M0 | |||
|---|---|---|---|
| Quadrant | BADHDUFLAG | Total packets | Discarded packets |
| A | 0 | 13166 | 2 |
| B | 0 | 12824 | 1 |
| C | 0 | 12598 | 1 |
| D | 0 | 13905 | 1 |
| Quadrant | Total seconds | Saturated seconds | Saturation percentage |
|---|---|---|---|
| A | 6144 | 64 | 1.041667% |
| B | 6144 | 67 | 1.090495% |
| C | 6144 | 48 | 0.781250% |
| D | 6144 | 145 | 2.360026% |
Noise dominated data is calculated using 1-second bins in cleaned event files. If a bin has >2000 counts, and if more than 50% of those come from <1% of pixels, then it is considered to be noise-dominated and hence unusable.
| Quadrant | # 1 sec bins | Bins with >0 counts | Bins with >2000 counts | High rate bins dominated by noise | Noise dominated (total time) | Noise dominated (detector-on time) | Marked lightcurve |
|---|---|---|---|---|---|---|---|
| A | 7449 | 6145 | 7 | 7 | 0.09% | 0.11% | 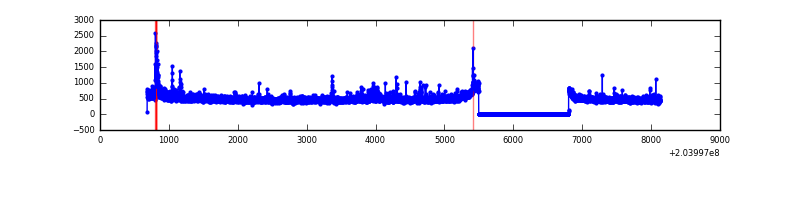 |
| B | 7449 | 6145 | 0 | 0 | 0.00% | 0.00% | 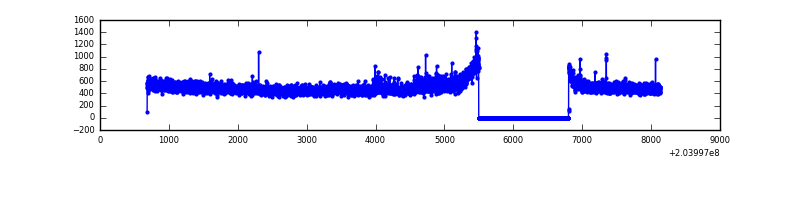 |
| C | 7449 | 6145 | 0 | 0 | 0.00% | 0.00% | 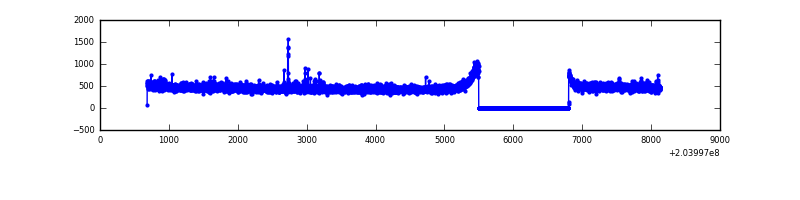 |
| D | 7449 | 6145 | 97 | 97 | 1.30% | 1.58% | 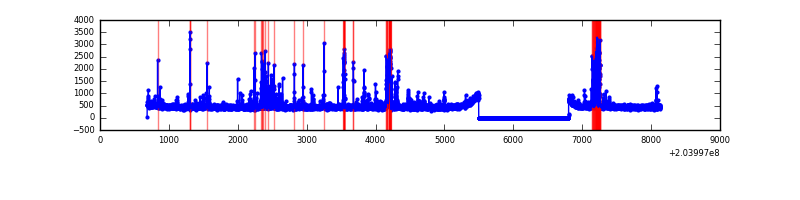 |
Top three noisy pixels from each quadrant. If the there are fewer than three noisy pixels in the level2.evt file, extra rows are filled as -1
| Pixel properties | Quadrant properties | ||||||
|---|---|---|---|---|---|---|---|
| Quadrant | DetID | PixID | Counts | Sigma | Mean | Median | Sigma |
| A | 8 | 15 | 121347 | 798.07 | 745 | 731 | 151.1 |
| A | 0 | 118 | 58134 | 379.82 | 745 | 731 | 151.1 |
| A | 0 | 50 | 48879 | 318.58 | 745 | 731 | 151.1 |
| B | 15 | 204 | 97656 | 683.41 | 754 | 738 | 141.8 |
| B | 0 | 229 | 21869 | 149.0 | 754 | 738 | 141.8 |
| B | 3 | 0 | 13803 | 92.13 | 754 | 738 | 141.8 |
| C | 10 | 65 | 21295 | 122.91 | 728 | 731 | 167.3 |
| C | 7 | 190 | 6648 | 35.37 | 728 | 731 | 167.3 |
| C | 13 | 61 | 6195 | 32.66 | 728 | 731 | 167.3 |
| D | 4 | 160 | 142182 | 820.26 | 717 | 693 | 172.5 |
| D | 2 | 232 | 125152 | 721.53 | 717 | 693 | 172.5 |
| D | 13 | 248 | 101474 | 584.26 | 717 | 693 | 172.5 |
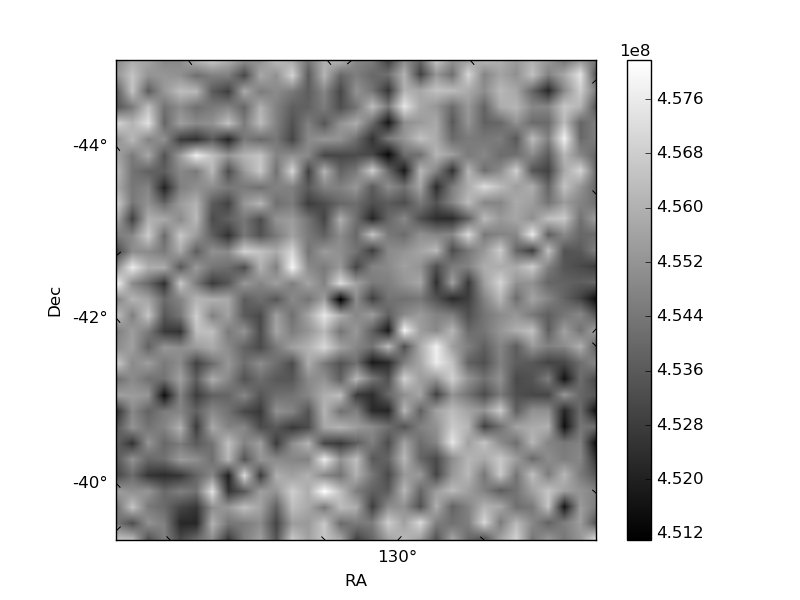
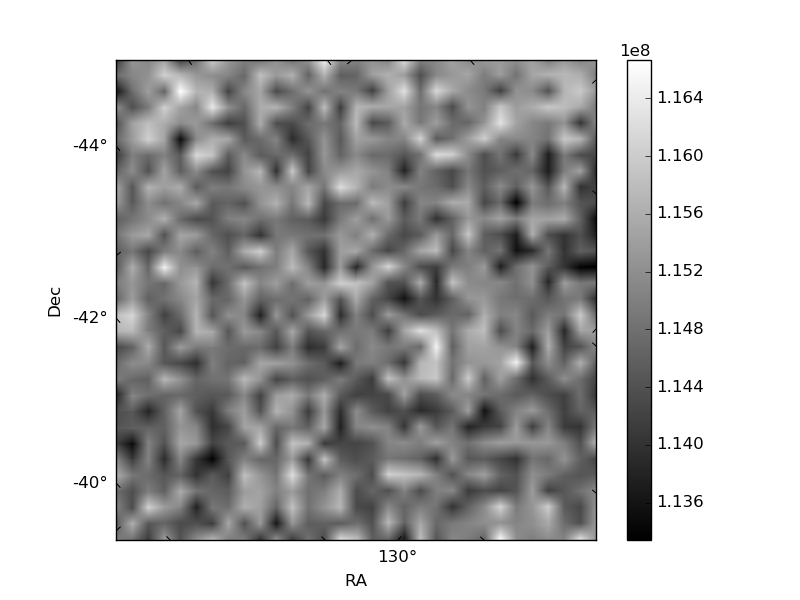
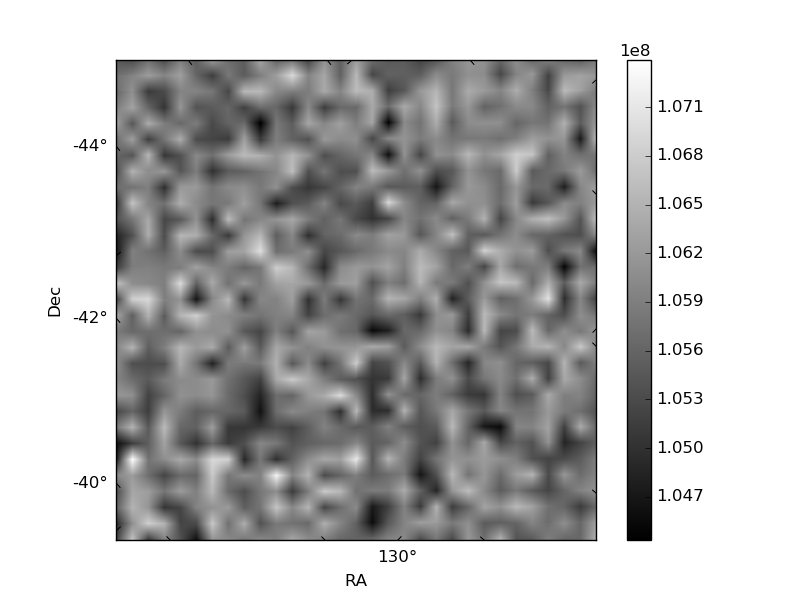
Histogram calculated using DETX and DETY for each event in the final _common_clean file
| Quadrant A | 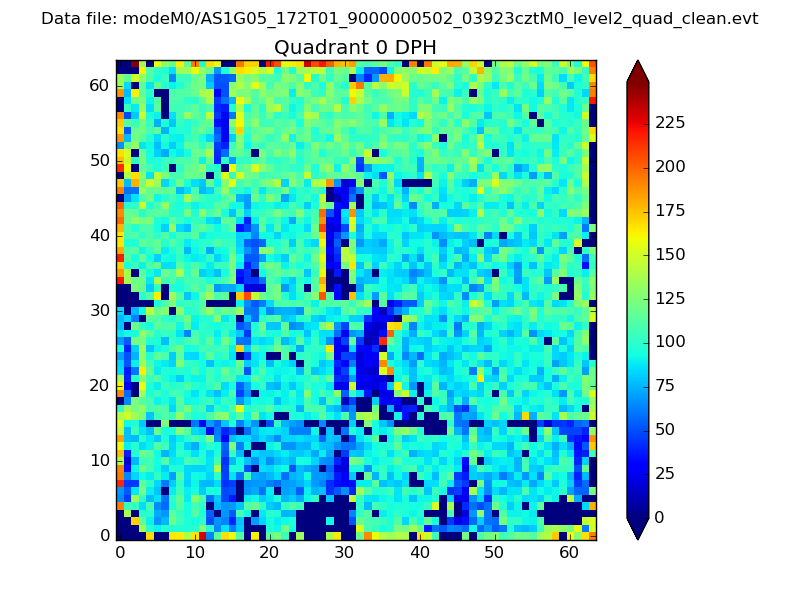 |
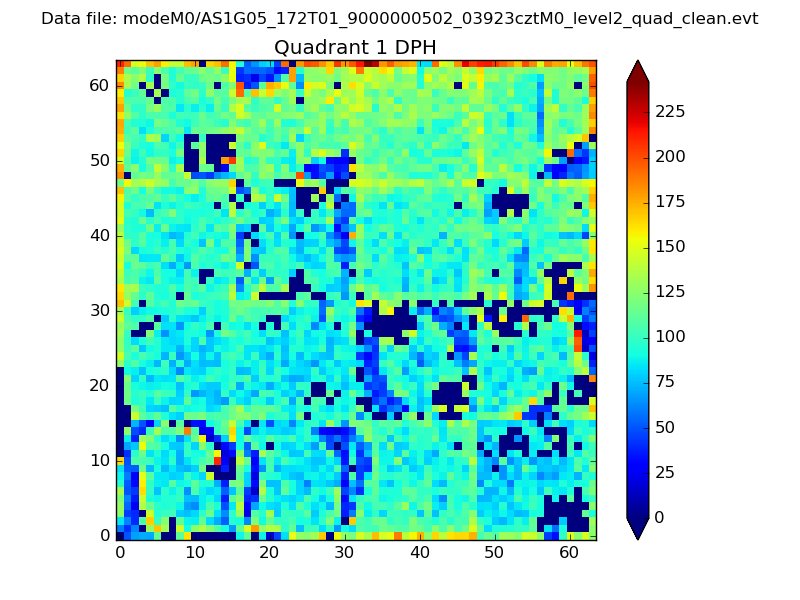 |
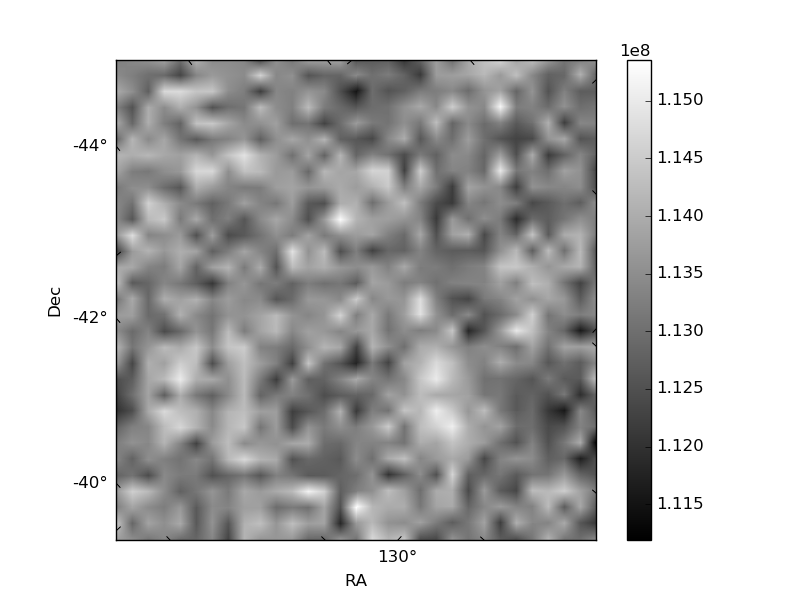
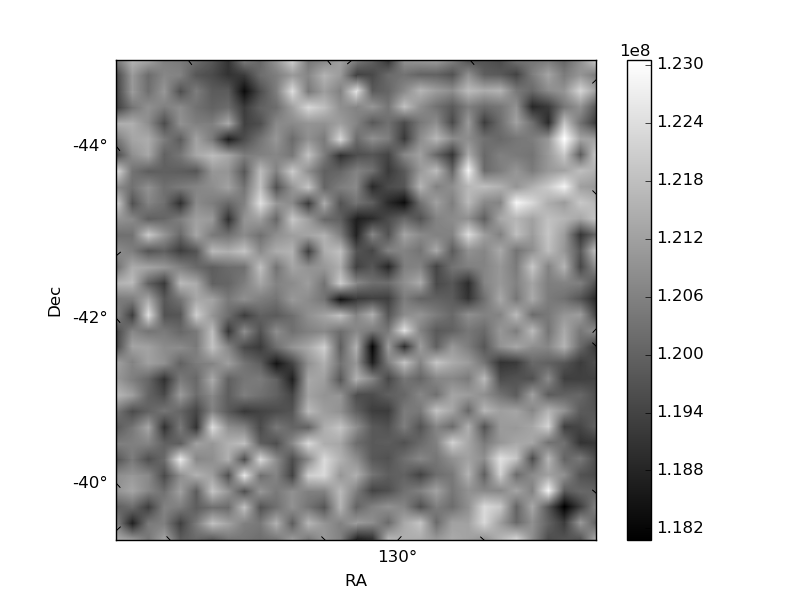
Quadrant B |
|---|---|---|---|
| Quadrant D | 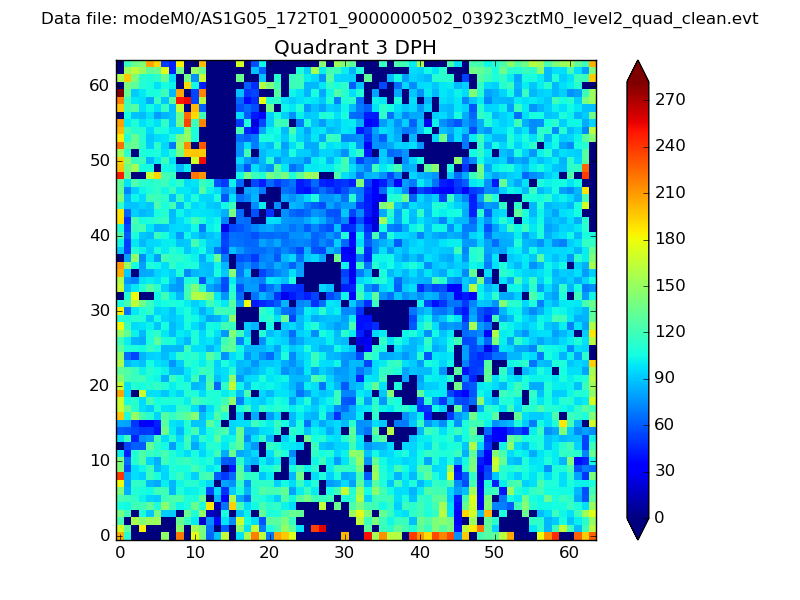 |
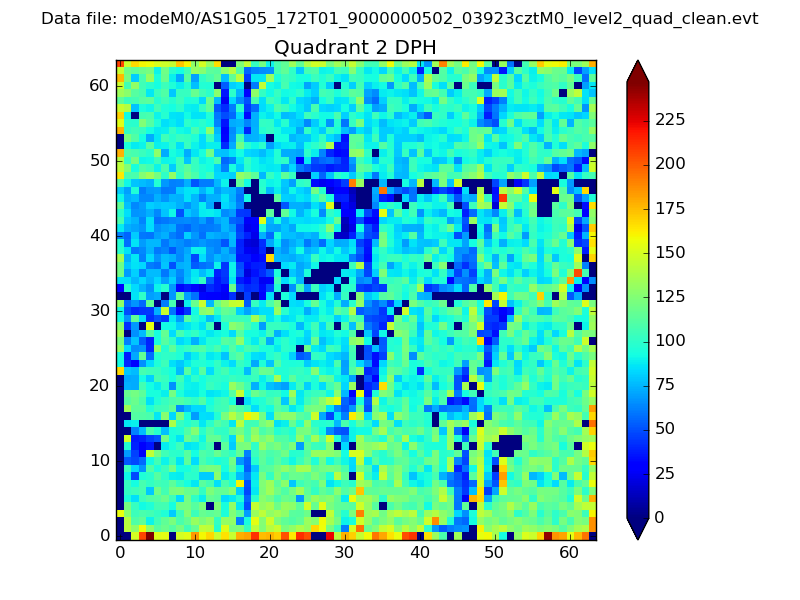 |
Quadrant C |
| Plot type | Count rate plots | Images |
|---|---|---|
| Comparison with Poisson distribution Blue bars denote a histogram of data divided into 1 sec bins. Red curve is a Poisson curve with rate = median count rate of data. |
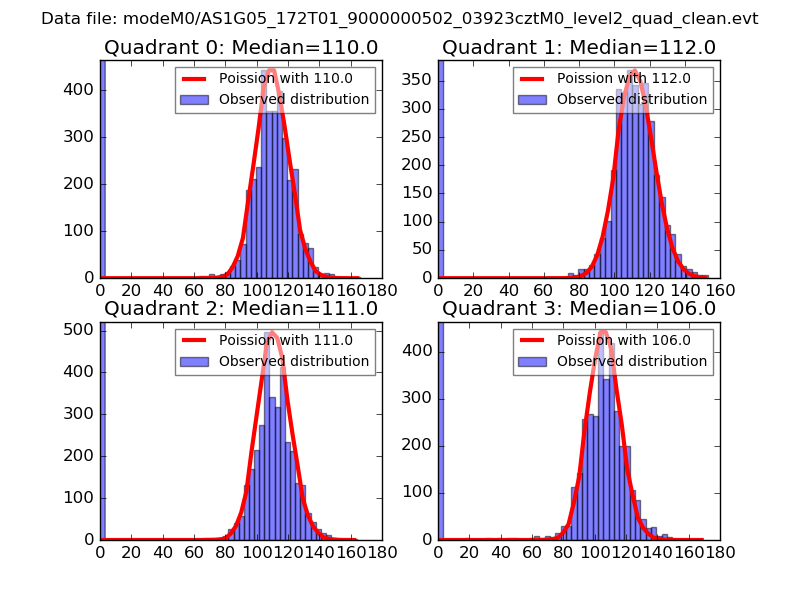 |
 |
| Quadrant-wise count rates Data is divided into 100 sec bins |
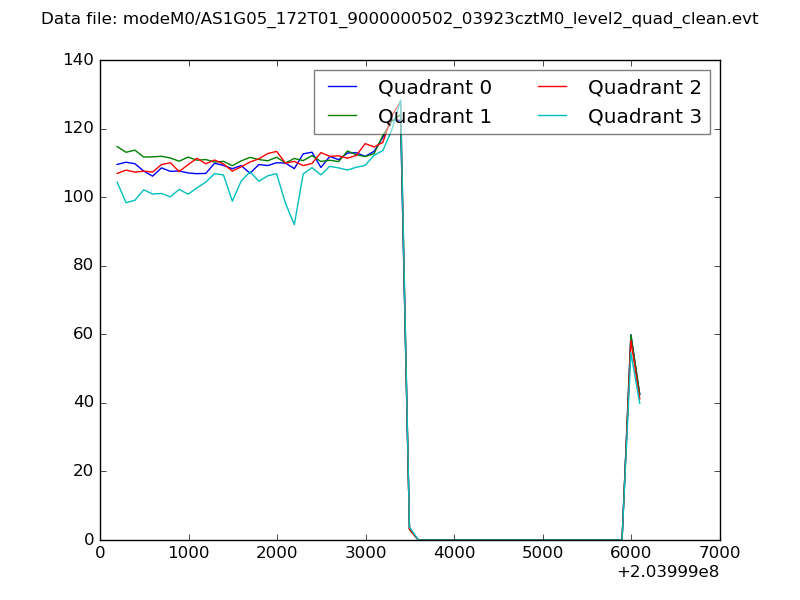 |
|
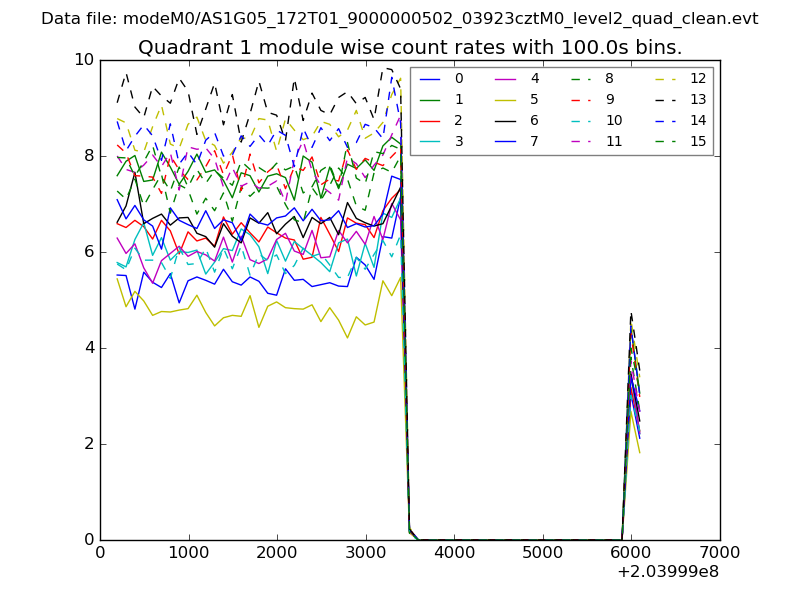
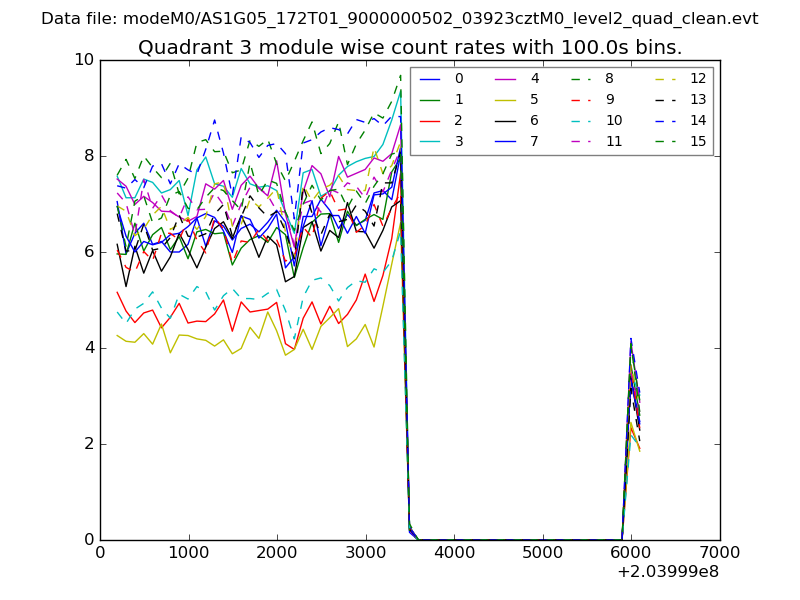
| Module-wise count rates for Quadrant A Data is divided into 100 sec bins |
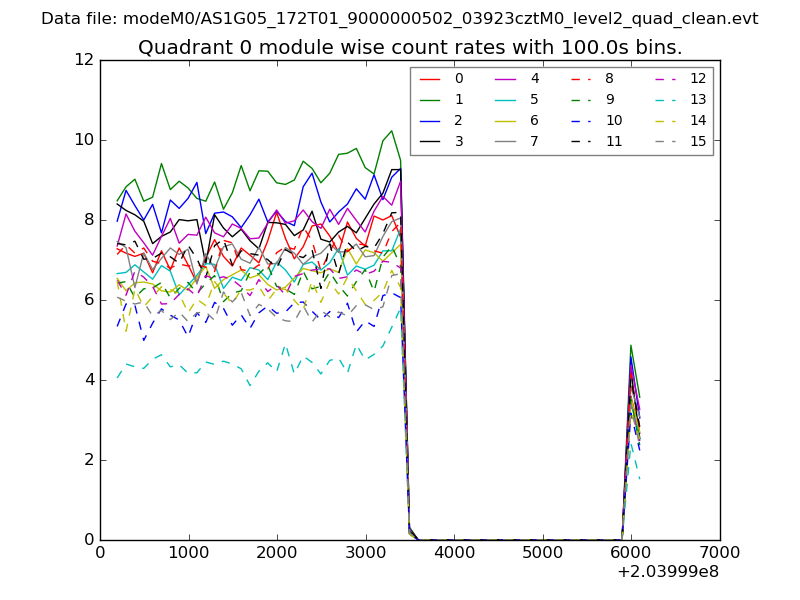 |
 |
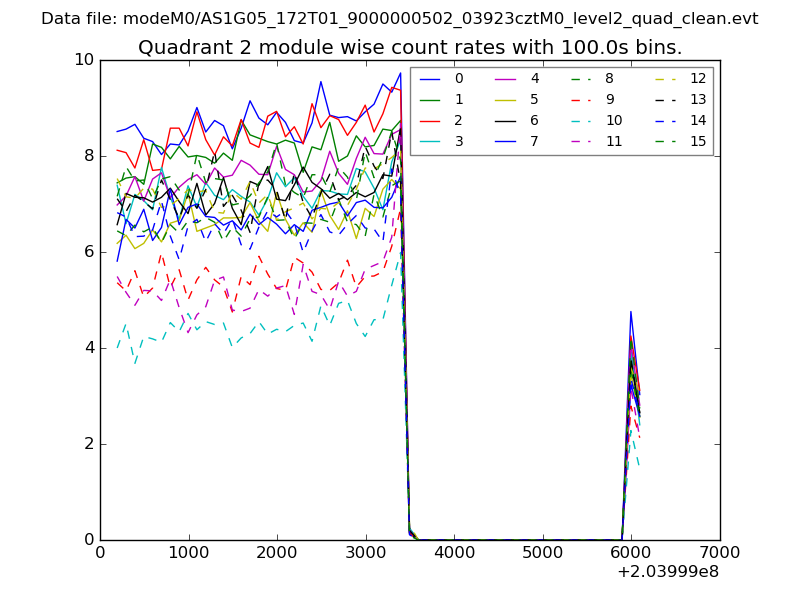
| Module-wise count rates for Quadrant B Data is divided into 100 sec bins |
 |
 |
| Module-wise count rates for Quadrant C Data is divided into 100 sec bins |
 |
 |
| Module-wise count rates for Quadrant D Data is divided into 100 sec bins |
 |
 |
| Parameter | Plot |
|---|---|
| CZT HV Monitor | 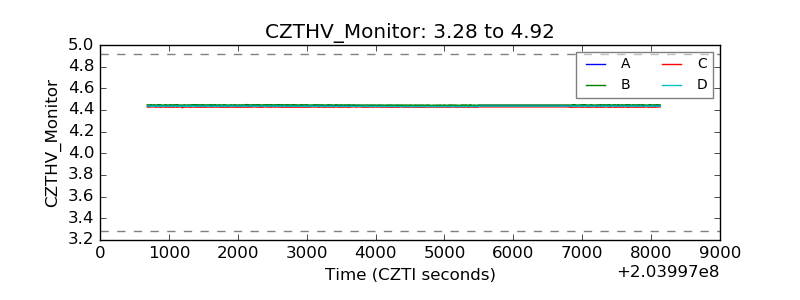 |
| D_VDD | 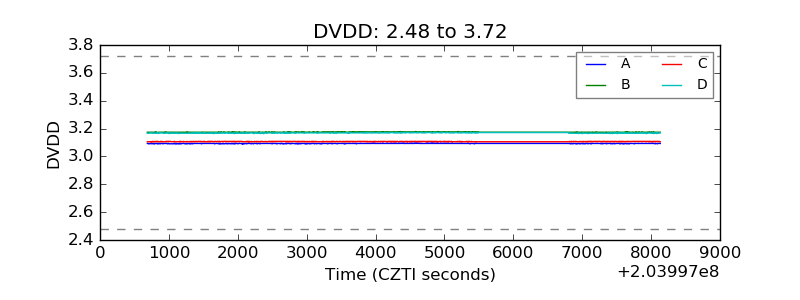 |
| Temperature 1 | 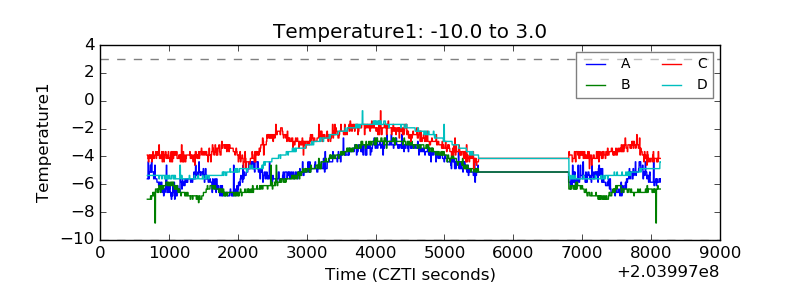 |
| Veto HV Monitor | 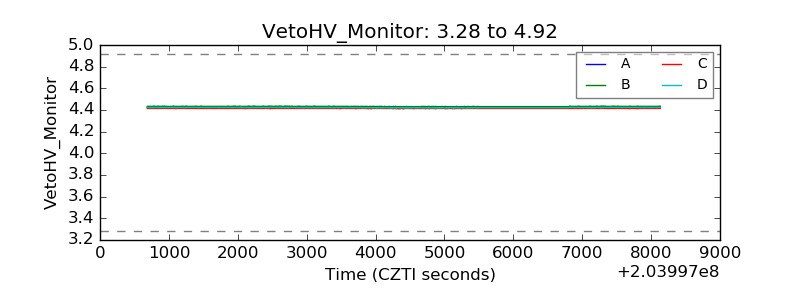 |
| Veto LLD | 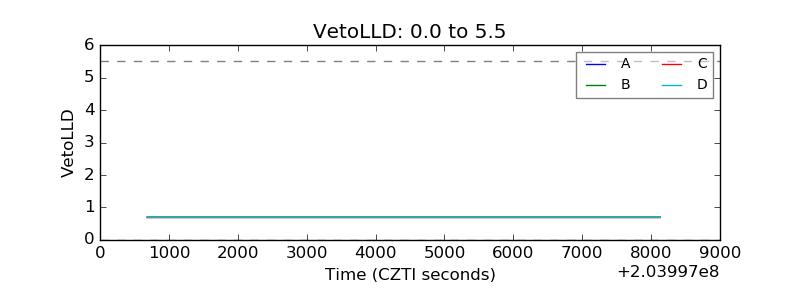 |
| Alpha Counter | 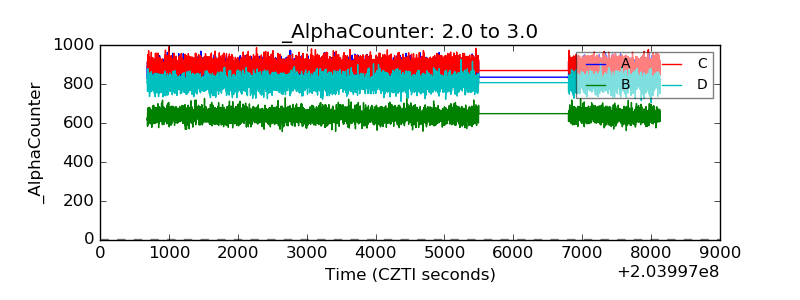 |
| _CPM_Rate | 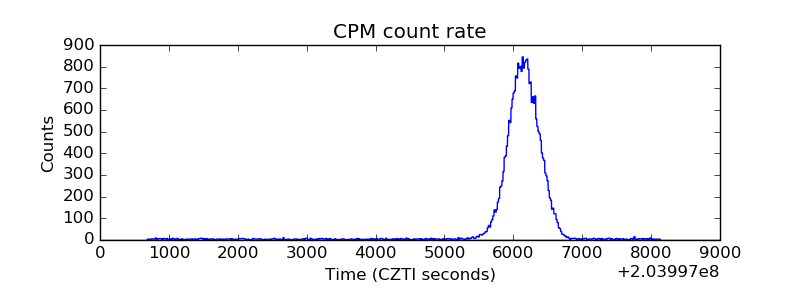 |
| CZT Counter | 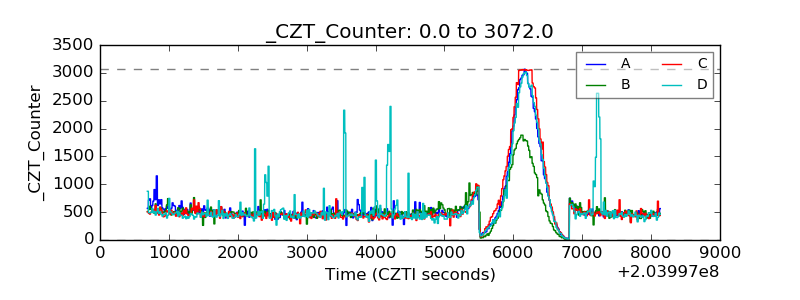 |
| +2.5 Volts monitor |  |
| +5 Volts monitor |  |
| Veto Counter | 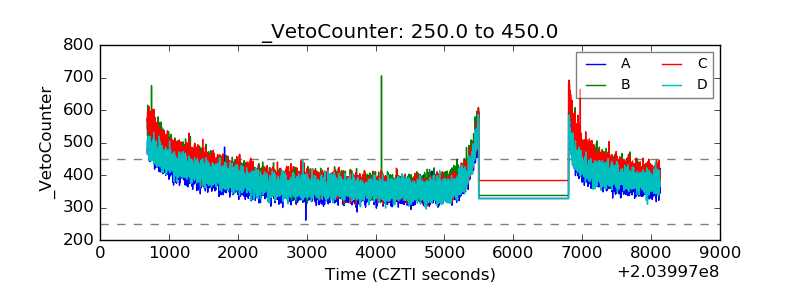 |