| Param | Original file | Final file |
|---|---|---|
| Filename | modeM0/AS1G05_172T01_9000000502_03924cztM0_level2.evt | modeM0/AS1G05_172T01_9000000502_03924cztM0_level2_quad_clean.evt |
| Size (bytes) | 438,033,600 | 78,137,280 |
| Size | 417.7 MB | 74.5 MB |
| Events in quadrant A | 3,175,385 | 478,132 |
| Events in quadrant B | 3,302,776 | 485,142 |
| Events in quadrant C | 3,048,668 | 480,389 |
| Events in quadrant D | 3,288,759 | 460,952 |
| Mode SS | |||
|---|---|---|---|
| Quadrant | BADHDUFLAG | Total packets | Discarded packets |
| A | 0 | 134 | 0 |
| B | 0 | 134 | 0 |
| C | 0 | 134 | 0 |
| D | 0 | 134 | 0 |
| Mode M9 | |||
|---|---|---|---|
| Quadrant | BADHDUFLAG | Total packets | Discarded packets |
| A | 0 | 11 | 0 |
| B | 0 | 11 | 0 |
| C | 0 | 11 | 0 |
| D | 0 | 11 | 0 |
| Mode M0 | |||
|---|---|---|---|
| Quadrant | BADHDUFLAG | Total packets | Discarded packets |
| A | 0 | 13891 | 3 |
| B | 0 | 13934 | 2 |
| C | 0 | 13606 | 2 |
| D | 0 | 14422 | 2 |
| Quadrant | Total seconds | Saturated seconds | Saturation percentage |
|---|---|---|---|
| A | 6620 | 115 | 1.737160% |
| B | 6620 | 133 | 2.009063% |
| C | 6620 | 98 | 1.480363% |
| D | 6620 | 143 | 2.160121% |
Noise dominated data is calculated using 1-second bins in cleaned event files. If a bin has >2000 counts, and if more than 50% of those come from <1% of pixels, then it is considered to be noise-dominated and hence unusable.
| Quadrant | # 1 sec bins | Bins with >0 counts | Bins with >2000 counts | High rate bins dominated by noise | Noise dominated (total time) | Noise dominated (detector-on time) | Marked lightcurve |
|---|---|---|---|---|---|---|---|
| A | 7705 | 6621 | 13 | 13 | 0.17% | 0.20% | 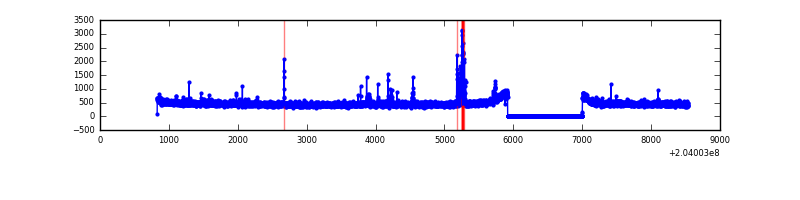 |
| B | 7705 | 6621 | 7 | 7 | 0.09% | 0.11% | 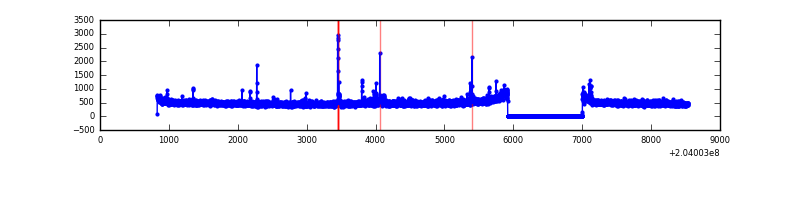 |
| C | 7705 | 6621 | 0 | 0 | 0.00% | 0.00% | 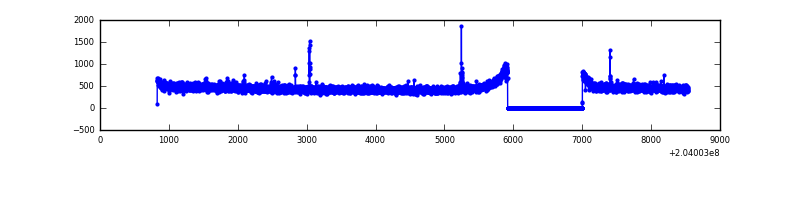 |
| D | 7705 | 6621 | 56 | 56 | 0.73% | 0.85% | 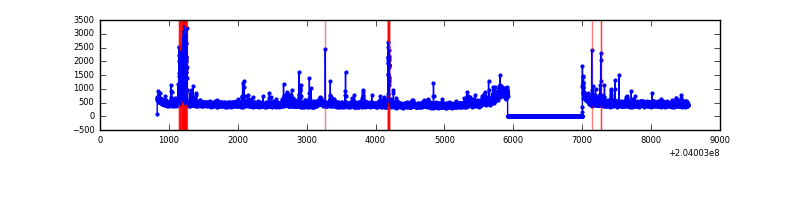 |
Top three noisy pixels from each quadrant. If the there are fewer than three noisy pixels in the level2.evt file, extra rows are filled as -1
| Pixel properties | Quadrant properties | ||||||
|---|---|---|---|---|---|---|---|
| Quadrant | DetID | PixID | Counts | Sigma | Mean | Median | Sigma |
| A | 0 | 118 | 116890 | 721.13 | 787 | 769 | 161.0 |
| A | 0 | 226 | 18256 | 108.6 | 787 | 769 | 161.0 |
| A | 12 | 194 | 8213 | 46.23 | 787 | 769 | 161.0 |
| B | 15 | 204 | 104254 | 678.99 | 799 | 781 | 152.4 |
| B | 3 | 0 | 28913 | 184.6 | 799 | 781 | 152.4 |
| B | 0 | 229 | 23096 | 146.43 | 799 | 781 | 152.4 |
| C | 10 | 65 | 18439 | 99.03 | 771 | 774 | 178.4 |
| C | 12 | 4 | 11138 | 58.1 | 771 | 774 | 178.4 |
| C | 13 | 61 | 6455 | 31.85 | 771 | 774 | 178.4 |
| D | 4 | 160 | 145991 | 804.05 | 761 | 740 | 180.6 |
| D | 2 | 232 | 76159 | 417.49 | 761 | 740 | 180.6 |
| D | 13 | 239 | 51966 | 283.57 | 761 | 740 | 180.6 |
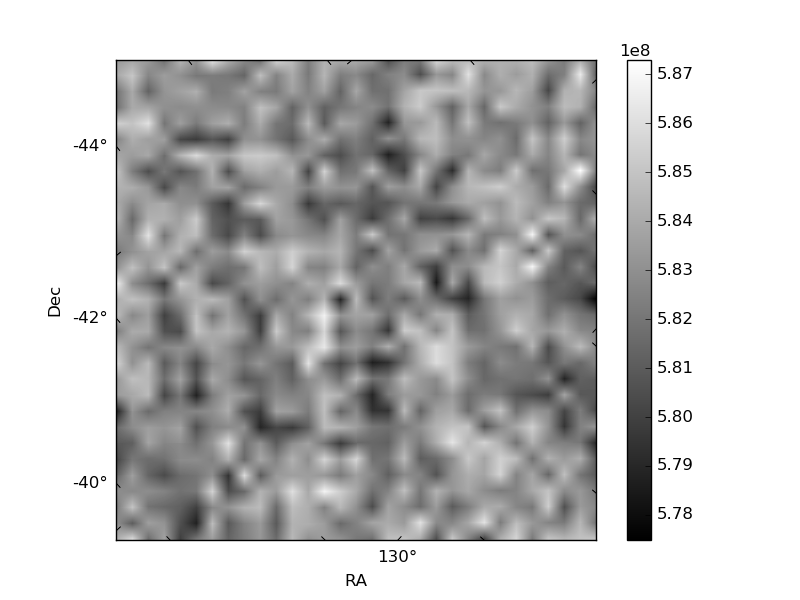
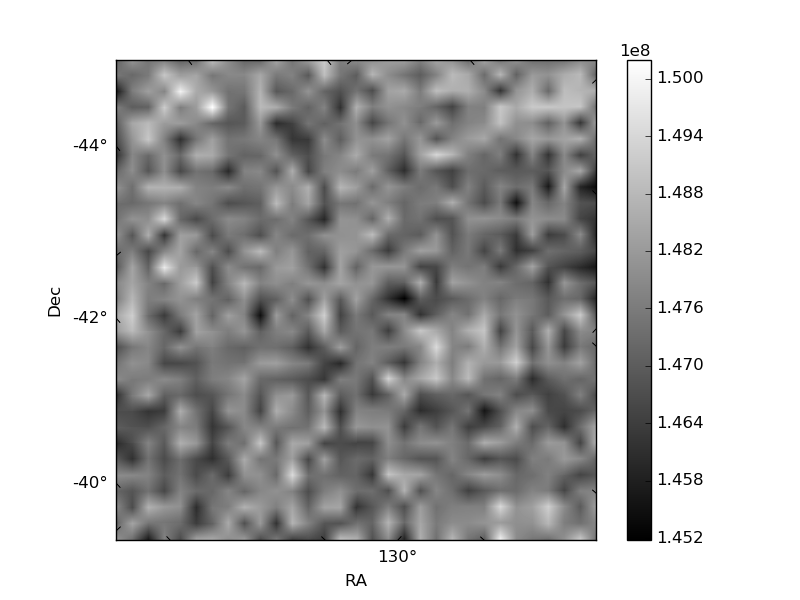
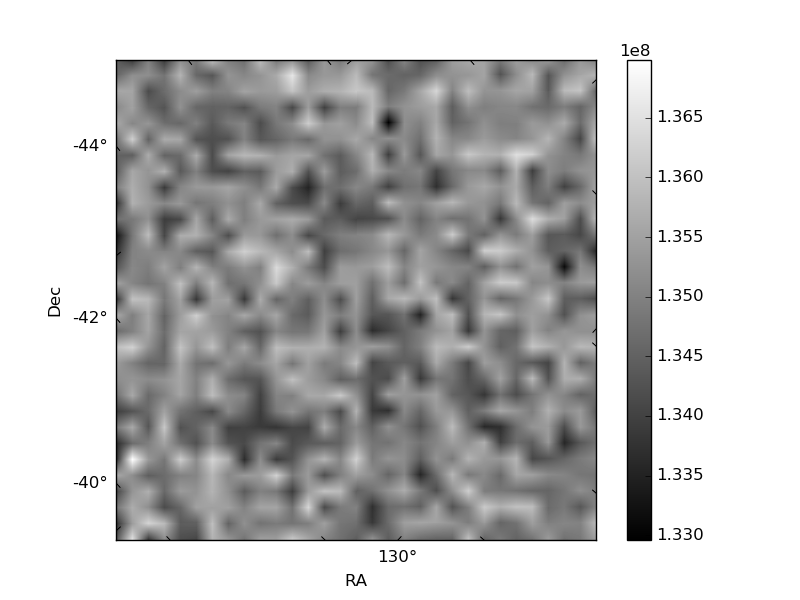
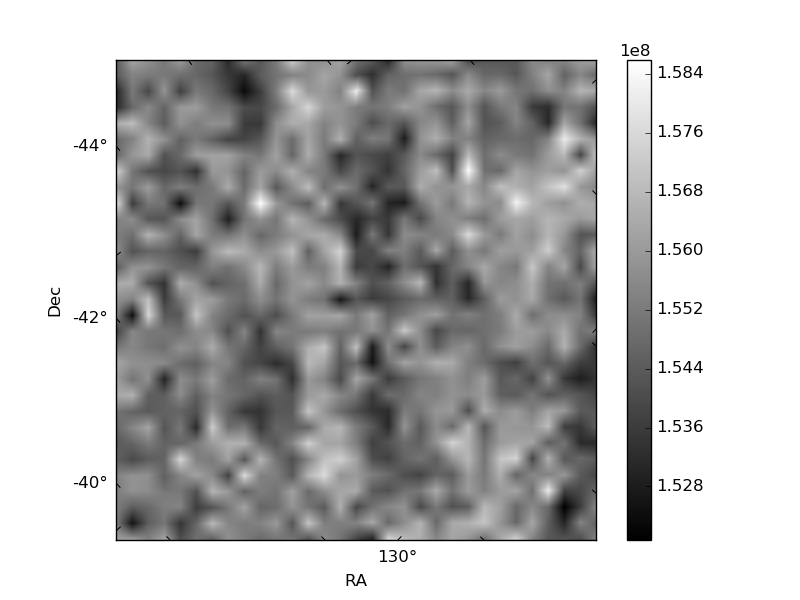
Histogram calculated using DETX and DETY for each event in the final _common_clean file
| Quadrant A | 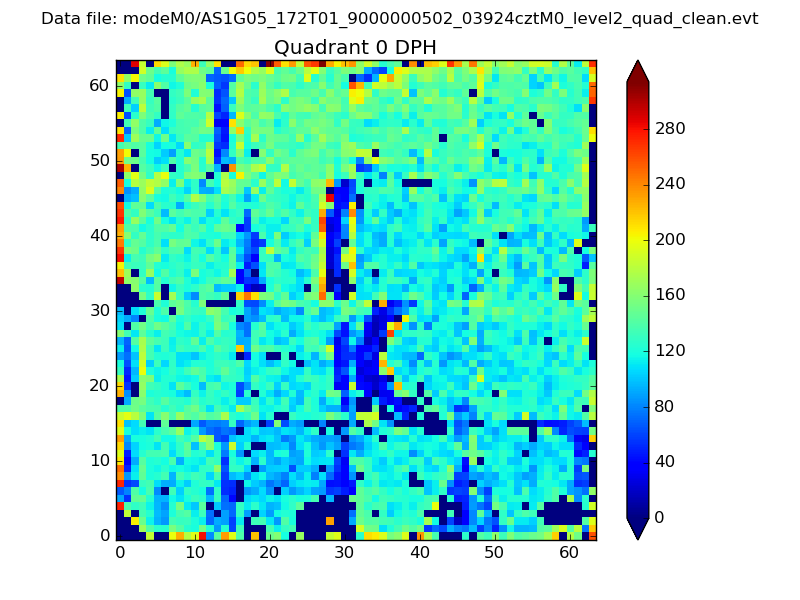 |
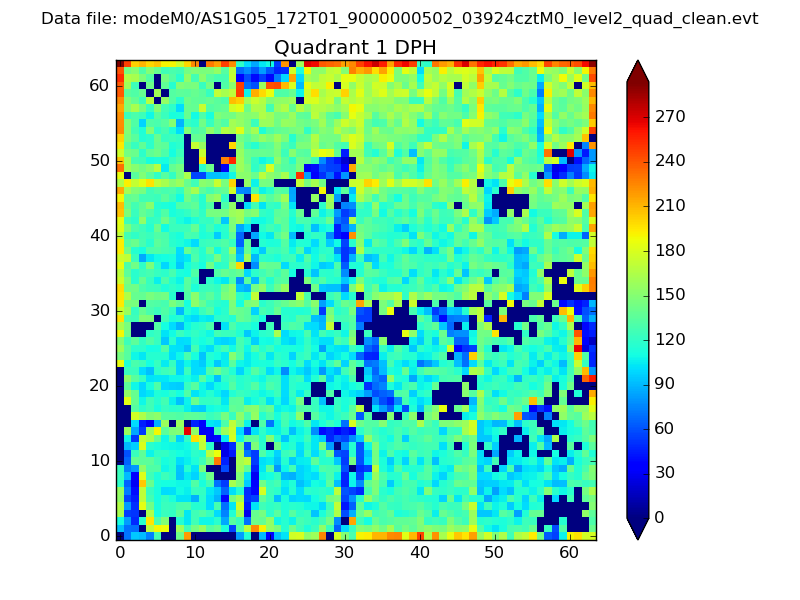 |
Quadrant B |
|---|---|---|---|
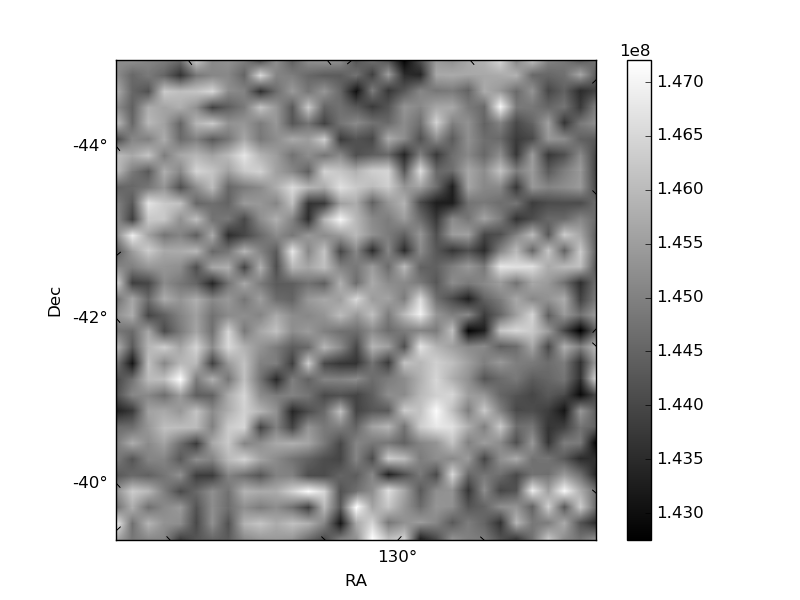
| Quadrant D | 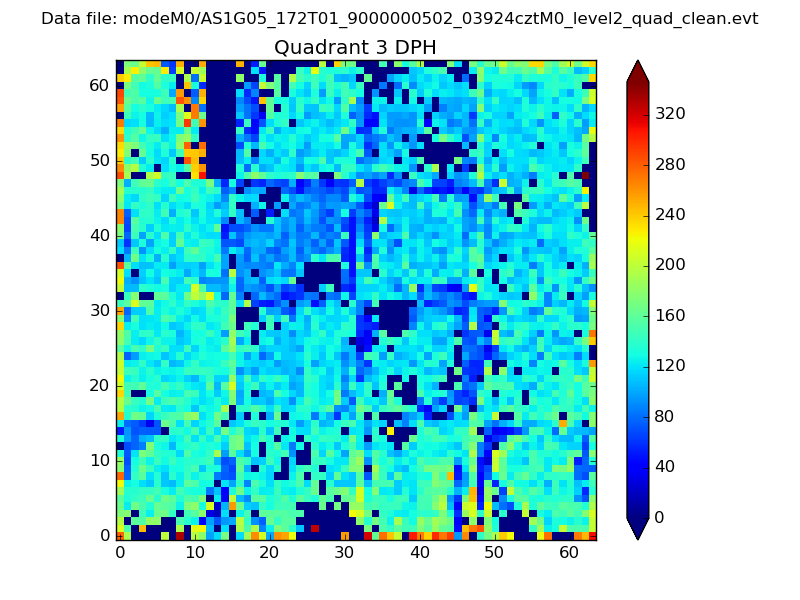 |
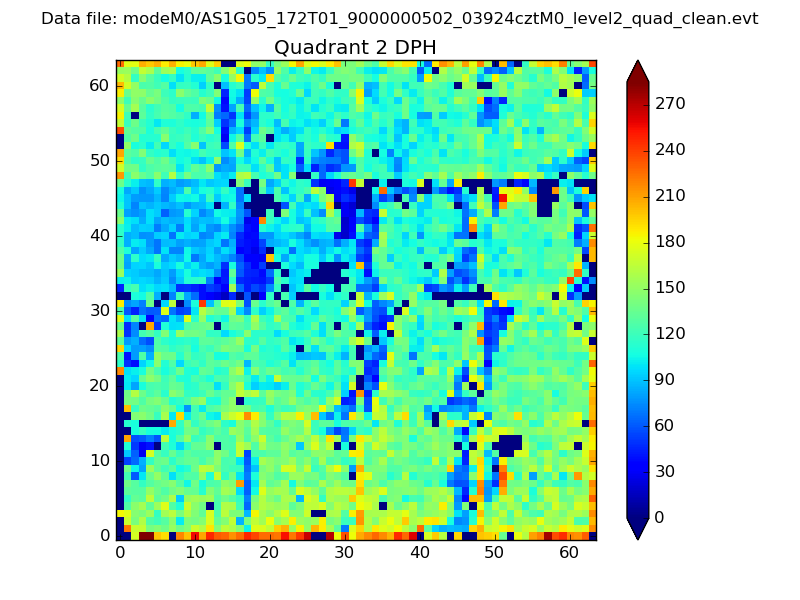 |
Quadrant C |
| Plot type | Count rate plots | Images |
|---|---|---|
| Comparison with Poisson distribution Blue bars denote a histogram of data divided into 1 sec bins. Red curve is a Poisson curve with rate = median count rate of data. |
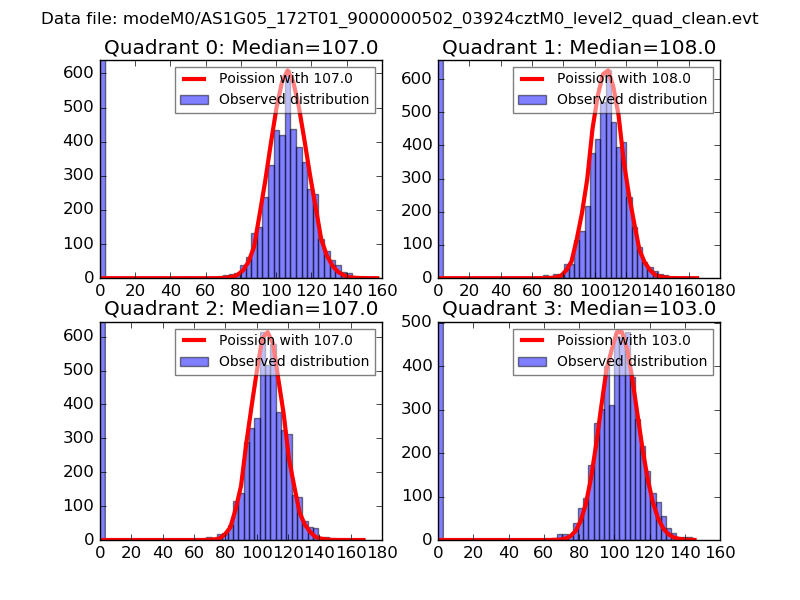 |
 |
| Quadrant-wise count rates Data is divided into 100 sec bins |
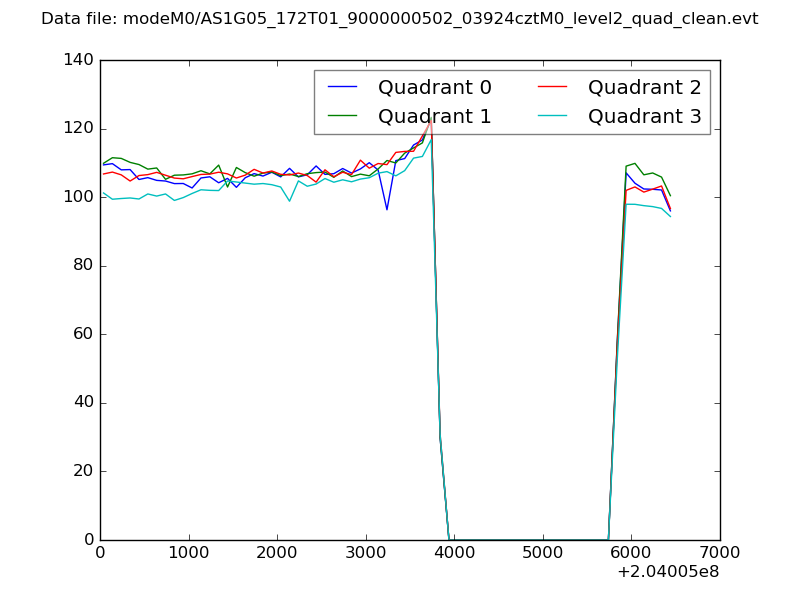 |
|
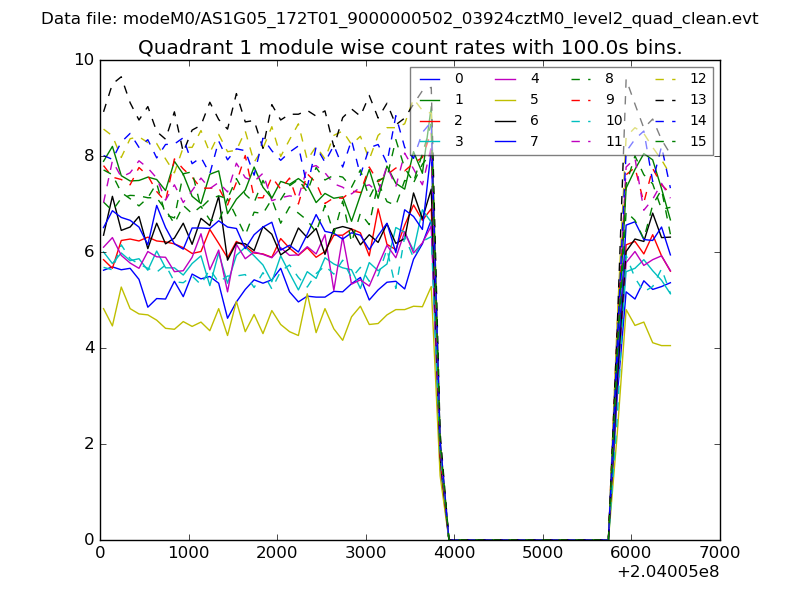
| Module-wise count rates for Quadrant A Data is divided into 100 sec bins |
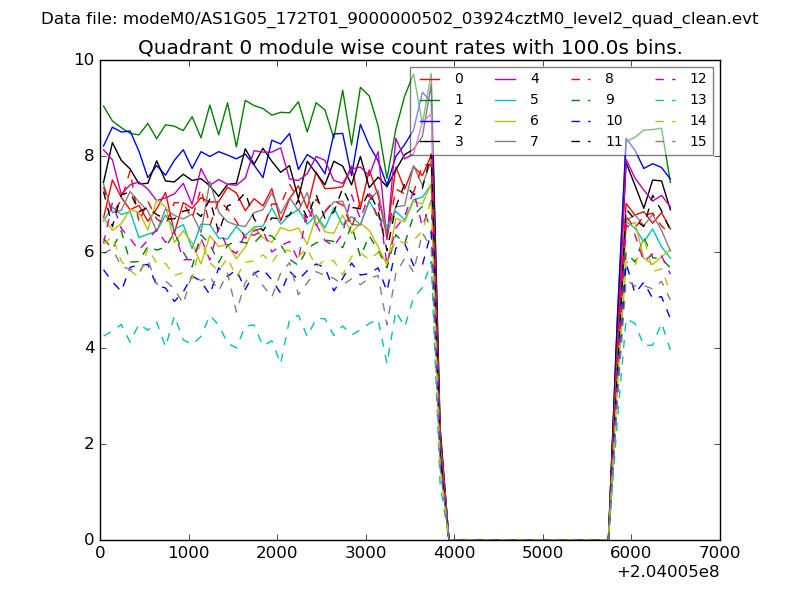 |
 |
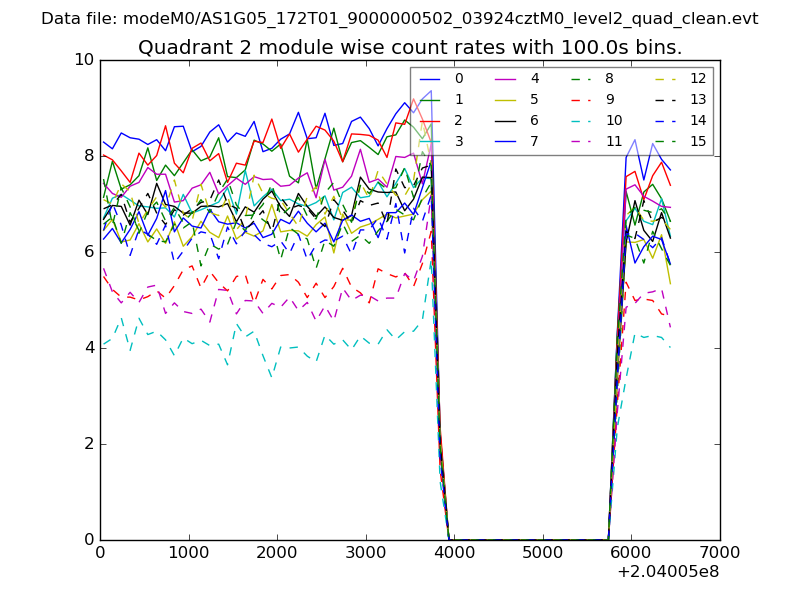
| Module-wise count rates for Quadrant B Data is divided into 100 sec bins |
 |
 |
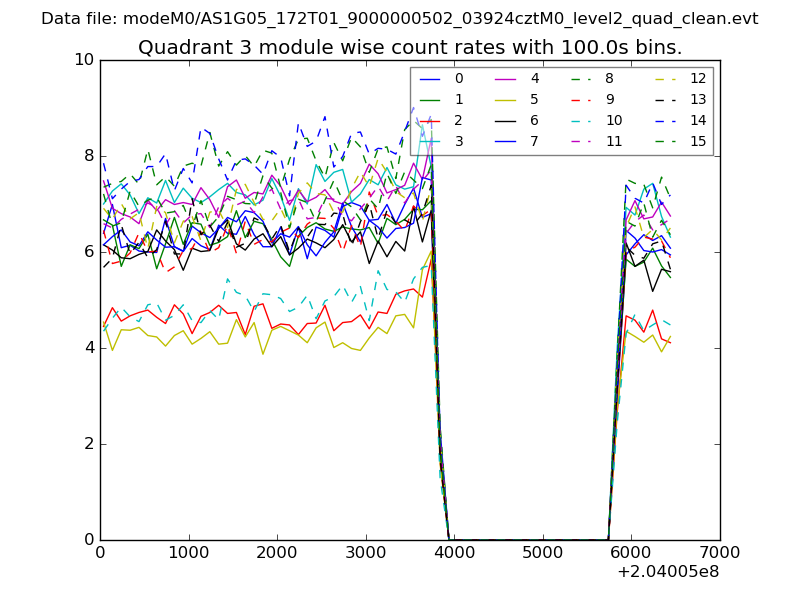
| Module-wise count rates for Quadrant C Data is divided into 100 sec bins |
 |
 |
| Module-wise count rates for Quadrant D Data is divided into 100 sec bins |
 |
 |
| Parameter | Plot |
|---|---|
| CZT HV Monitor | 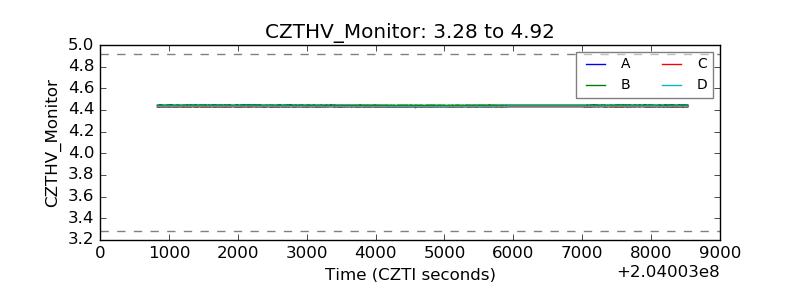 |
| D_VDD | 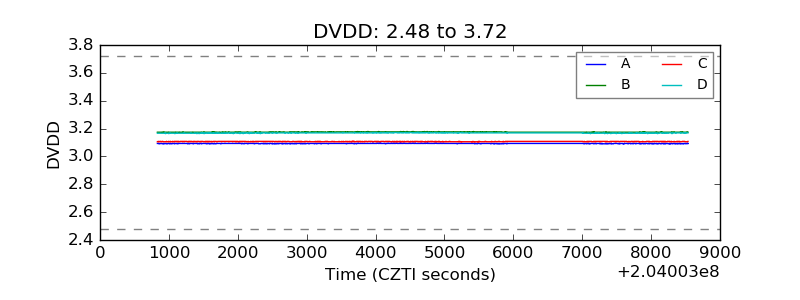 |
| Temperature 1 | 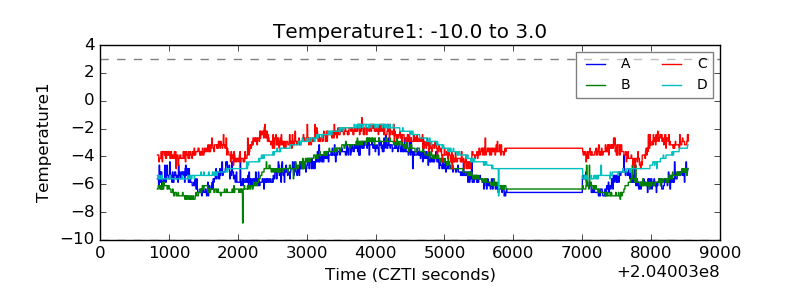 |
| Veto HV Monitor | 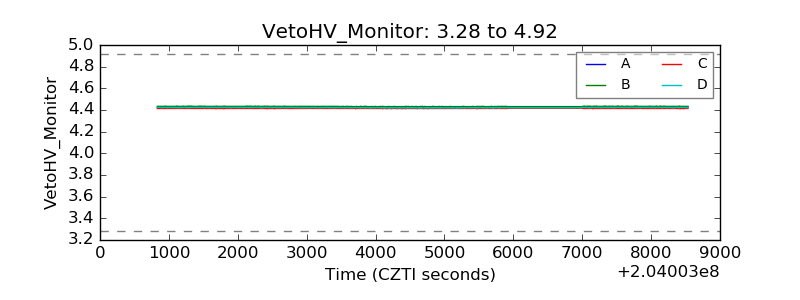 |
| Veto LLD | 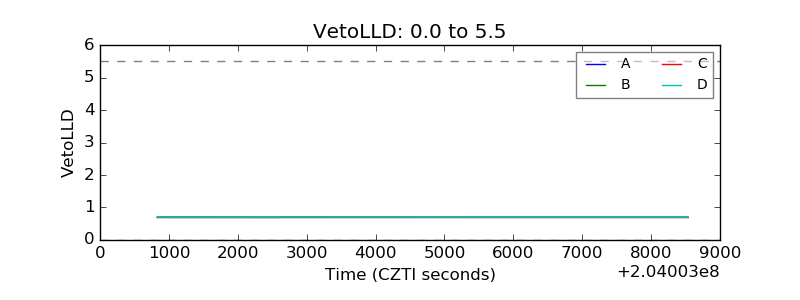 |
| Alpha Counter | 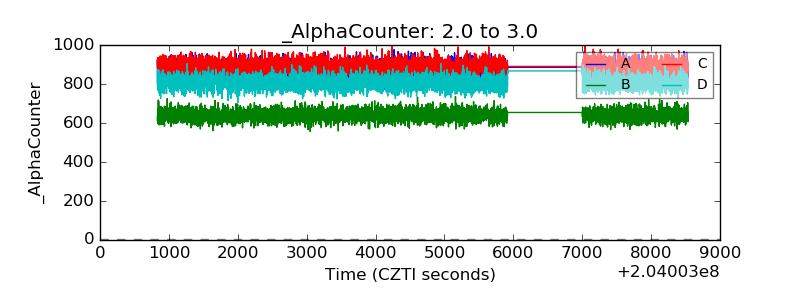 |
| _CPM_Rate | 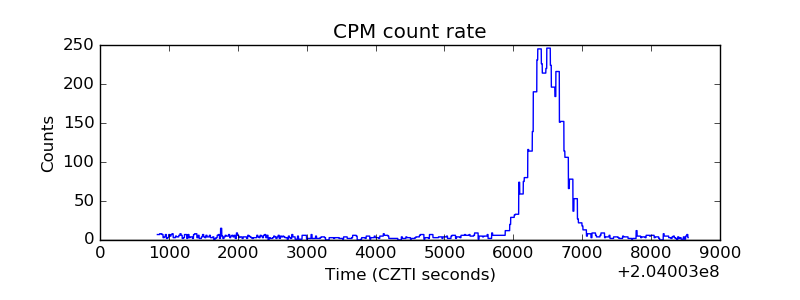 |
| CZT Counter | 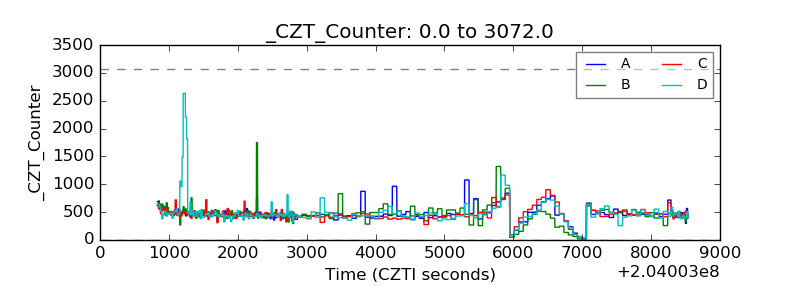 |
| +2.5 Volts monitor | 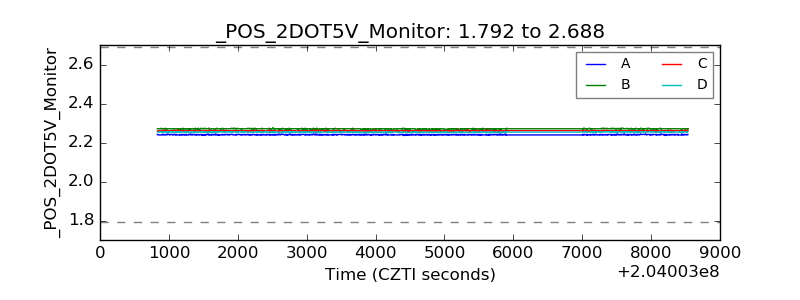 |
| +5 Volts monitor | 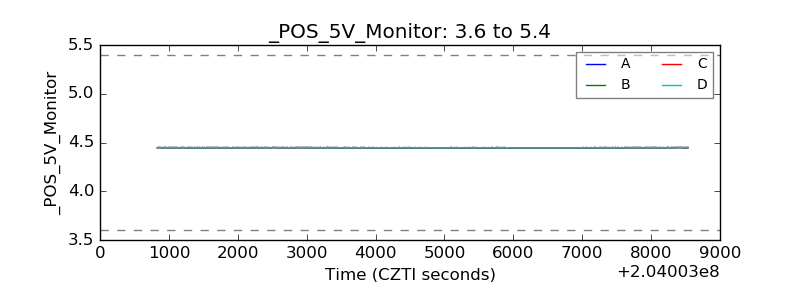 |
| Veto Counter | 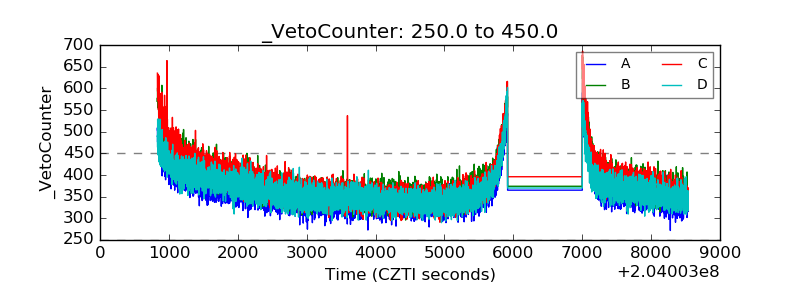 |