| Param | Original file | Final file |
|---|---|---|
| Filename | modeM0/AS1G05_172T01_9000000502_03925cztM0_level2.evt | modeM0/AS1G05_172T01_9000000502_03925cztM0_level2_quad_clean.evt |
| Size (bytes) | 444,165,120 | 80,447,040 |
| Size | 423.6 MB | 76.7 MB |
| Events in quadrant A | 3,215,566 | 493,617 |
| Events in quadrant B | 3,313,493 | 499,313 |
| Events in quadrant C | 3,059,068 | 491,325 |
| Events in quadrant D | 3,396,916 | 474,003 |
| Mode SS | |||
|---|---|---|---|
| Quadrant | BADHDUFLAG | Total packets | Discarded packets |
| A | 0 | 140 | 0 |
| B | 0 | 140 | 0 |
| C | 0 | 140 | 0 |
| D | 0 | 140 | 0 |
| Mode M9 | |||
|---|---|---|---|
| Quadrant | BADHDUFLAG | Total packets | Discarded packets |
| A | 0 | 7 | 0 |
| B | 0 | 7 | 0 |
| C | 0 | 7 | 0 |
| D | 0 | 7 | 0 |
| Mode M0 | |||
|---|---|---|---|
| Quadrant | BADHDUFLAG | Total packets | Discarded packets |
| A | 0 | 14304 | 2 |
| B | 0 | 14189 | 1 |
| C | 0 | 14030 | 1 |
| D | 0 | 14910 | 1 |
| Quadrant | Total seconds | Saturated seconds | Saturation percentage |
|---|---|---|---|
| A | 6852 | 155 | 2.262113% |
| B | 6852 | 148 | 2.159953% |
| C | 6852 | 130 | 1.897256% |
| D | 6852 | 140 | 2.043199% |
Noise dominated data is calculated using 1-second bins in cleaned event files. If a bin has >2000 counts, and if more than 50% of those come from <1% of pixels, then it is considered to be noise-dominated and hence unusable.
| Quadrant | # 1 sec bins | Bins with >0 counts | Bins with >2000 counts | High rate bins dominated by noise | Noise dominated (total time) | Noise dominated (detector-on time) | Marked lightcurve |
|---|---|---|---|---|---|---|---|
| A | 7557 | 6853 | 15 | 15 | 0.20% | 0.22% | 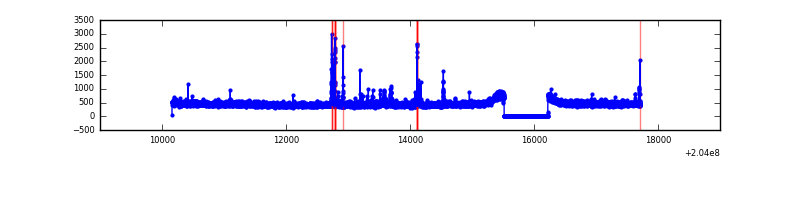 |
| B | 7557 | 6853 | 0 | 0 | 0.00% | 0.00% | 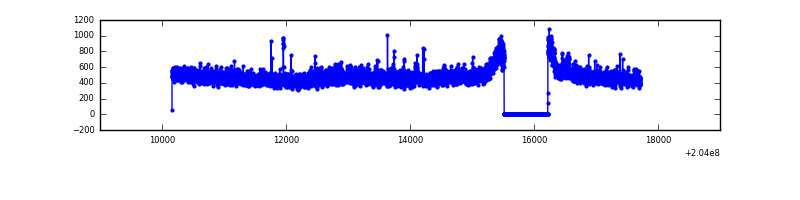 |
| C | 7557 | 6853 | 0 | 0 | 0.00% | 0.00% | 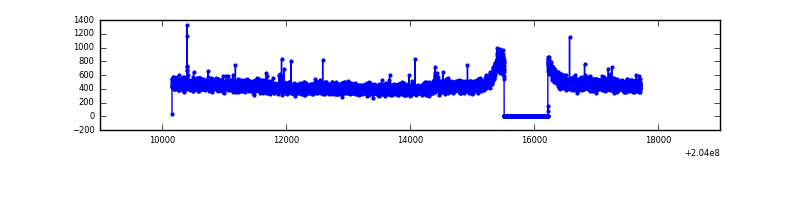 |
| D | 7557 | 6853 | 16 | 16 | 0.21% | 0.23% | 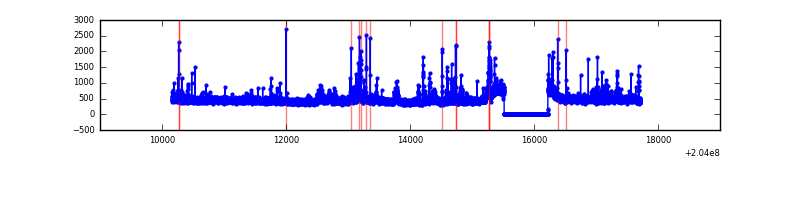 |
Top three noisy pixels from each quadrant. If the there are fewer than three noisy pixels in the level2.evt file, extra rows are filled as -1
| Pixel properties | Quadrant properties | ||||||
|---|---|---|---|---|---|---|---|
| Quadrant | DetID | PixID | Counts | Sigma | Mean | Median | Sigma |
| A | 0 | 118 | 118103 | 719.36 | 794 | 775 | 163.1 |
| A | 0 | 226 | 18473 | 108.51 | 794 | 775 | 163.1 |
| A | 2 | 79 | 11833 | 67.8 | 794 | 775 | 163.1 |
| B | 15 | 204 | 143949 | 928.93 | 802 | 784 | 154.1 |
| B | 3 | 0 | 32469 | 205.59 | 802 | 784 | 154.1 |
| B | 0 | 229 | 25913 | 163.05 | 802 | 784 | 154.1 |
| C | 10 | 65 | 12250 | 63.7 | 774 | 777 | 180.1 |
| C | 8 | 128 | 7609 | 37.93 | 774 | 777 | 180.1 |
| C | 9 | 247 | 6506 | 31.81 | 774 | 777 | 180.1 |
| D | 9 | 82 | 129523 | 693.33 | 769 | 748 | 185.7 |
| D | 13 | 239 | 105240 | 562.59 | 769 | 748 | 185.7 |
| D | 2 | 232 | 104312 | 557.59 | 769 | 748 | 185.7 |
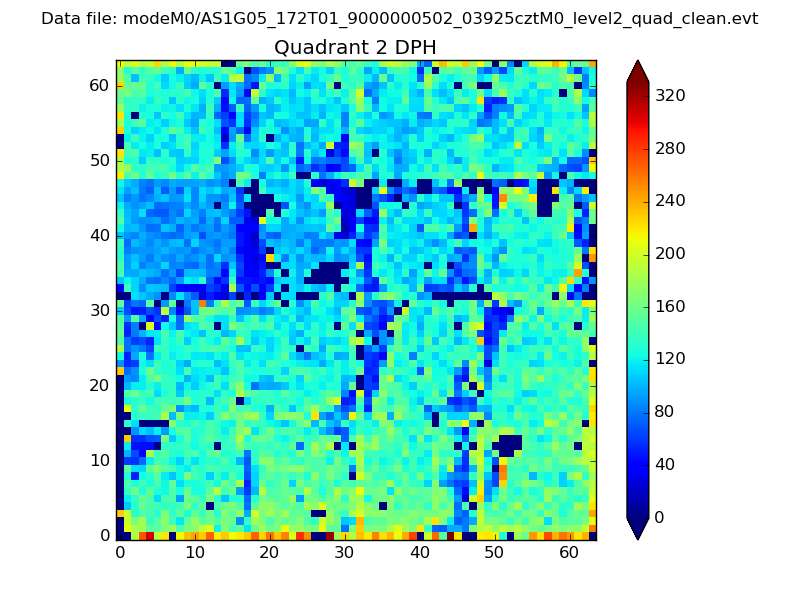
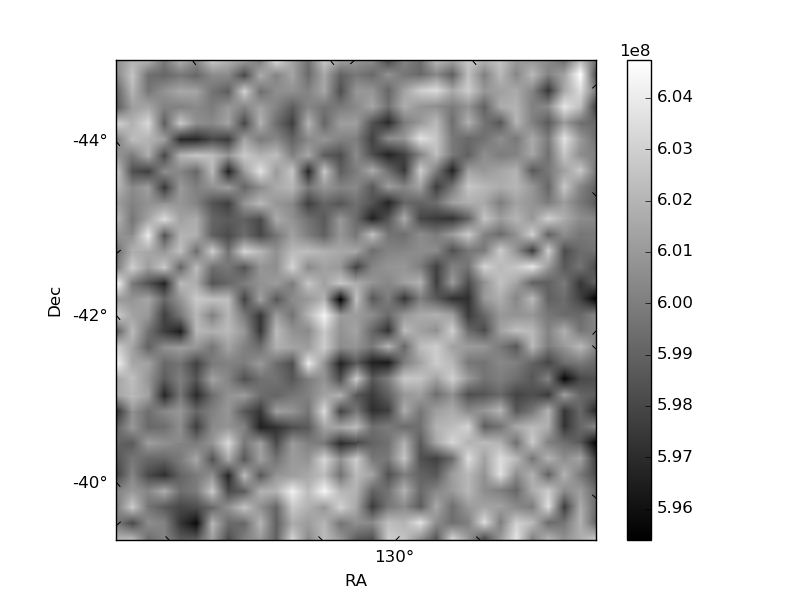
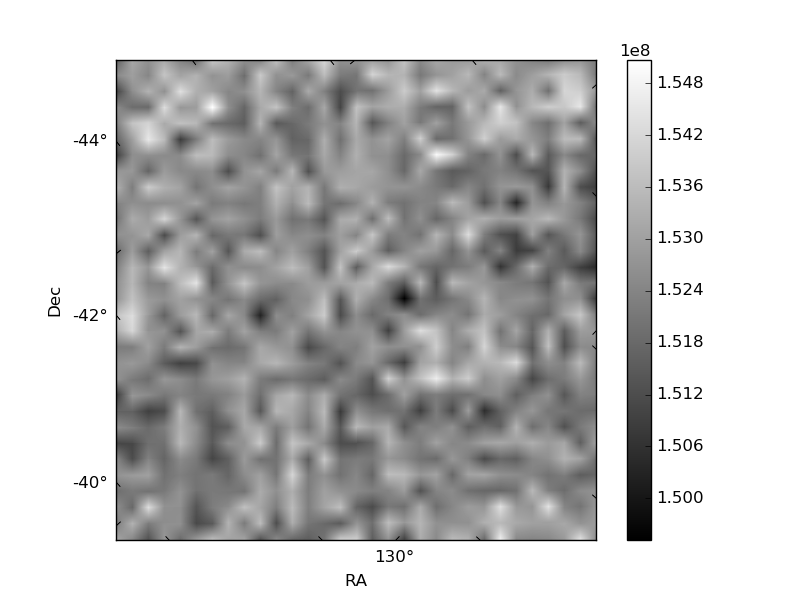
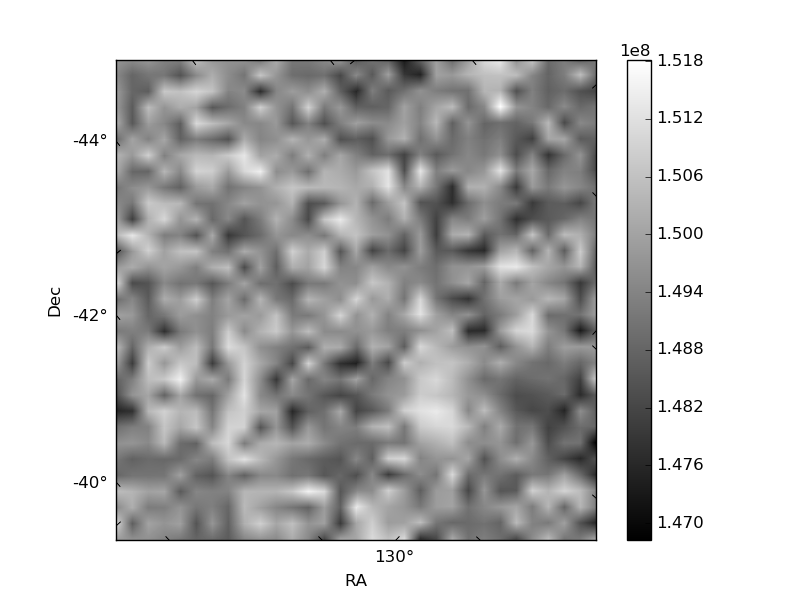
Histogram calculated using DETX and DETY for each event in the final _common_clean file
| Quadrant A | 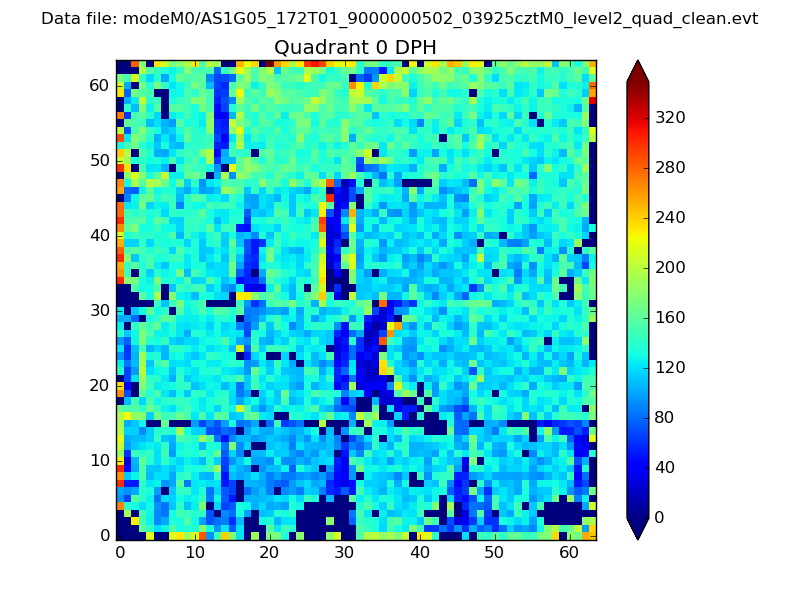 |
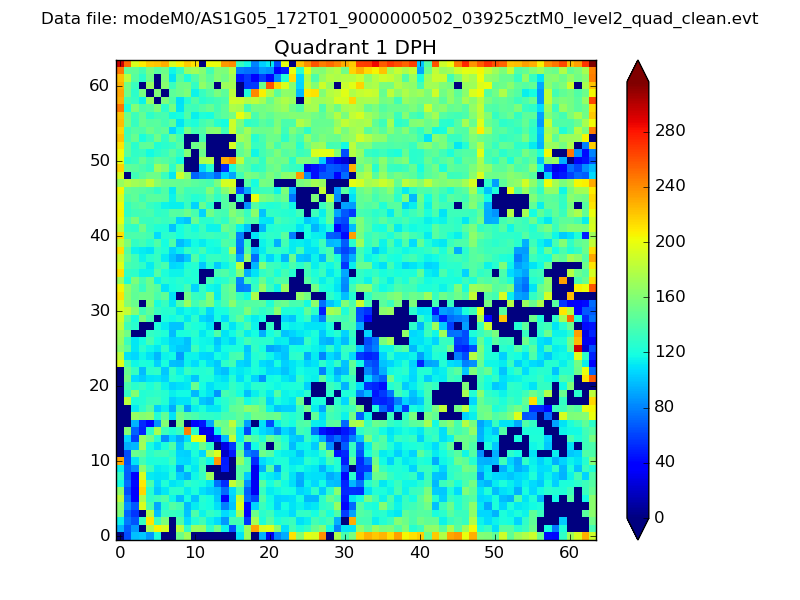 |
Quadrant B |
|---|---|---|---|
| Quadrant D | 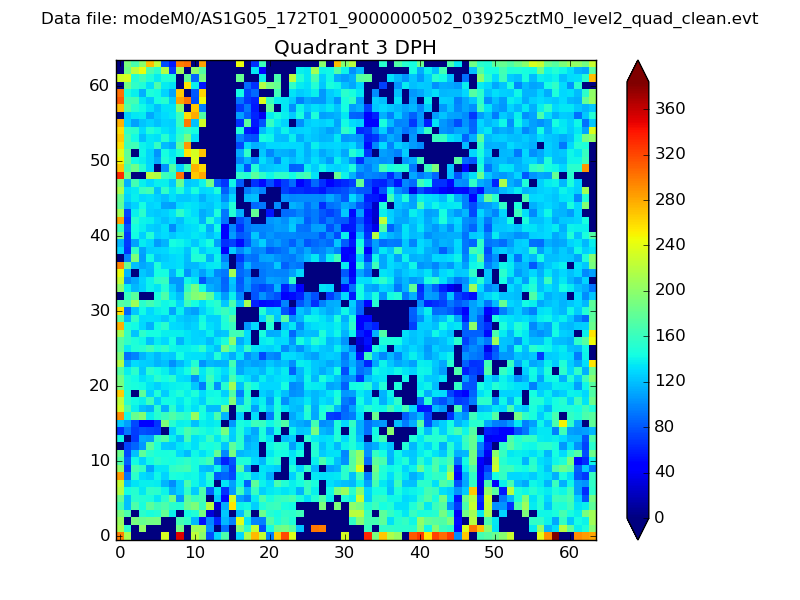 |
 |
Quadrant C |
| Plot type | Count rate plots | Images |
|---|---|---|
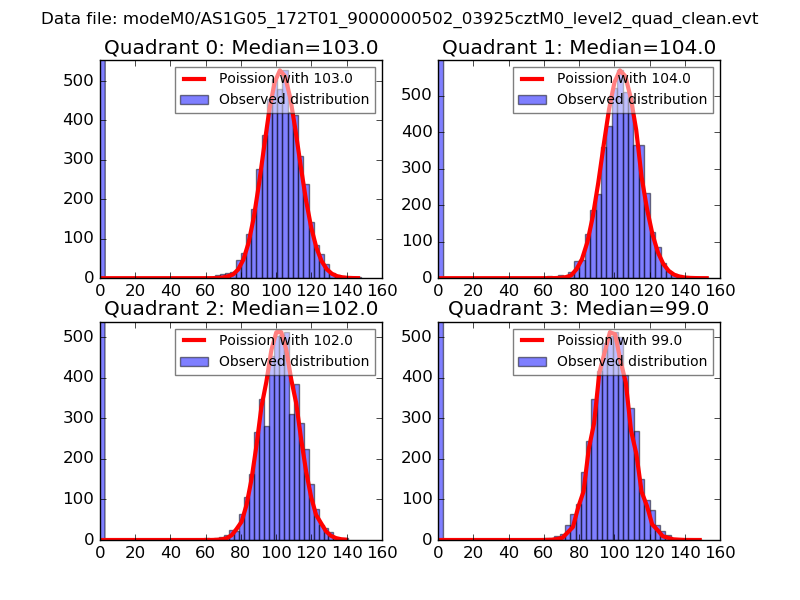
| Comparison with Poisson distribution Blue bars denote a histogram of data divided into 1 sec bins. Red curve is a Poisson curve with rate = median count rate of data. |
 |
 |
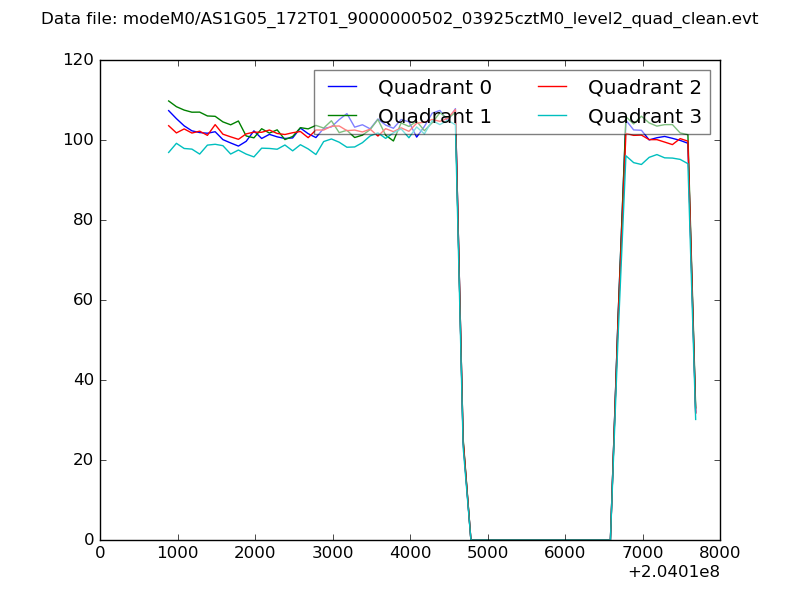
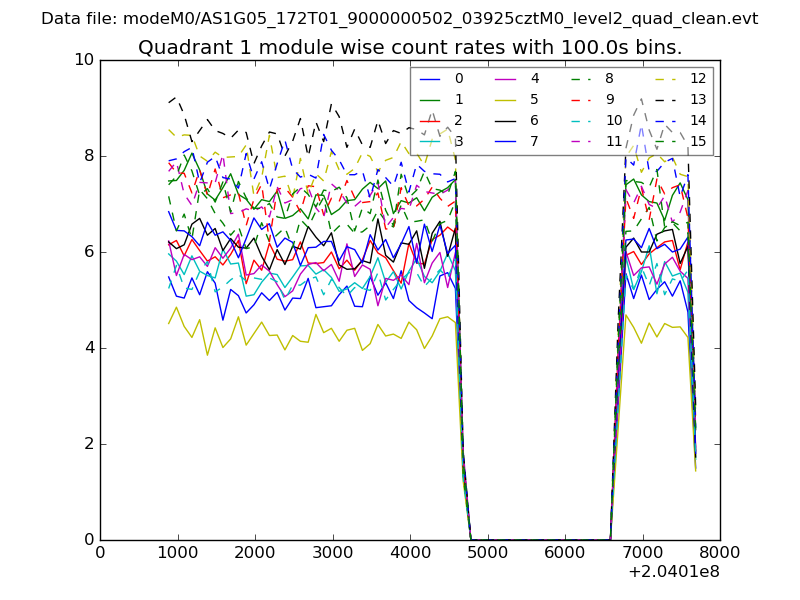
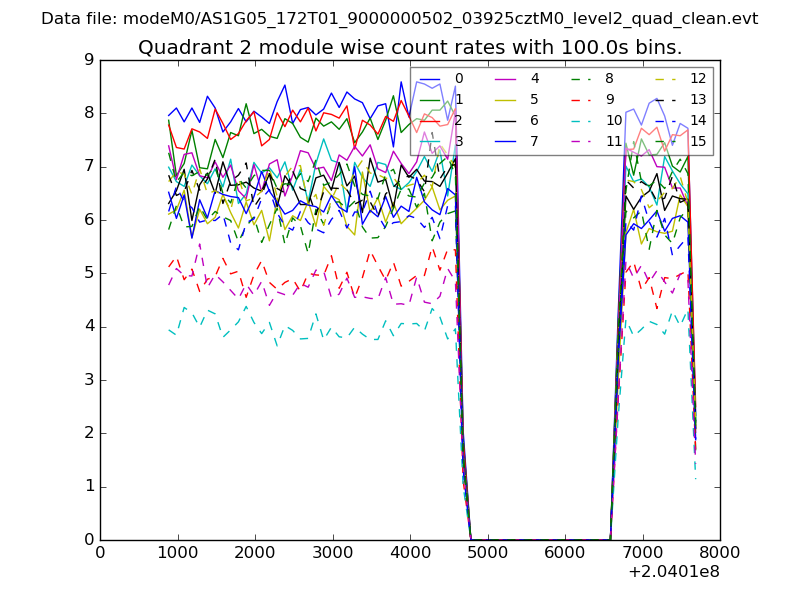
| Quadrant-wise count rates Data is divided into 100 sec bins |
 |
|
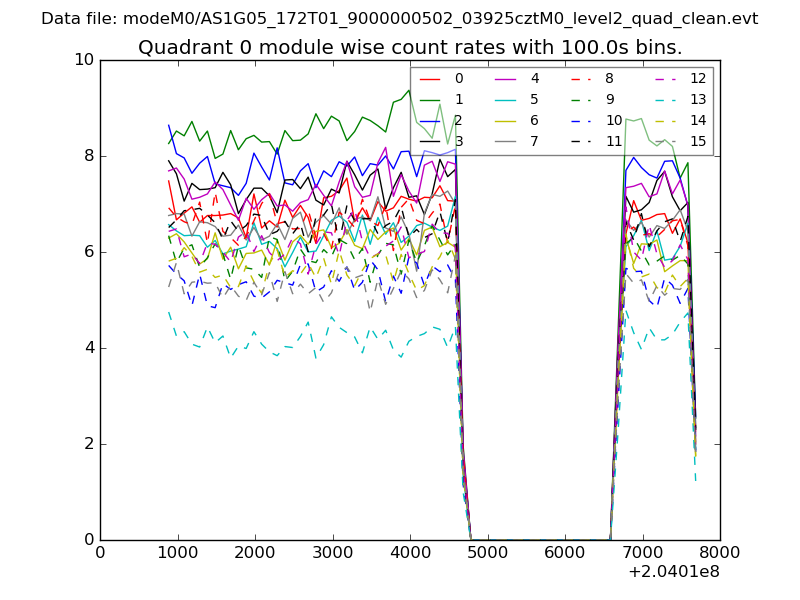
| Module-wise count rates for Quadrant A Data is divided into 100 sec bins |
 |
 |
| Module-wise count rates for Quadrant B Data is divided into 100 sec bins |
 |
 |
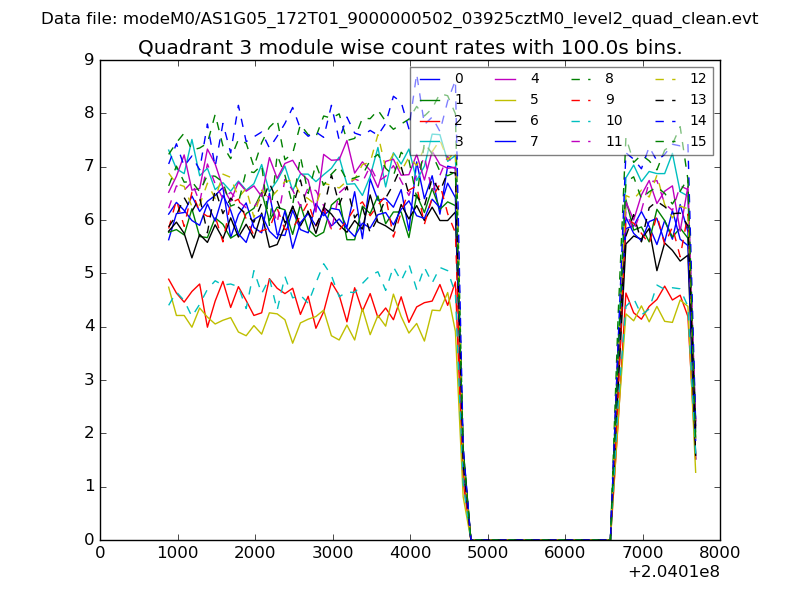
| Module-wise count rates for Quadrant C Data is divided into 100 sec bins |
 |
 |
| Module-wise count rates for Quadrant D Data is divided into 100 sec bins |
 |
 |
| Parameter | Plot |
|---|---|
| CZT HV Monitor | 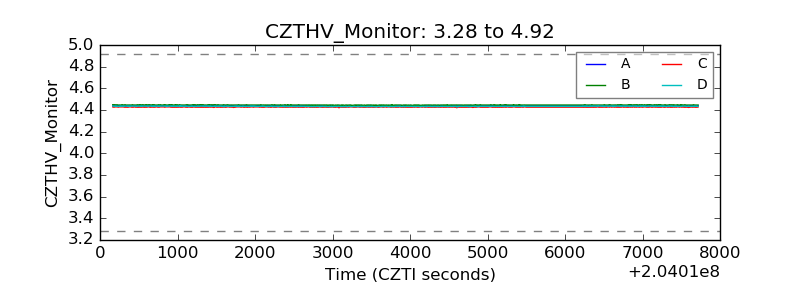 |
| D_VDD | 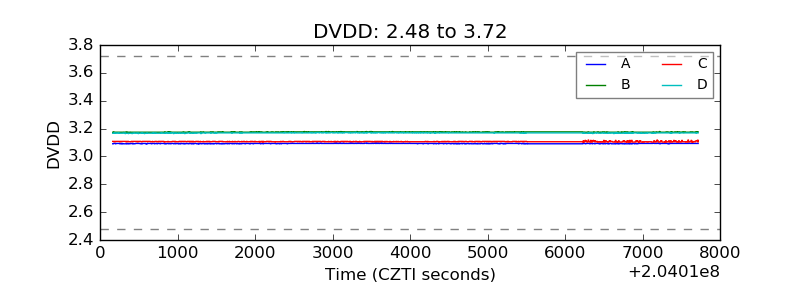 |
| Temperature 1 | 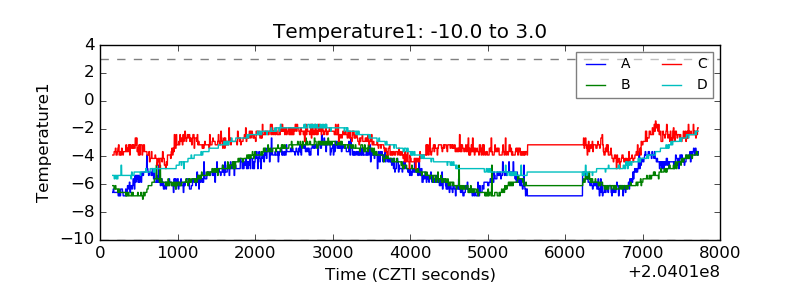 |
| Veto HV Monitor | 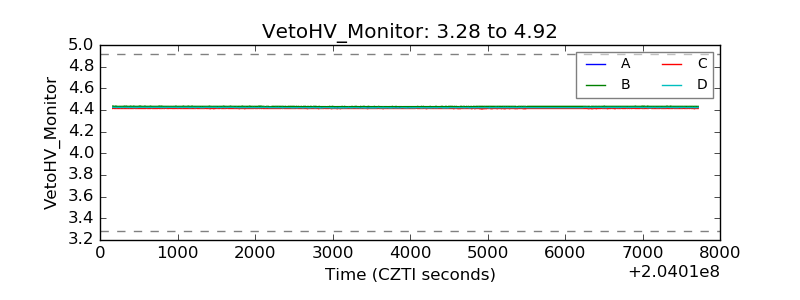 |
| Veto LLD | 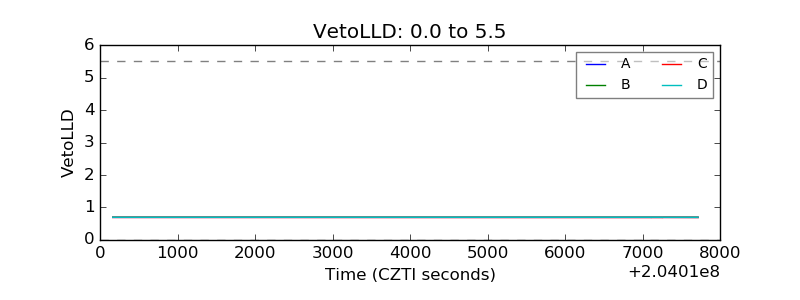 |
| Alpha Counter | 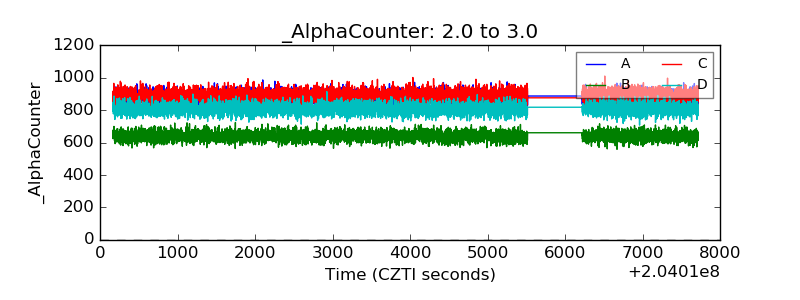 |
| _CPM_Rate | 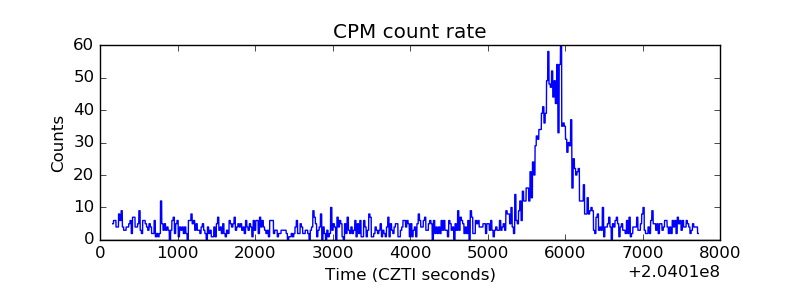 |
| CZT Counter | 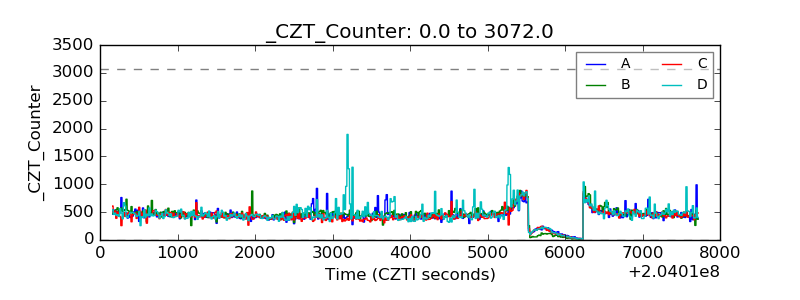 |
| +2.5 Volts monitor |  |
| +5 Volts monitor |  |
| Veto Counter | 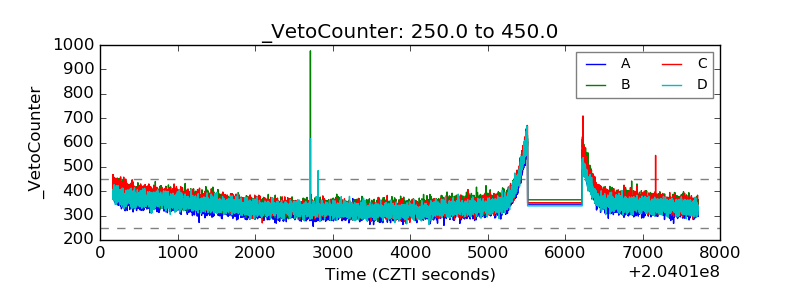 |