| Param | Original file | Final file |
|---|---|---|
| Filename | modeM0/AS1G05_172T01_9000000502_03926cztM0_level2.evt | modeM0/AS1G05_172T01_9000000502_03926cztM0_level2_quad_clean.evt |
| Size (bytes) | 559,137,600 | 89,507,520 |
| Size | 533.2 MB | 85.4 MB |
| Events in quadrant A | 4,133,598 | 543,018 |
| Events in quadrant B | 4,013,037 | 550,498 |
| Events in quadrant C | 3,578,848 | 546,588 |
| Events in quadrant D | 4,672,886 | 522,489 |
| Mode SS | |||
|---|---|---|---|
| Quadrant | BADHDUFLAG | Total packets | Discarded packets |
| A | 0 | 160 | 0 |
| B | 0 | 160 | 0 |
| C | 0 | 160 | 0 |
| D | 0 | 160 | 0 |
| Mode M9 | |||
|---|---|---|---|
| Quadrant | BADHDUFLAG | Total packets | Discarded packets |
| A | 0 | 2 | 0 |
| B | 0 | 2 | 0 |
| C | 0 | 2 | 0 |
| D | 0 | 3 | 0 |
| Mode M0 | |||
|---|---|---|---|
| Quadrant | BADHDUFLAG | Total packets | Discarded packets |
| A | 0 | 17698 | 3 |
| B | 0 | 16849 | 2 |
| C | 0 | 16368 | 2 |
| D | 0 | 19301 | 2 |
| Quadrant | Total seconds | Saturated seconds | Saturation percentage |
|---|---|---|---|
| A | 7886 | 418 | 5.300533% |
| B | 7886 | 281 | 3.563277% |
| C | 7886 | 204 | 2.586863% |
| D | 7886 | 388 | 4.920112% |
Noise dominated data is calculated using 1-second bins in cleaned event files. If a bin has >2000 counts, and if more than 50% of those come from <1% of pixels, then it is considered to be noise-dominated and hence unusable.
| Quadrant | # 1 sec bins | Bins with >0 counts | Bins with >2000 counts | High rate bins dominated by noise | Noise dominated (total time) | Noise dominated (detector-on time) | Marked lightcurve |
|---|---|---|---|---|---|---|---|
| A | 8001 | 7889 | 68 | 68 | 0.85% | 0.86% | 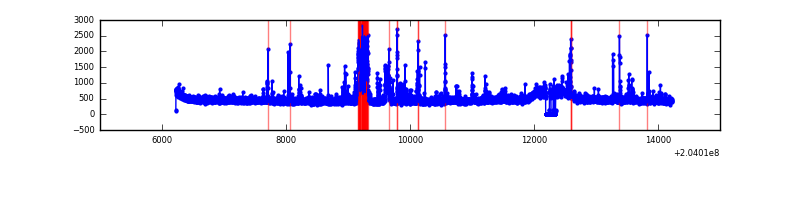 |
| B | 8001 | 7889 | 2 | 2 | 0.02% | 0.03% | 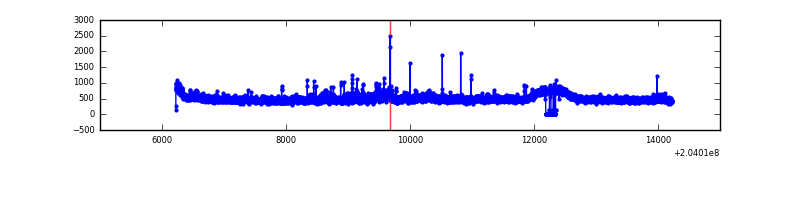 |
| C | 8001 | 7889 | 0 | 0 | 0.00% | 0.00% | 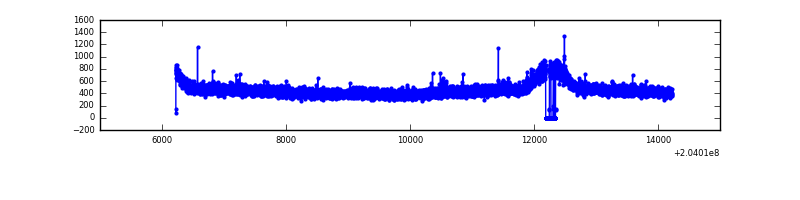 |
| D | 8001 | 7889 | 102 | 102 | 1.27% | 1.29% | 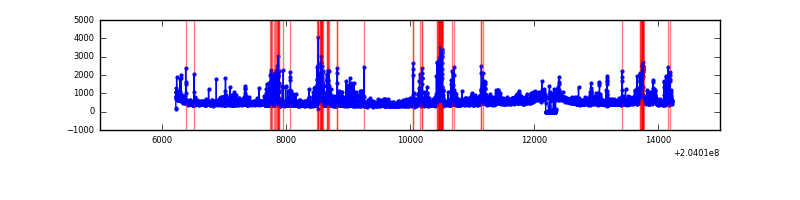 |
Top three noisy pixels from each quadrant. If the there are fewer than three noisy pixels in the level2.evt file, extra rows are filled as -1
| Pixel properties | Quadrant properties | ||||||
|---|---|---|---|---|---|---|---|
| Quadrant | DetID | PixID | Counts | Sigma | Mean | Median | Sigma |
| A | 0 | 50 | 291028 | 1526.23 | 921 | 898 | 190.1 |
| A | 0 | 118 | 153372 | 802.09 | 921 | 898 | 190.1 |
| A | 2 | 79 | 62993 | 326.65 | 921 | 898 | 190.1 |
| B | 15 | 204 | 210482 | 1159.89 | 930 | 903 | 180.7 |
| B | 3 | 0 | 123619 | 679.16 | 930 | 903 | 180.7 |
| B | 0 | 229 | 54328 | 295.67 | 930 | 903 | 180.7 |
| C | 8 | 128 | 20768 | 94.4 | 901 | 902 | 210.5 |
| C | 10 | 65 | 20663 | 93.9 | 901 | 902 | 210.5 |
| C | 8 | 112 | 9706 | 41.83 | 901 | 902 | 210.5 |
| D | 9 | 82 | 505223 | 2353.28 | 893 | 867 | 214.3 |
| D | 2 | 232 | 215051 | 999.36 | 893 | 867 | 214.3 |
| D | 1 | 7 | 169111 | 785.01 | 893 | 867 | 214.3 |
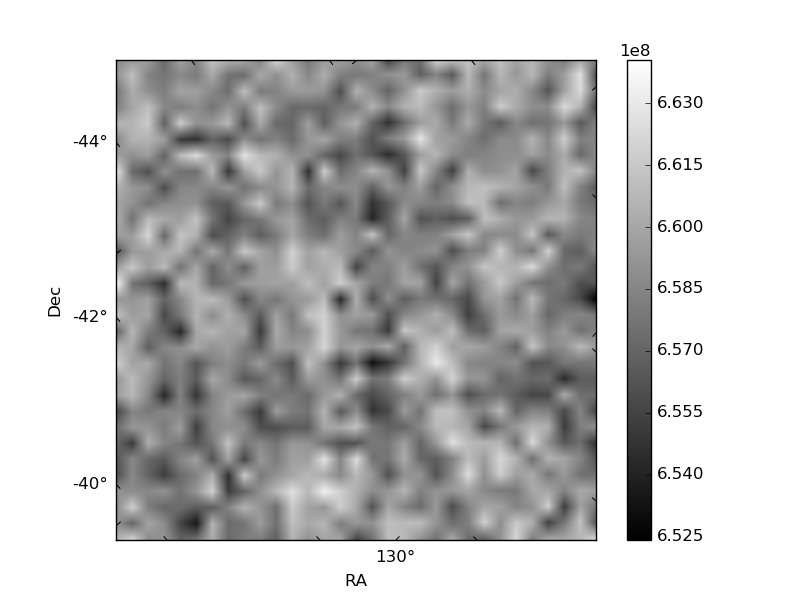
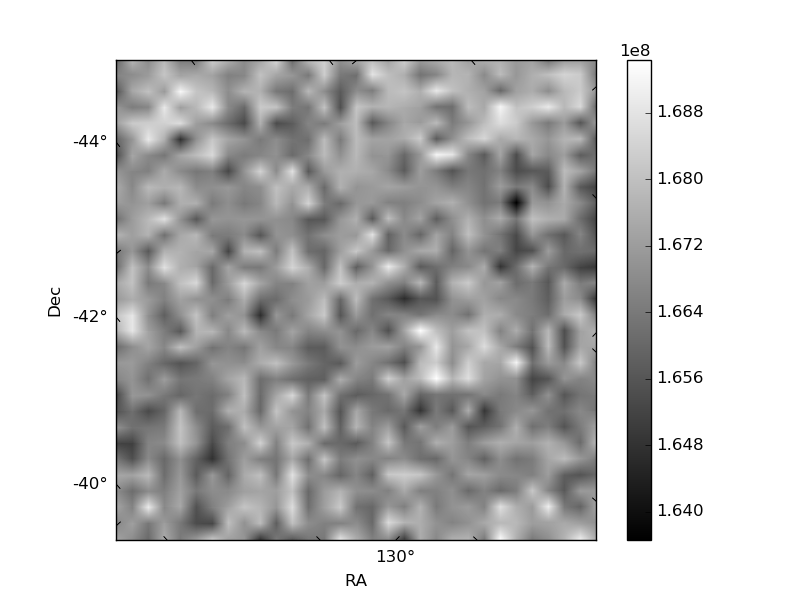
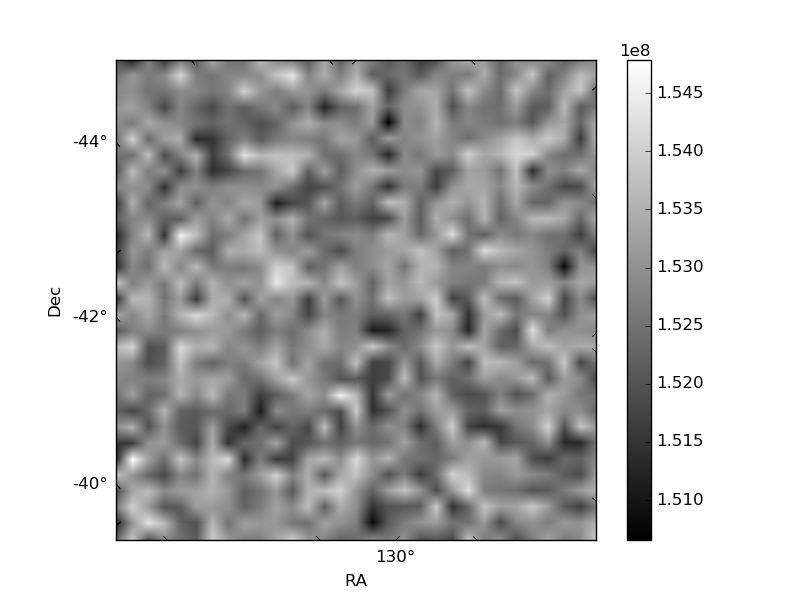
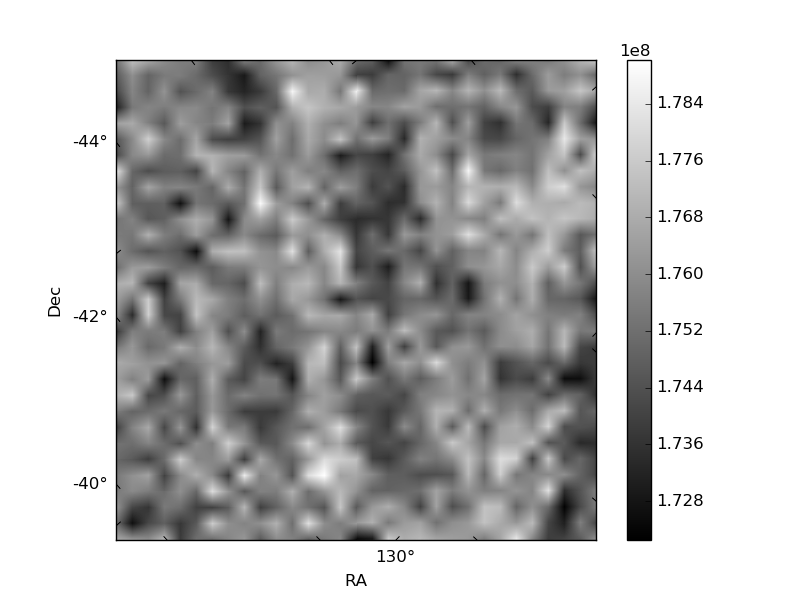
Histogram calculated using DETX and DETY for each event in the final _common_clean file
| Quadrant A | 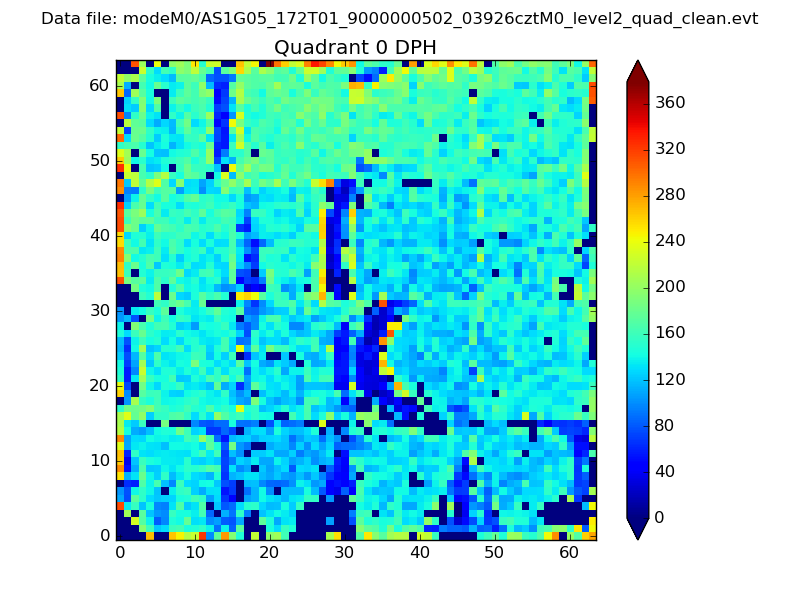 |
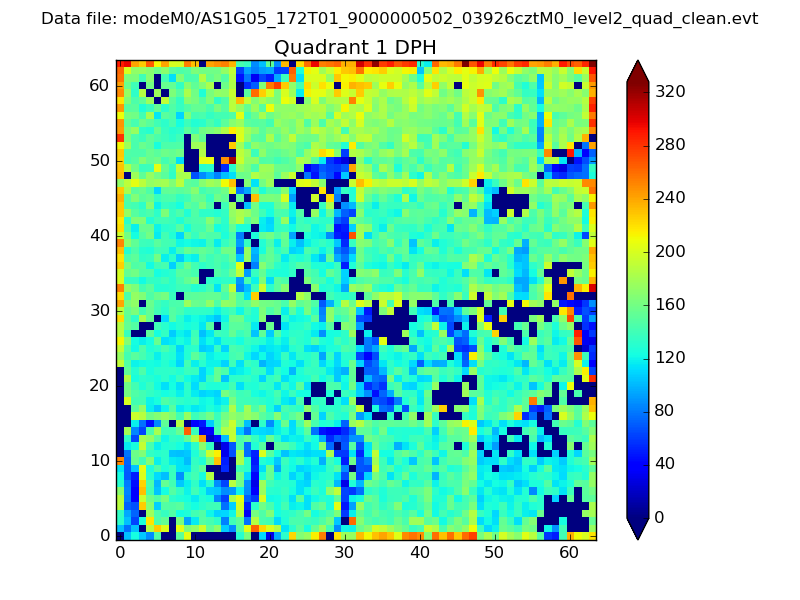 |
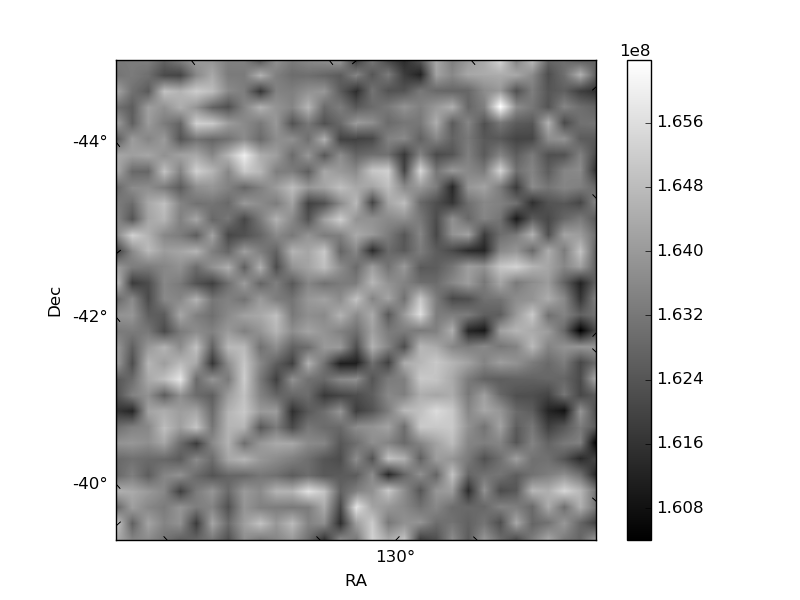
Quadrant B |
|---|---|---|---|
| Quadrant D | 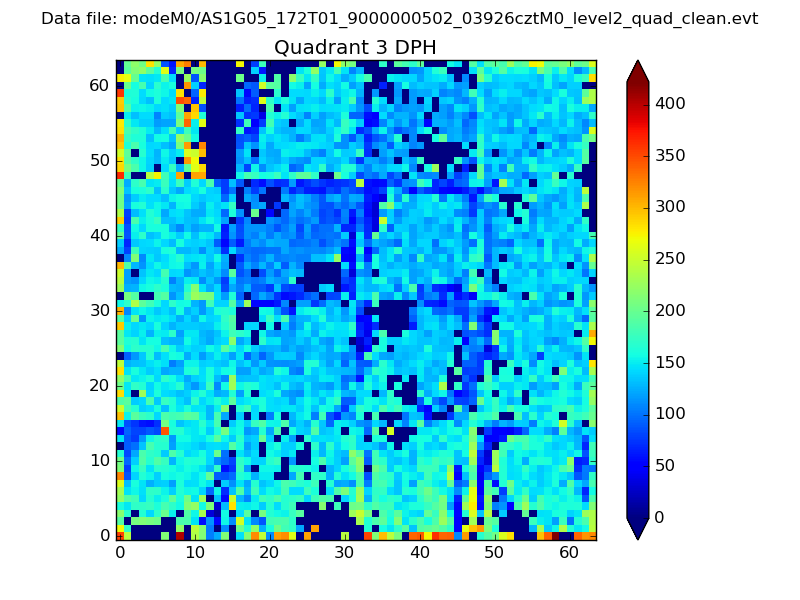 |
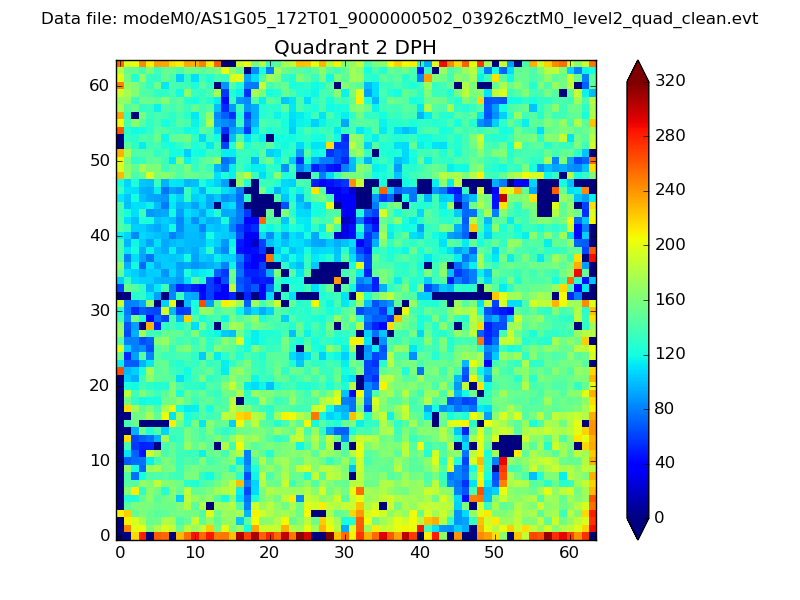 |
Quadrant C |
| Plot type | Count rate plots | Images |
|---|---|---|
| Comparison with Poisson distribution Blue bars denote a histogram of data divided into 1 sec bins. Red curve is a Poisson curve with rate = median count rate of data. |
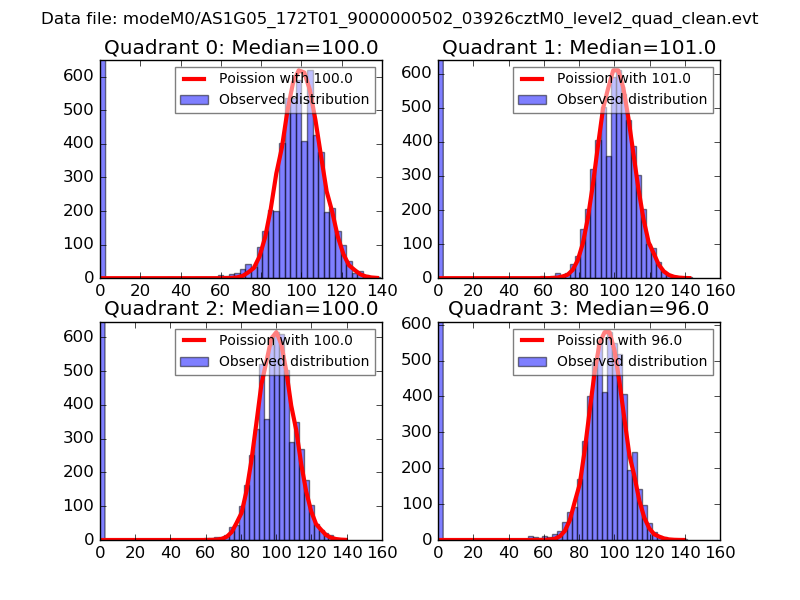 |
 |
| Quadrant-wise count rates Data is divided into 100 sec bins |
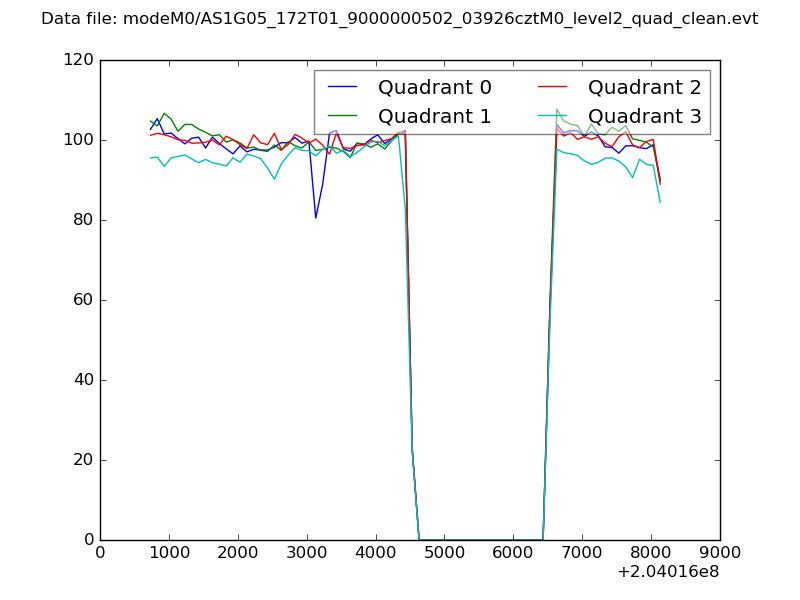 |
|
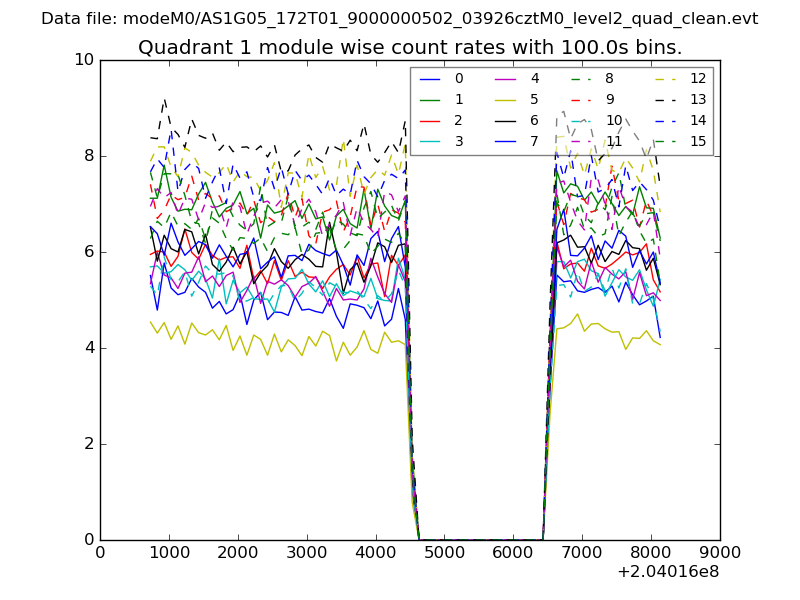
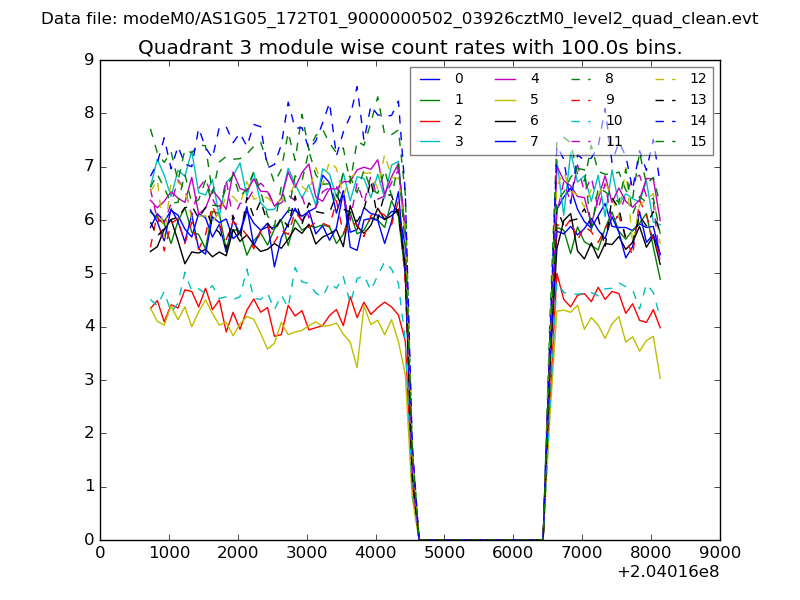
| Module-wise count rates for Quadrant A Data is divided into 100 sec bins |
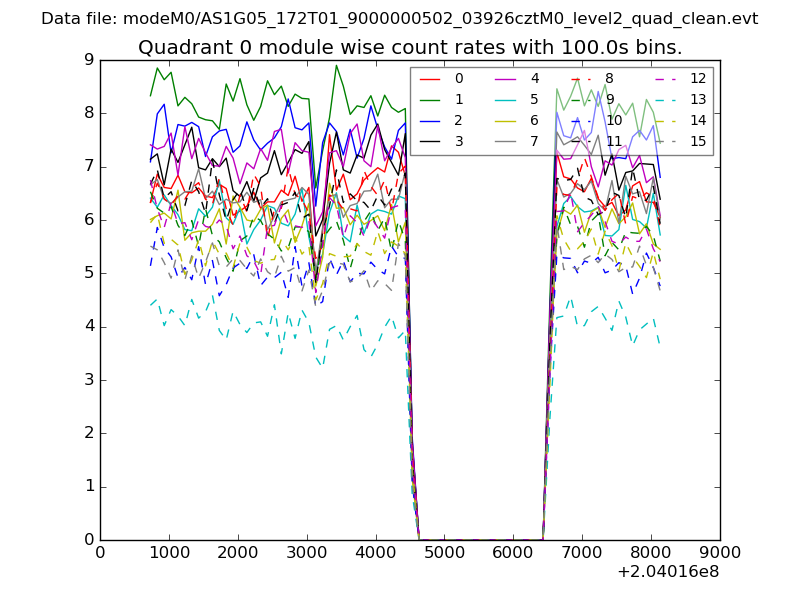 |
 |
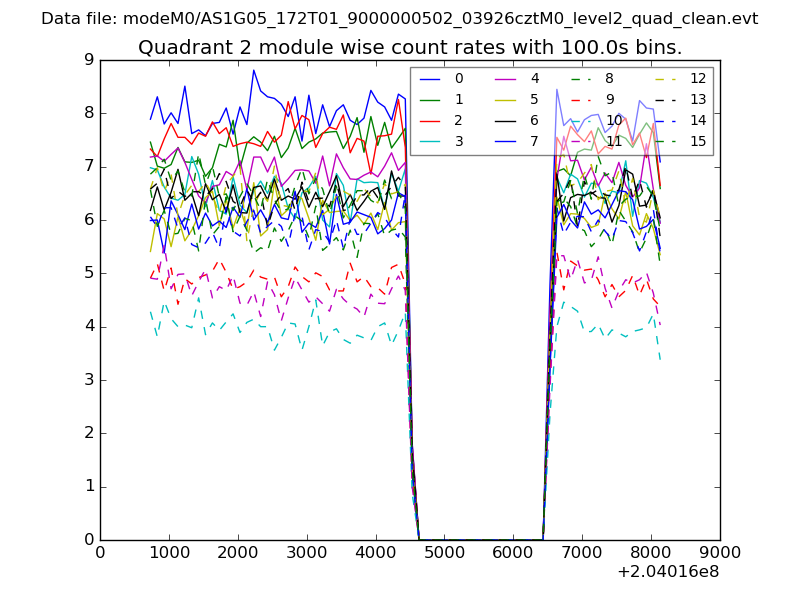
| Module-wise count rates for Quadrant B Data is divided into 100 sec bins |
 |
 |
| Module-wise count rates for Quadrant C Data is divided into 100 sec bins |
 |
 |
| Module-wise count rates for Quadrant D Data is divided into 100 sec bins |
 |
 |
| Parameter | Plot |
|---|---|
| CZT HV Monitor | 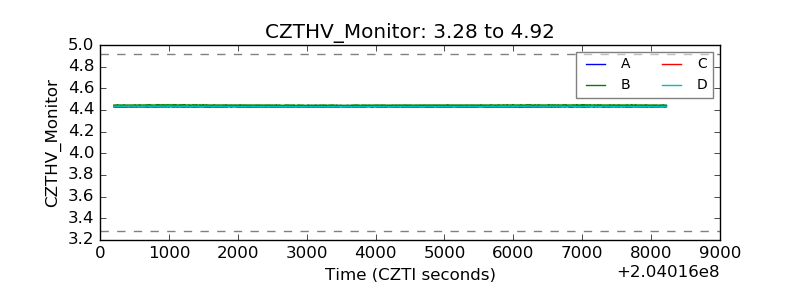 |
| D_VDD | 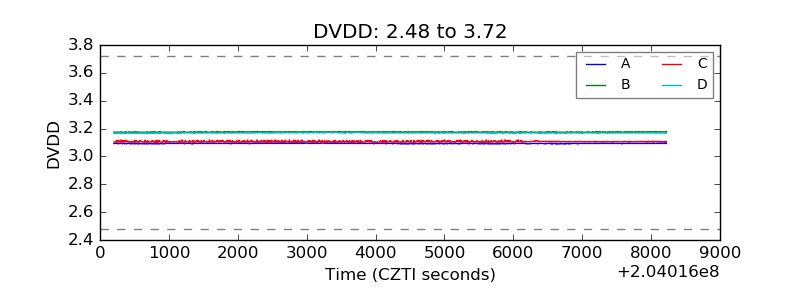 |
| Temperature 1 | 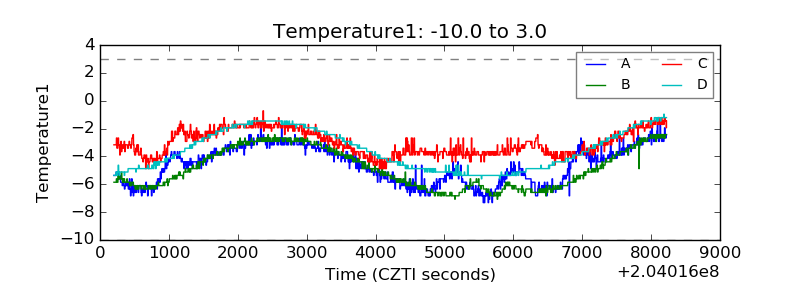 |
| Veto HV Monitor | 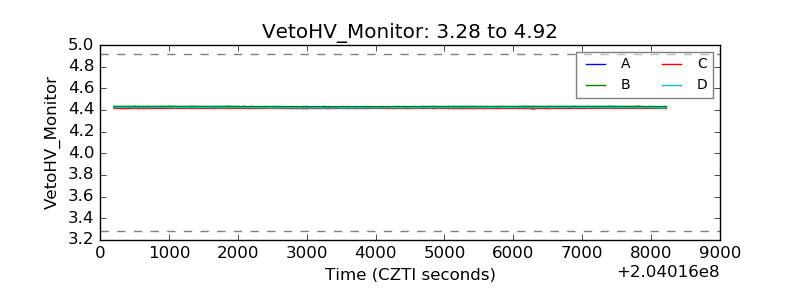 |
| Veto LLD |  |
| Alpha Counter | 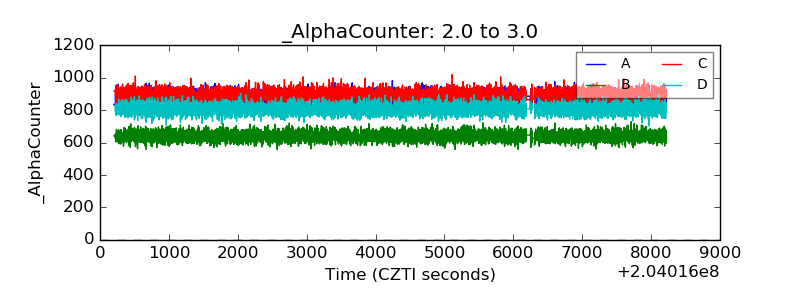 |
| _CPM_Rate | 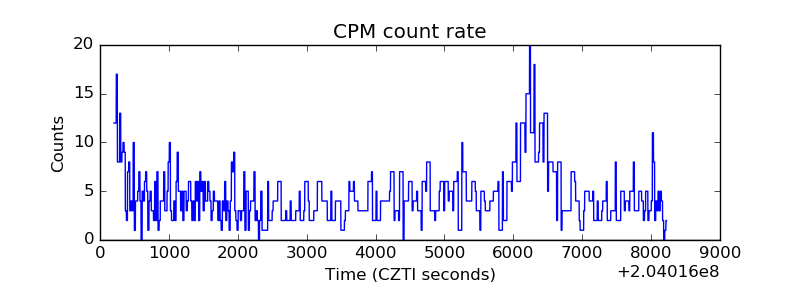 |
| CZT Counter | 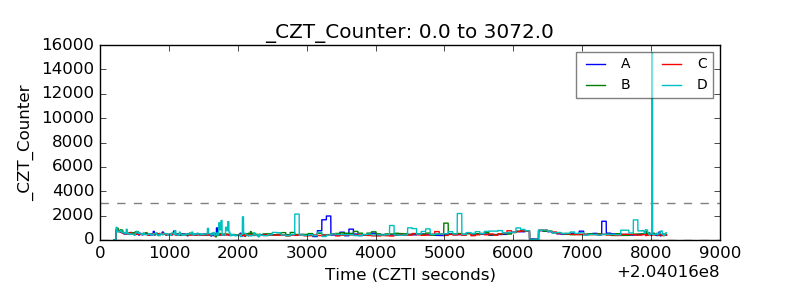 |
| +2.5 Volts monitor |  |
| +5 Volts monitor |  |
| Veto Counter | 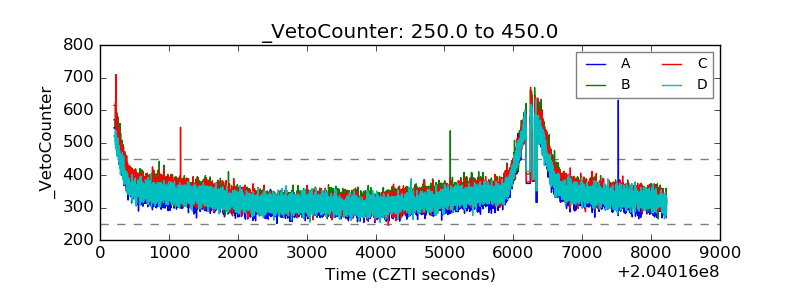 |