| Param | Original file | Final file |
|---|---|---|
| Filename | modeM0/AS1G05_172T01_9000000502_03927cztM0_level2.evt | modeM0/AS1G05_172T01_9000000502_03927cztM0_level2_quad_clean.evt |
| Size (bytes) | 546,120,000 | 88,755,840 |
| Size | 520.8 MB | 84.6 MB |
| Events in quadrant A | 3,564,698 | 549,113 |
| Events in quadrant B | 4,031,005 | 551,930 |
| Events in quadrant C | 3,283,910 | 550,920 |
| Events in quadrant D | 5,151,657 | 514,744 |
| Mode SS | |||
|---|---|---|---|
| Quadrant | BADHDUFLAG | Total packets | Discarded packets |
| A | 0 | 150 | 0 |
| B | 0 | 150 | 0 |
| C | 0 | 150 | 0 |
| D | 0 | 150 | 0 |
| Mode M0 | |||
|---|---|---|---|
| Quadrant | BADHDUFLAG | Total packets | Discarded packets |
| A | 0 | 15839 | 15 |
| B | 0 | 16569 | 6 |
| C | 0 | 15394 | 14 |
| D | 0 | 20504 | 38 |
| Quadrant | Total seconds | Saturated seconds | Saturation percentage |
|---|---|---|---|
| A | 7483 | 128 | 1.710544% |
| B | 7487 | 110 | 1.469213% |
| C | 7483 | 28 | 0.374181% |
| D | 7479 | 355 | 4.746624% |
Noise dominated data is calculated using 1-second bins in cleaned event files. If a bin has >2000 counts, and if more than 50% of those come from <1% of pixels, then it is considered to be noise-dominated and hence unusable.
| Quadrant | # 1 sec bins | Bins with >0 counts | Bins with >2000 counts | High rate bins dominated by noise | Noise dominated (total time) | Noise dominated (detector-on time) | Marked lightcurve |
|---|---|---|---|---|---|---|---|
| A | 7490 | 7490 | 5 | 5 | 0.07% | 0.07% | 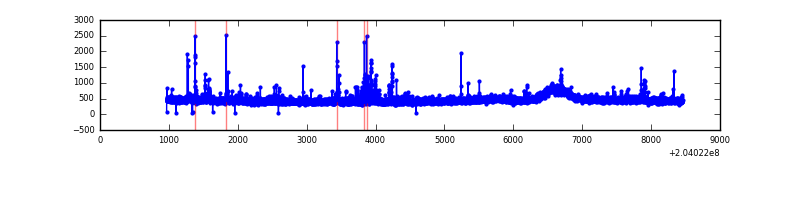 |
| B | 7490 | 7490 | 2 | 2 | 0.03% | 0.03% | 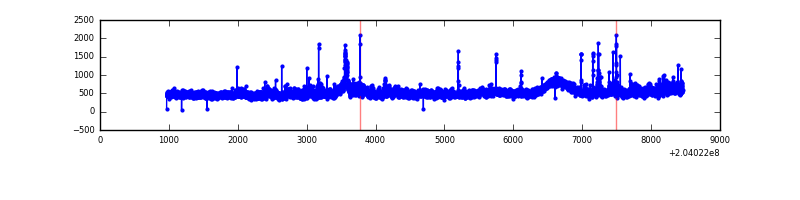 |
| C | 7490 | 7489 | 0 | 0 | 0.00% | 0.00% |  |
| D | 7490 | 7489 | 326 | 326 | 4.35% | 4.35% | 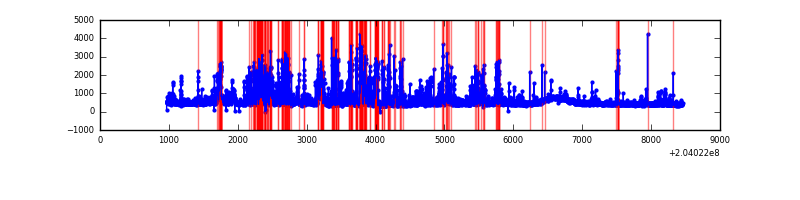 |
Top three noisy pixels from each quadrant. If the there are fewer than three noisy pixels in the level2.evt file, extra rows are filled as -1
| Pixel properties | Quadrant properties | ||||||
|---|---|---|---|---|---|---|---|
| Quadrant | DetID | PixID | Counts | Sigma | Mean | Median | Sigma |
| A | 0 | 118 | 117817 | 656.36 | 867 | 845 | 178.2 |
| A | 2 | 79 | 46735 | 257.5 | 867 | 845 | 178.2 |
| A | 0 | 50 | 29152 | 158.84 | 867 | 845 | 178.2 |
| B | 3 | 0 | 365858 | 2149.58 | 869 | 847 | 169.8 |
| B | 15 | 204 | 192987 | 1131.53 | 869 | 847 | 169.8 |
| B | 0 | 229 | 43321 | 250.13 | 869 | 847 | 169.8 |
| C | 10 | 65 | 9343 | 43.58 | 836 | 839 | 195.1 |
| C | 12 | 4 | 8391 | 38.7 | 836 | 839 | 195.1 |
| C | 13 | 61 | 7072 | 31.94 | 836 | 839 | 195.1 |
| D | 9 | 82 | 641270 | 3212.48 | 828 | 801 | 199.4 |
| D | 1 | 7 | 450999 | 2258.11 | 828 | 801 | 199.4 |
| D | 8 | 112 | 381702 | 1910.53 | 828 | 801 | 199.4 |
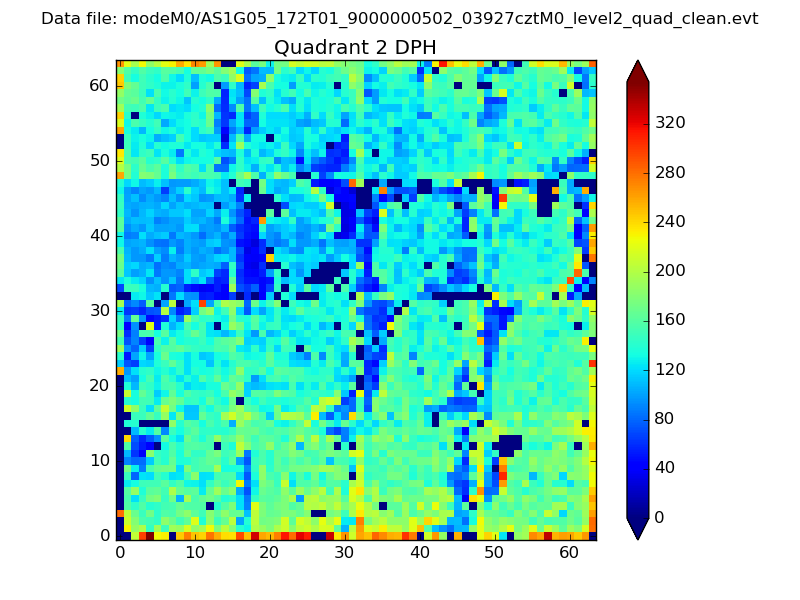
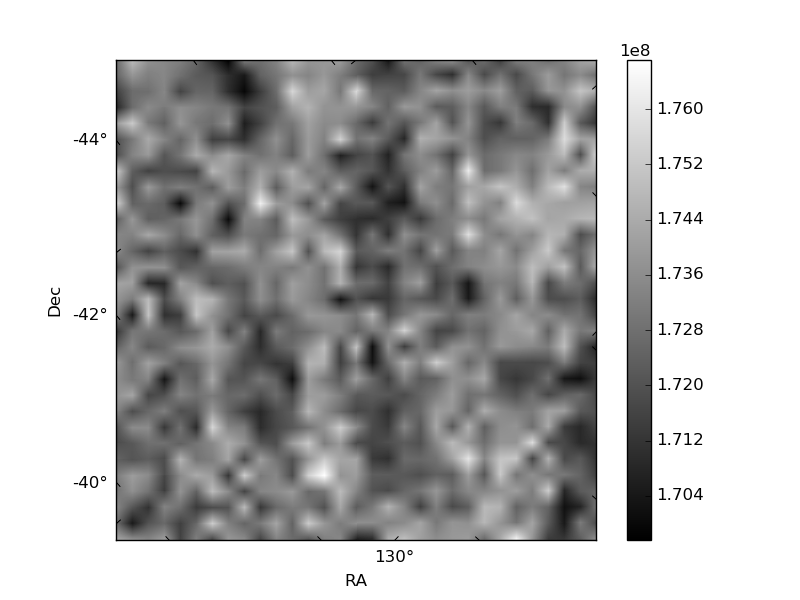
Histogram calculated using DETX and DETY for each event in the final _common_clean file
| Quadrant A | 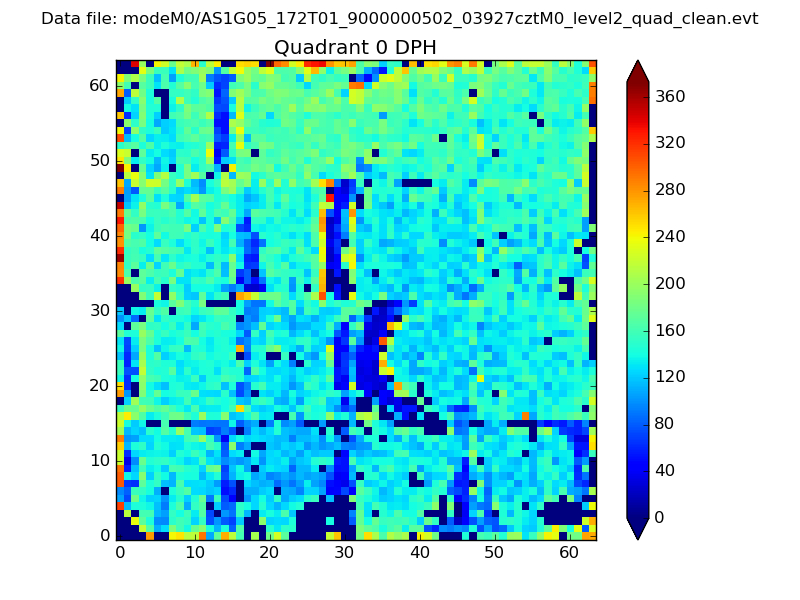 |
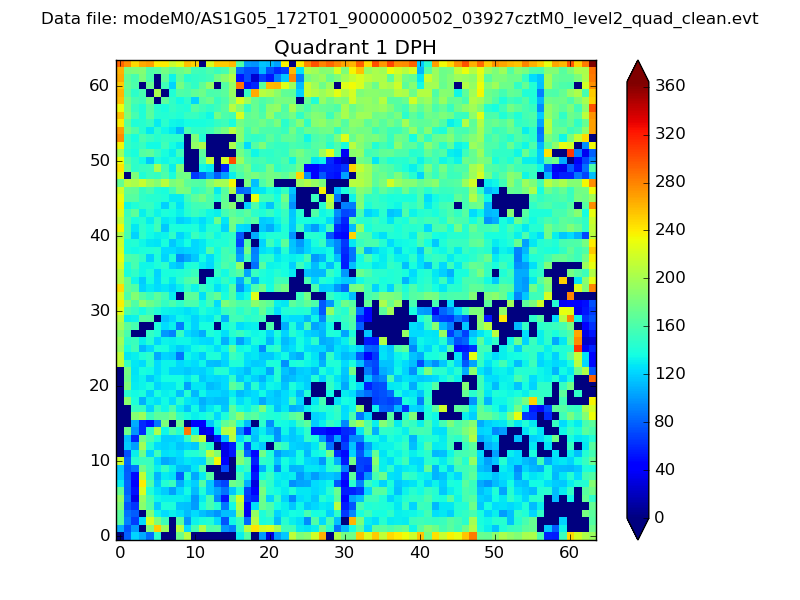 |
Quadrant B |
|---|---|---|---|
| Quadrant D | 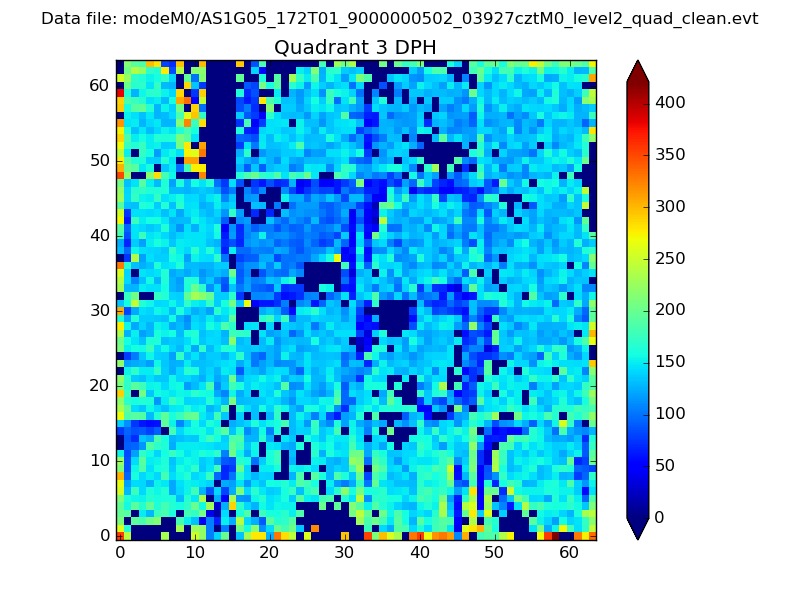 |
 |
Quadrant C |
| Plot type | Count rate plots | Images |
|---|---|---|
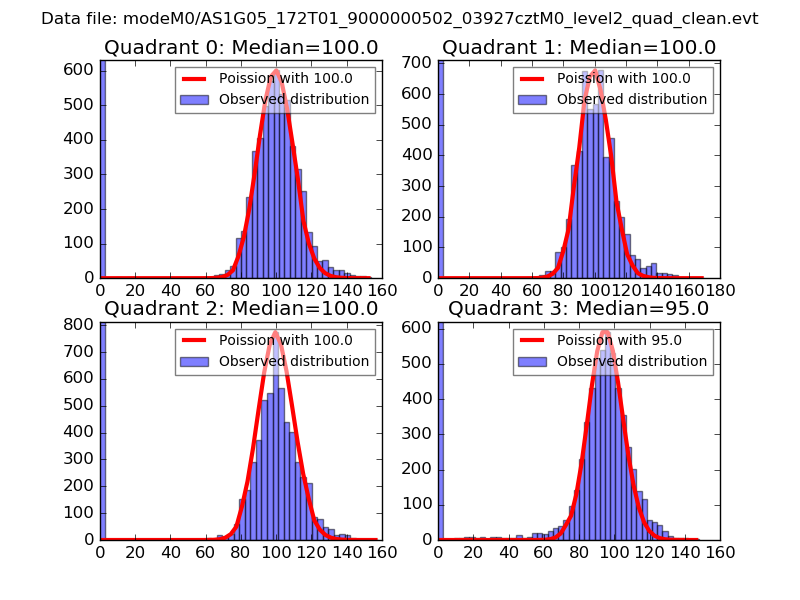
| Comparison with Poisson distribution Blue bars denote a histogram of data divided into 1 sec bins. Red curve is a Poisson curve with rate = median count rate of data. |
 |
 |
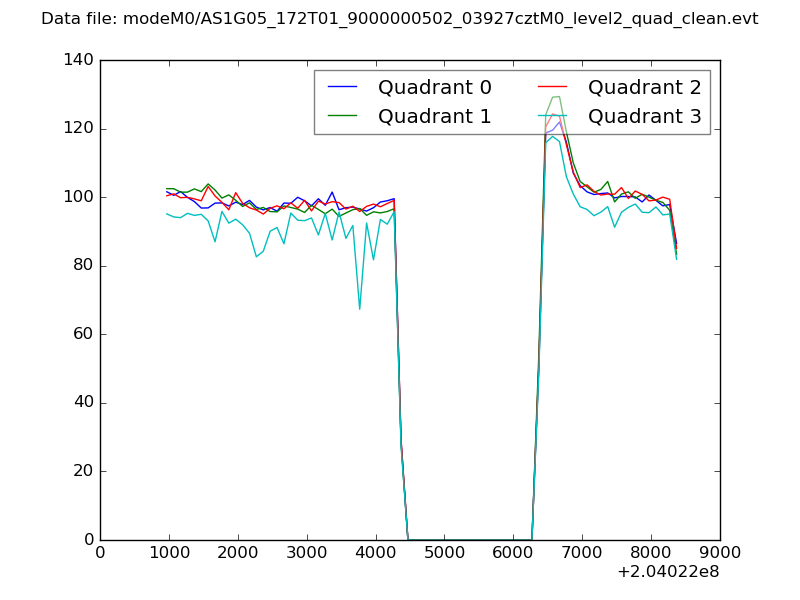
| Quadrant-wise count rates Data is divided into 100 sec bins |
 |
|
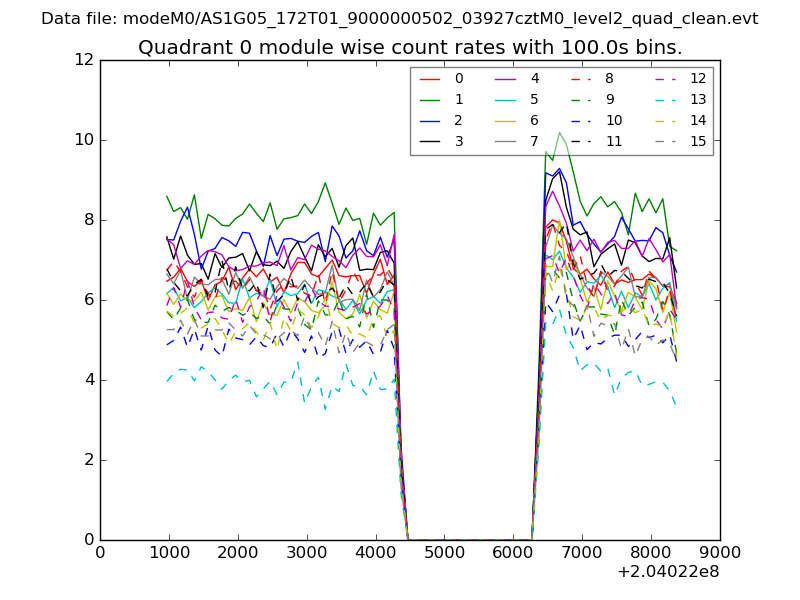
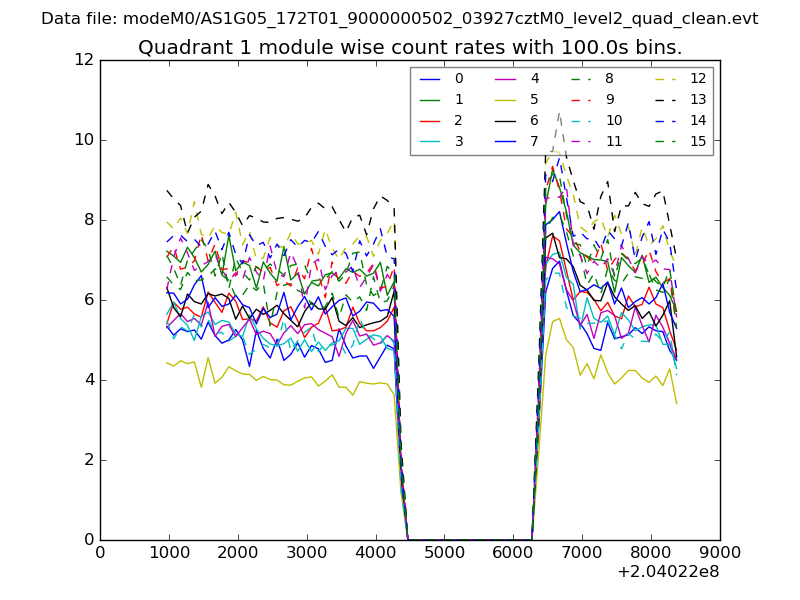
| Module-wise count rates for Quadrant A Data is divided into 100 sec bins |
 |
 |
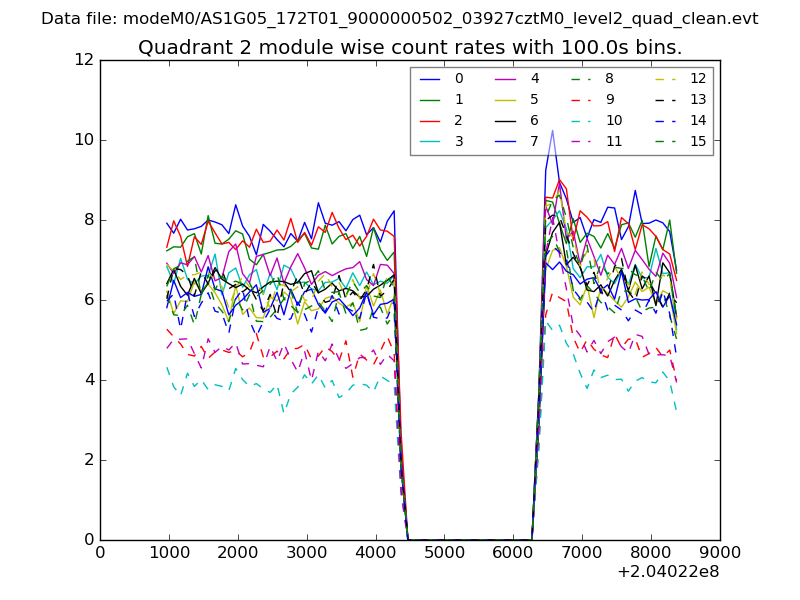
| Module-wise count rates for Quadrant B Data is divided into 100 sec bins |
 |
 |
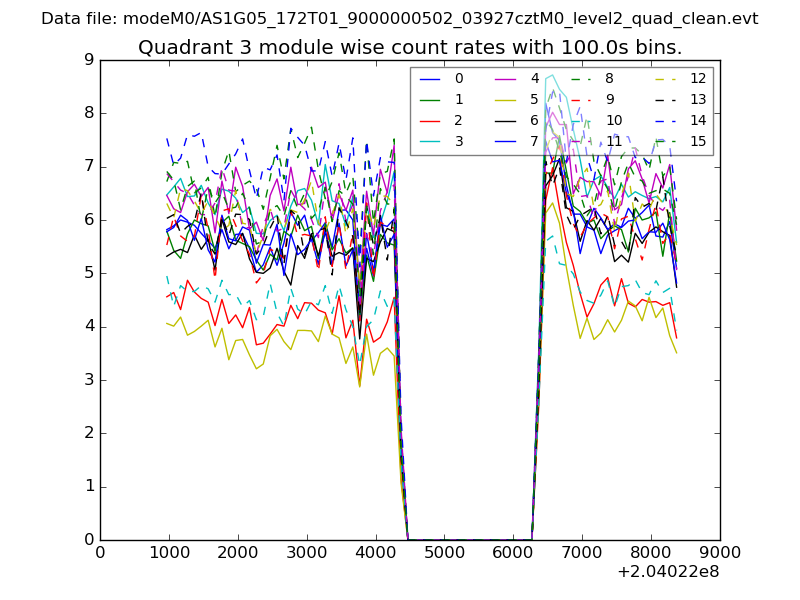
| Module-wise count rates for Quadrant C Data is divided into 100 sec bins |
 |
 |
| Module-wise count rates for Quadrant D Data is divided into 100 sec bins |
 |
 |
| Parameter | Plot |
|---|---|
| CZT HV Monitor | 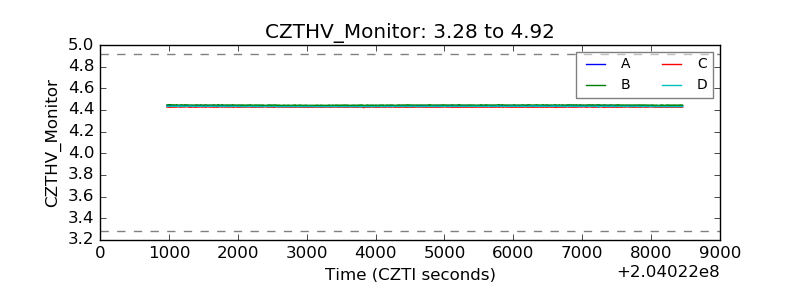 |
| D_VDD | 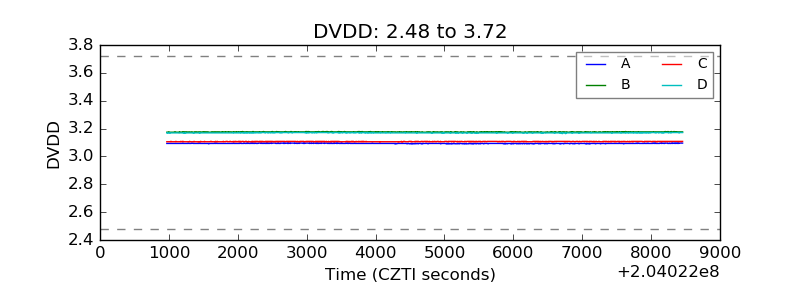 |
| Temperature 1 |  |
| Veto HV Monitor | 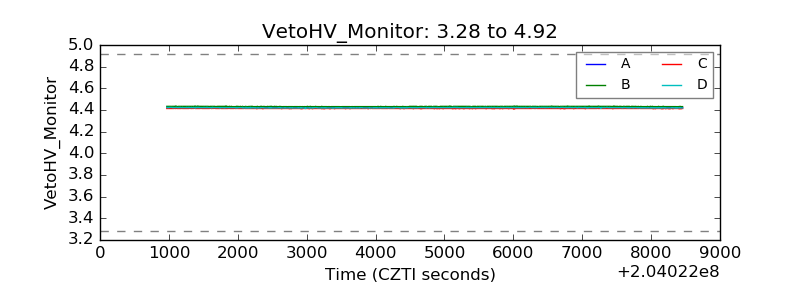 |
| Veto LLD | 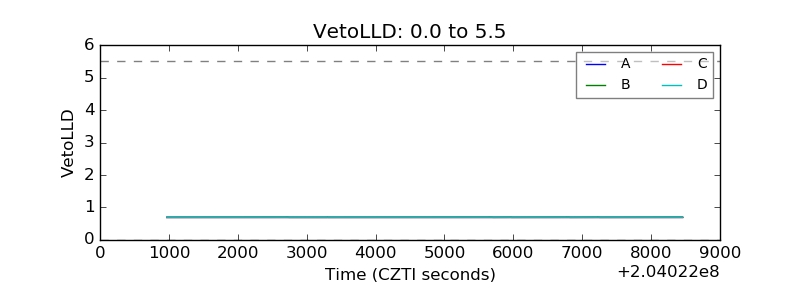 |
| Alpha Counter | 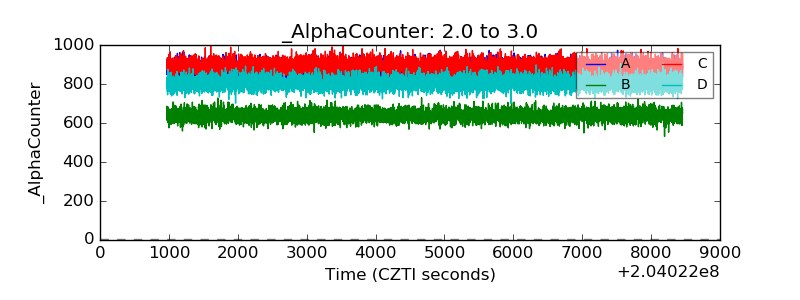 |
| _CPM_Rate | 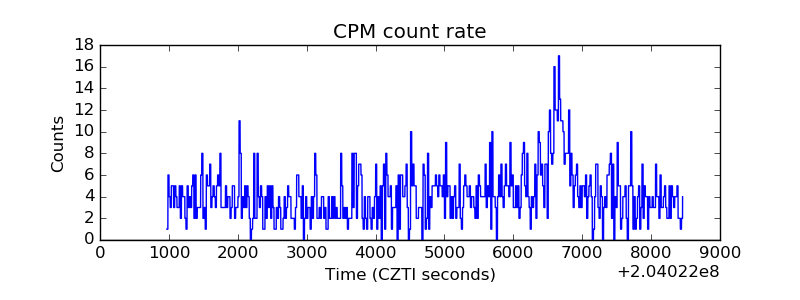 |
| CZT Counter | 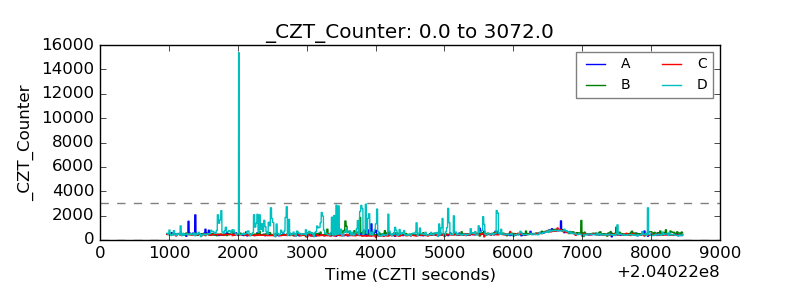 |
| +2.5 Volts monitor |  |
| +5 Volts monitor |  |
| Veto Counter | 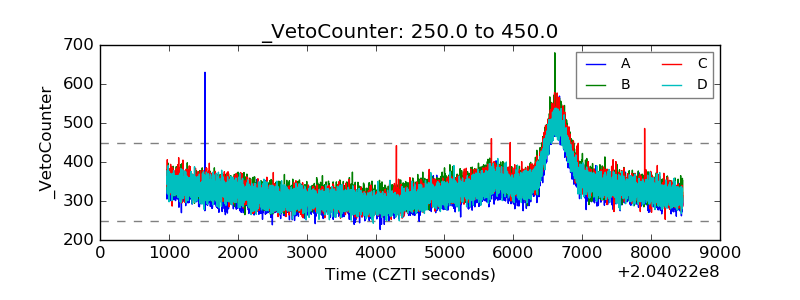 |