| Param | Original file | Final file |
|---|---|---|
| Filename | modeM0/AS1G05_172T01_9000000502_03928cztM0_level2.evt | modeM0/AS1G05_172T01_9000000502_03928cztM0_level2_quad_clean.evt |
| Size (bytes) | 535,737,600 | 76,662,720 |
| Size | 510.9 MB | 73.1 MB |
| Events in quadrant A | 3,162,043 | 475,487 |
| Events in quadrant B | 3,798,937 | 472,451 |
| Events in quadrant C | 2,904,406 | 475,770 |
| Events in quadrant D | 5,902,862 | 428,499 |
| Mode SS | |||
|---|---|---|---|
| Quadrant | BADHDUFLAG | Total packets | Discarded packets |
| A | 0 | 140 | 2 |
| B | 0 | 140 | 2 |
| C | 0 | 140 | 2 |
| D | 0 | 140 | 4 |
| Mode M9 | |||
|---|---|---|---|
| Quadrant | BADHDUFLAG | Total packets | Discarded packets |
| A | 0 | 1 | 0 |
| B | 0 | 1 | 0 |
| C | 0 | 1 | 0 |
| D | 0 | 1 | 0 |
| Mode M0 | |||
|---|---|---|---|
| Quadrant | BADHDUFLAG | Total packets | Discarded packets |
| A | 0 | 14221 | 120 |
| B | 0 | 15794 | 154 |
| C | 0 | 13885 | 147 |
| D | 0 | 22569 | 308 |
| Quadrant | Total seconds | Saturated seconds | Saturation percentage |
|---|---|---|---|
| A | 6734 | 120 | 1.782002% |
| B | 6723 | 116 | 1.725420% |
| C | 6719 | 35 | 0.520911% |
| D | 6706 | 881 | 13.137489% |
Noise dominated data is calculated using 1-second bins in cleaned event files. If a bin has >2000 counts, and if more than 50% of those come from <1% of pixels, then it is considered to be noise-dominated and hence unusable.
| Quadrant | # 1 sec bins | Bins with >0 counts | Bins with >2000 counts | High rate bins dominated by noise | Noise dominated (total time) | Noise dominated (detector-on time) | Marked lightcurve |
|---|---|---|---|---|---|---|---|
| A | 6989 | 6786 | 6 | 6 | 0.09% | 0.09% |  |
| B | 6989 | 6782 | 4 | 4 | 0.06% | 0.06% | 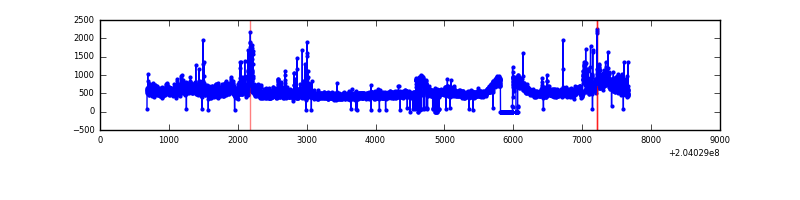 |
| C | 6989 | 6786 | 1 | 1 | 0.01% | 0.01% |  |
| D | 6989 | 6783 | 731 | 731 | 10.46% | 10.78% |  |
Top three noisy pixels from each quadrant. If the there are fewer than three noisy pixels in the level2.evt file, extra rows are filled as -1
| Pixel properties | Quadrant properties | ||||||
|---|---|---|---|---|---|---|---|
| Quadrant | DetID | PixID | Counts | Sigma | Mean | Median | Sigma |
| A | 0 | 118 | 104032 | 648.26 | 771 | 752 | 159.3 |
| A | 2 | 79 | 24502 | 149.07 | 771 | 752 | 159.3 |
| A | 13 | 210 | 18021 | 108.39 | 771 | 752 | 159.3 |
| B | 3 | 0 | 359154 | 2367.3 | 770 | 750 | 151.4 |
| B | 15 | 204 | 267759 | 1763.63 | 770 | 750 | 151.4 |
| B | 4 | 170 | 54655 | 356.05 | 770 | 750 | 151.4 |
| C | 10 | 65 | 12037 | 65.53 | 738 | 741 | 172.4 |
| C | 13 | 61 | 6157 | 31.42 | 738 | 741 | 172.4 |
| C | 9 | 247 | 3610 | 16.64 | 738 | 741 | 172.4 |
| D | 8 | 112 | 1504401 | 8915.34 | 704 | 683 | 168.7 |
| D | 2 | 232 | 847759 | 5022.2 | 704 | 683 | 168.7 |
| D | 1 | 7 | 256196 | 1514.9 | 704 | 683 | 168.7 |
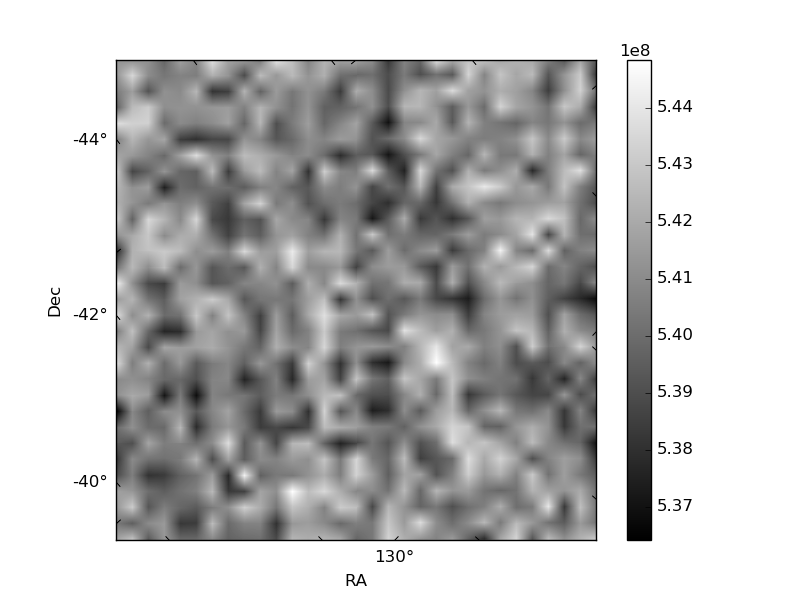
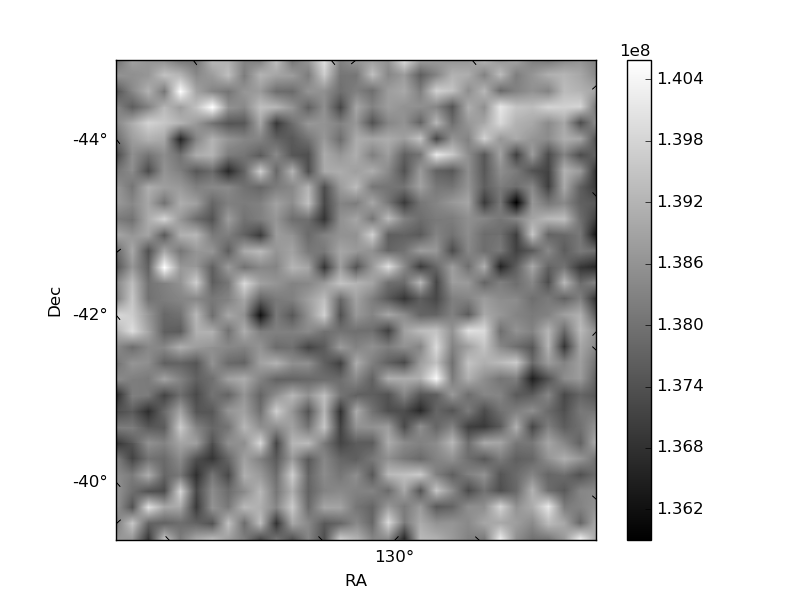
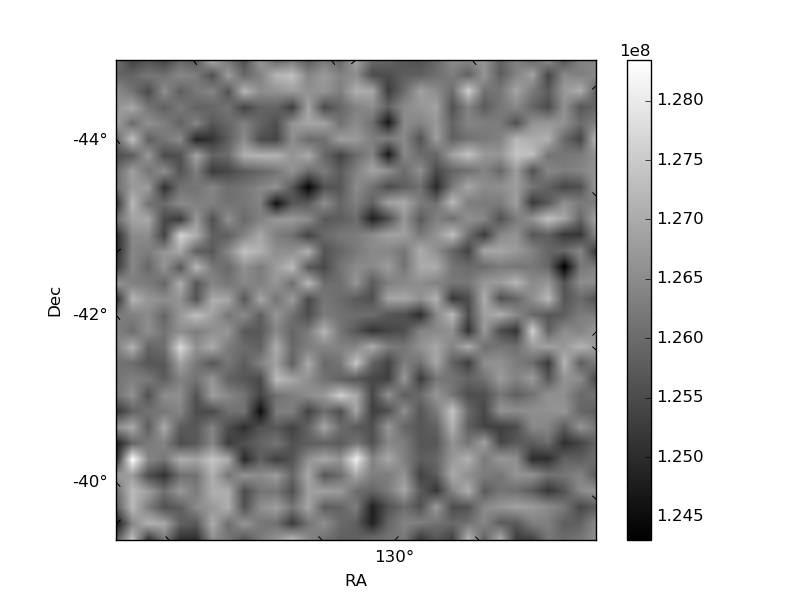
Histogram calculated using DETX and DETY for each event in the final _common_clean file
| Quadrant A | 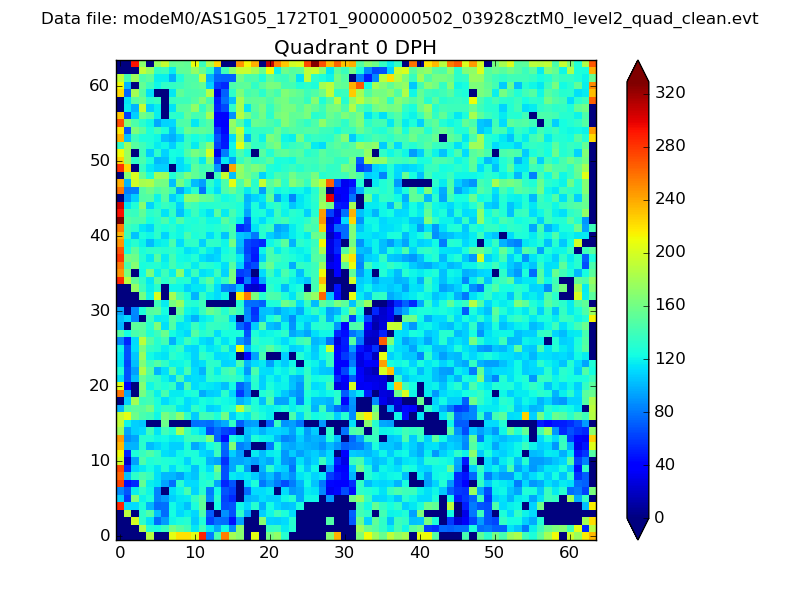 |
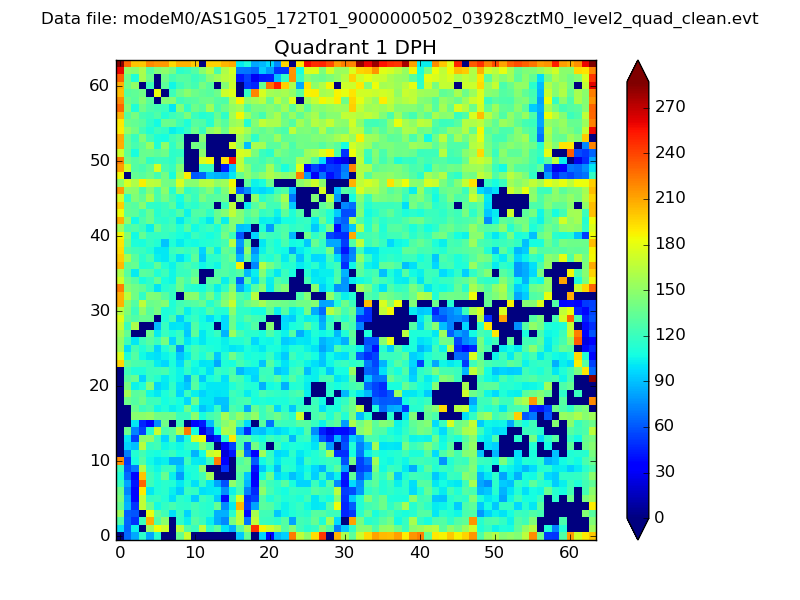 |
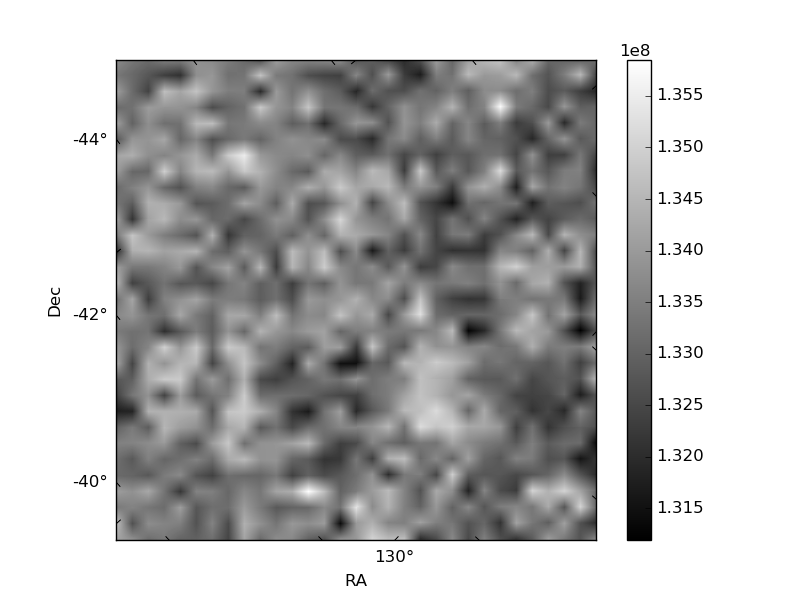
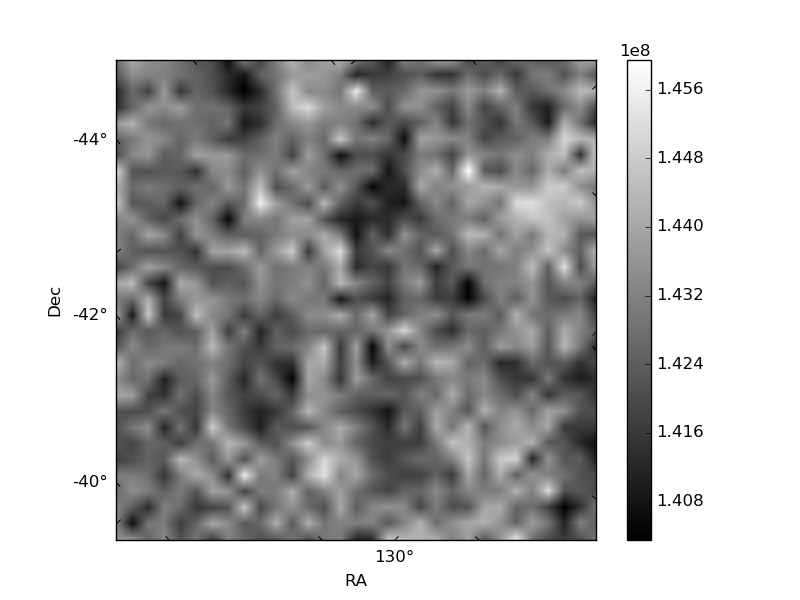
Quadrant B |
|---|---|---|---|
| Quadrant D |  |
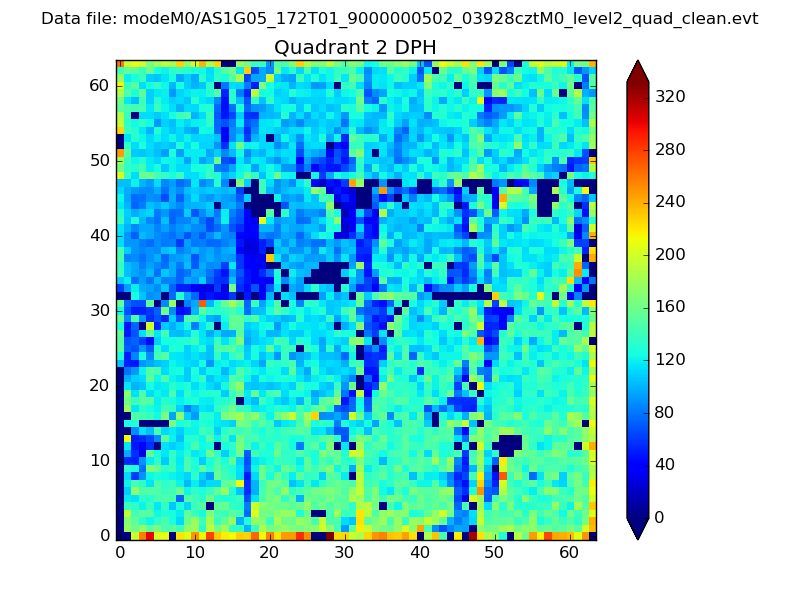 |
Quadrant C |
| Plot type | Count rate plots | Images |
|---|---|---|
| Comparison with Poisson distribution Blue bars denote a histogram of data divided into 1 sec bins. Red curve is a Poisson curve with rate = median count rate of data. |
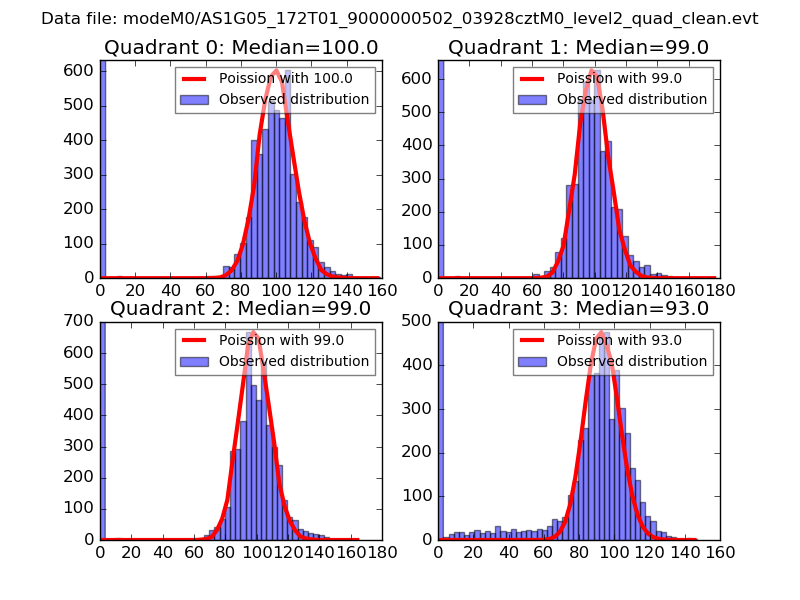 |
 |
| Quadrant-wise count rates Data is divided into 100 sec bins |
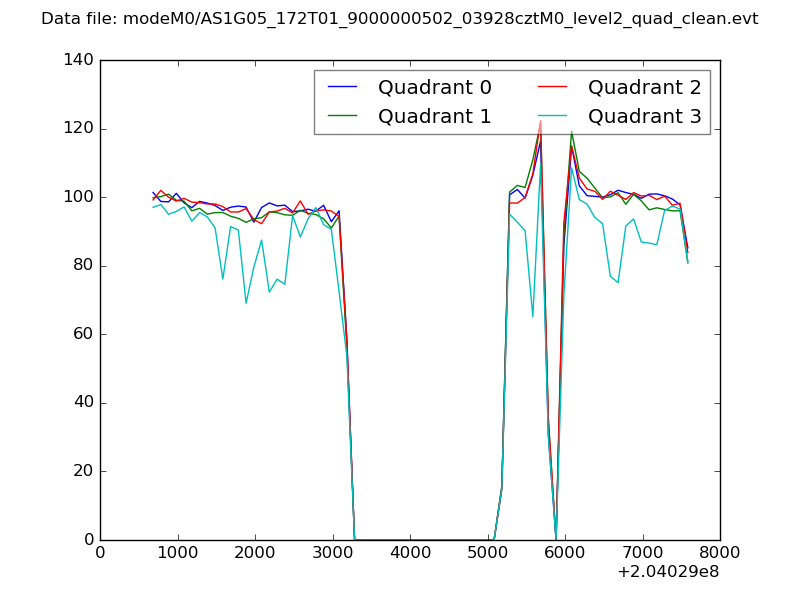 |
|
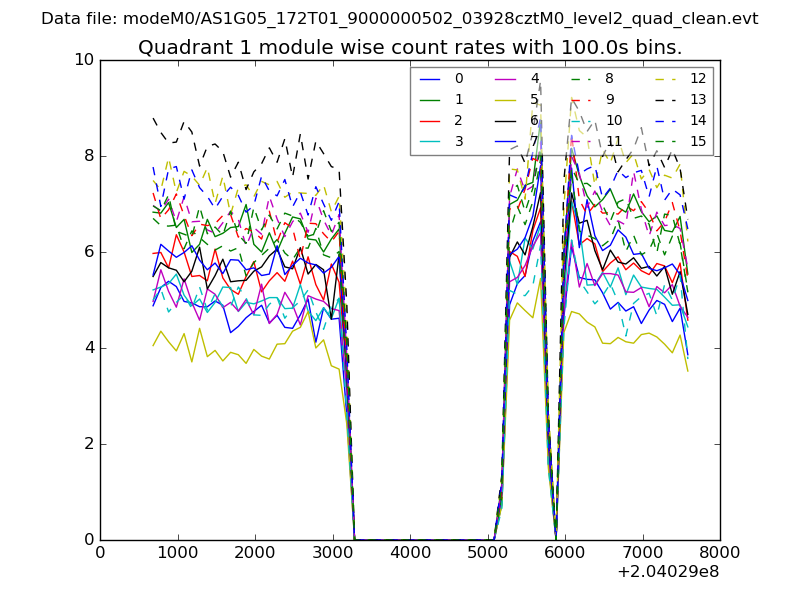
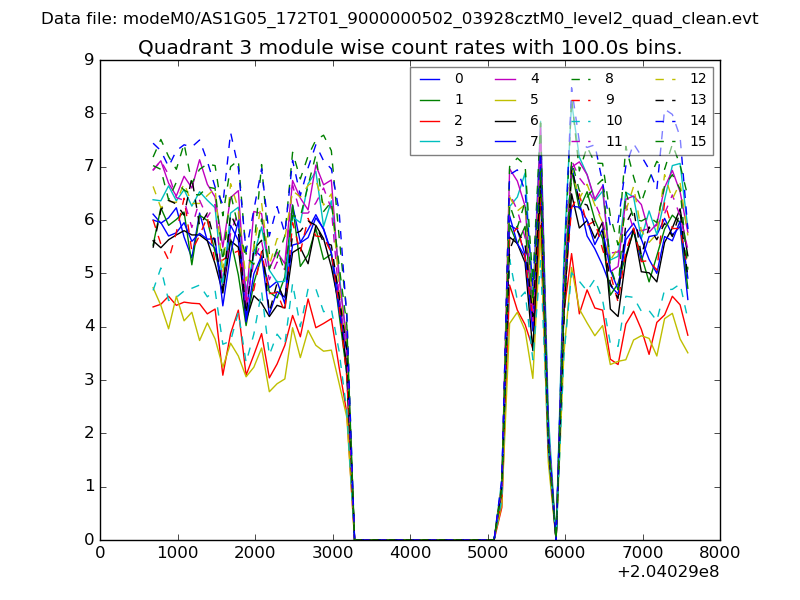
| Module-wise count rates for Quadrant A Data is divided into 100 sec bins |
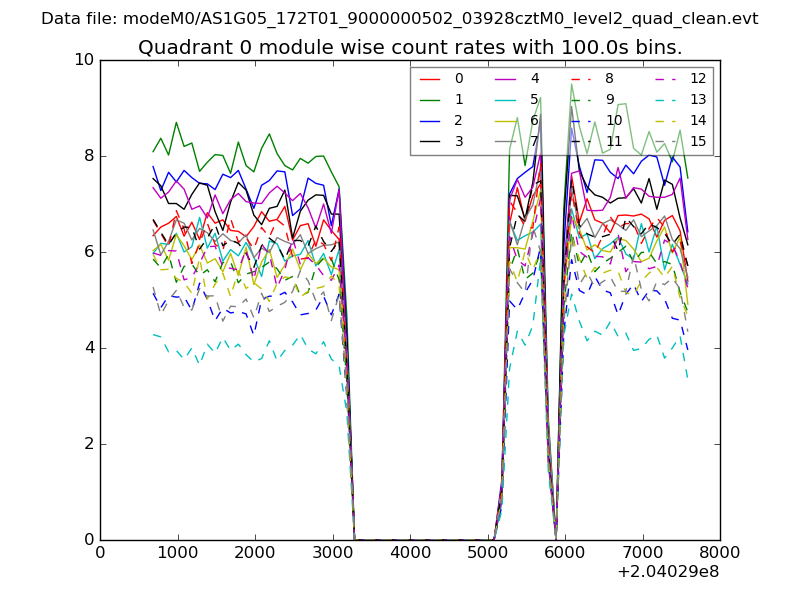 |
 |
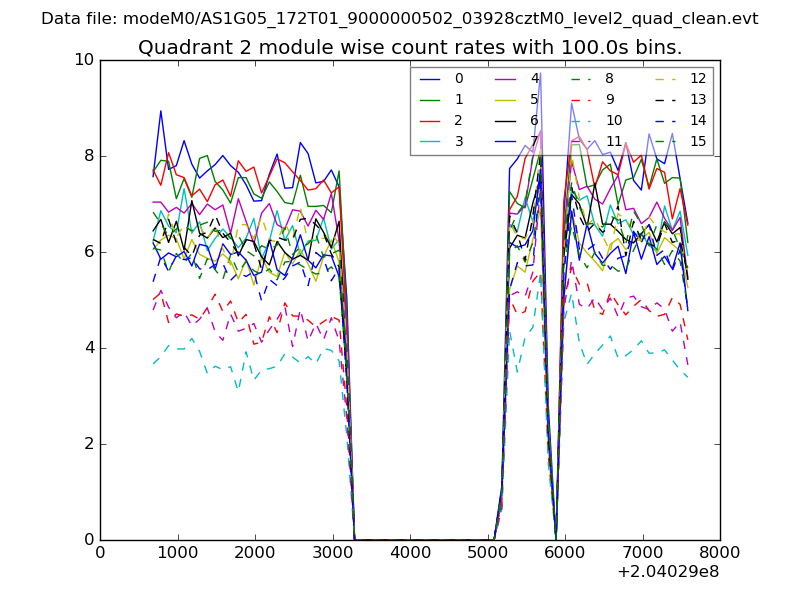
| Module-wise count rates for Quadrant B Data is divided into 100 sec bins |
 |
 |
| Module-wise count rates for Quadrant C Data is divided into 100 sec bins |
 |
 |
| Module-wise count rates for Quadrant D Data is divided into 100 sec bins |
 |
 |
| Parameter | Plot |
|---|---|
| CZT HV Monitor | 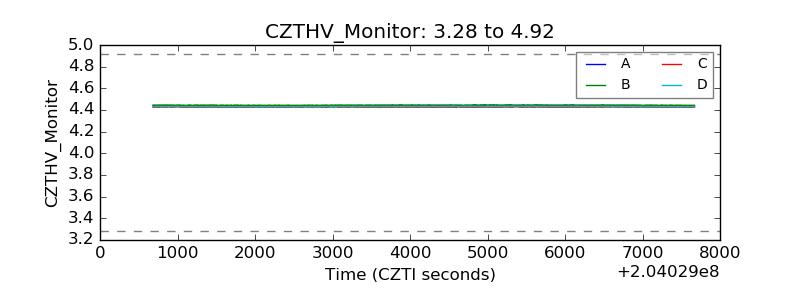 |
| D_VDD | 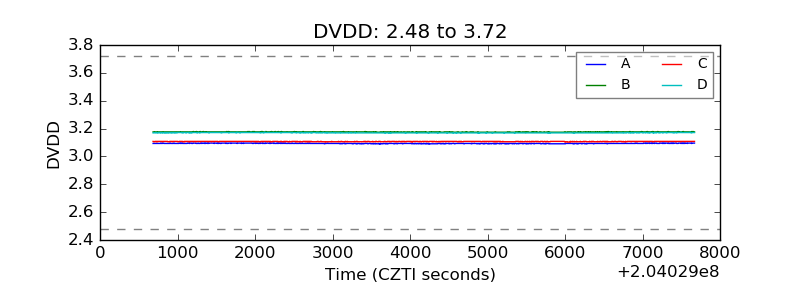 |
| Temperature 1 | 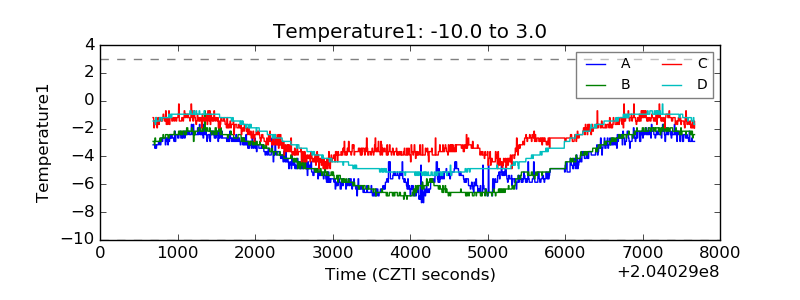 |
| Veto HV Monitor | 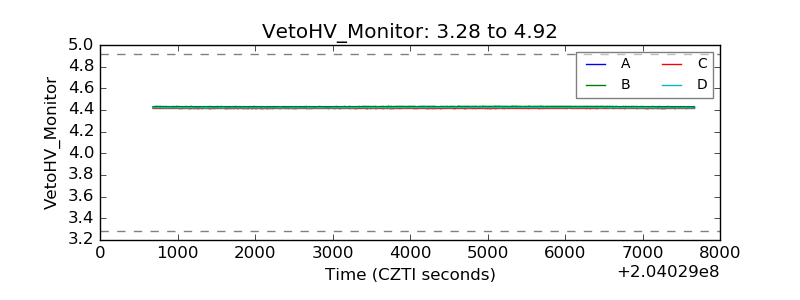 |
| Veto LLD | 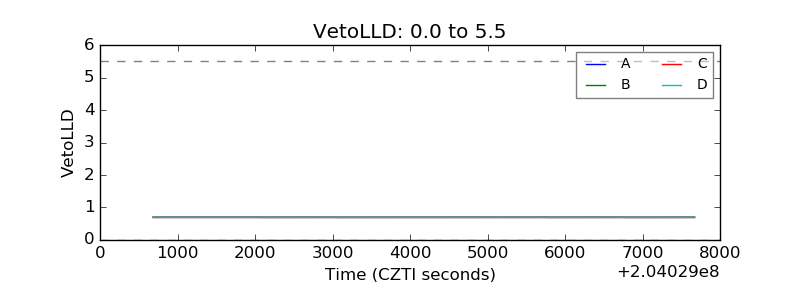 |
| Alpha Counter | 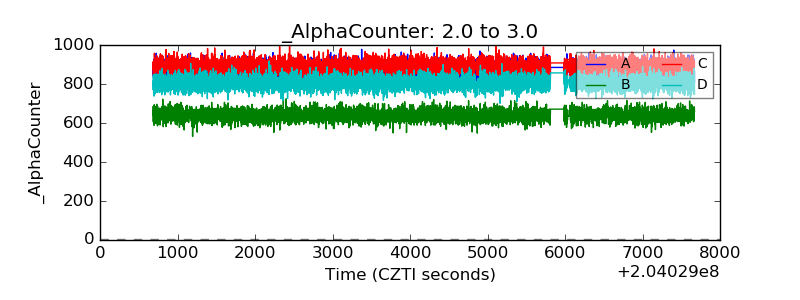 |
| _CPM_Rate | 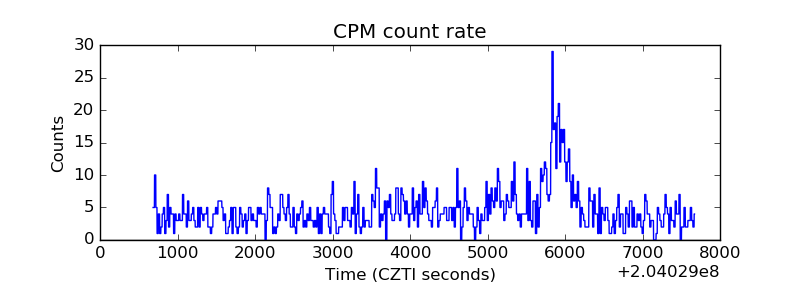 |
| CZT Counter | 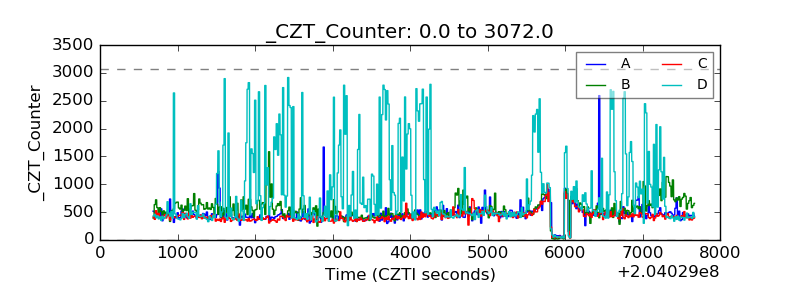 |
| +2.5 Volts monitor |  |
| +5 Volts monitor |  |
| Veto Counter | 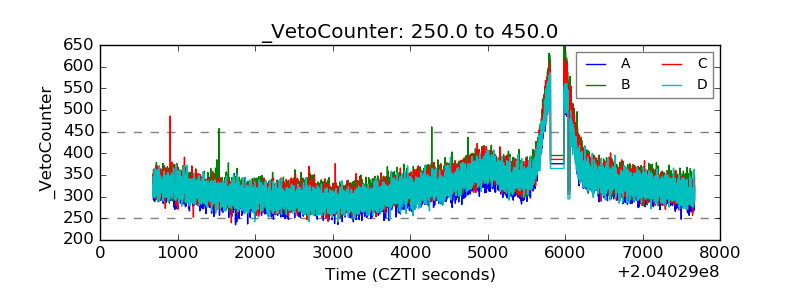 |