| Param | Original file | Final file |
|---|---|---|
| Filename | modeM0/AS1G05_172T01_9000000502_03930cztM0_level2.evt | modeM0/AS1G05_172T01_9000000502_03930cztM0_level2_quad_clean.evt |
| Size (bytes) | 437,448,960 | 67,965,120 |
| Size | 417.2 MB | 64.8 MB |
| Events in quadrant A | 2,818,013 | 416,305 |
| Events in quadrant B | 3,750,108 | 410,200 |
| Events in quadrant C | 2,630,543 | 414,112 |
| Events in quadrant D | 3,632,802 | 388,912 |
| Mode SS | |||
|---|---|---|---|
| Quadrant | BADHDUFLAG | Total packets | Discarded packets |
| A | 0 | 126 | 2 |
| B | 0 | 126 | 0 |
| C | 0 | 126 | 0 |
| D | 0 | 126 | 0 |
| Mode M9 | |||
|---|---|---|---|
| Quadrant | BADHDUFLAG | Total packets | Discarded packets |
| A | 0 | 4 | 0 |
| B | 0 | 4 | 0 |
| C | 0 | 4 | 0 |
| D | 0 | 4 | 0 |
| Mode M0 | |||
|---|---|---|---|
| Quadrant | BADHDUFLAG | Total packets | Discarded packets |
| A | 0 | 12713 | 25 |
| B | 0 | 15113 | 32 |
| C | 0 | 12464 | 14 |
| D | 0 | 15413 | 31 |
| Quadrant | Total seconds | Saturated seconds | Saturation percentage |
|---|---|---|---|
| A | 6129 | 62 | 1.011584% |
| B | 6128 | 78 | 1.272846% |
| C | 6133 | 13 | 0.211968% |
| D | 6130 | 289 | 4.714519% |
Noise dominated data is calculated using 1-second bins in cleaned event files. If a bin has >2000 counts, and if more than 50% of those come from <1% of pixels, then it is considered to be noise-dominated and hence unusable.
| Quadrant | # 1 sec bins | Bins with >0 counts | Bins with >2000 counts | High rate bins dominated by noise | Noise dominated (total time) | Noise dominated (detector-on time) | Marked lightcurve |
|---|---|---|---|---|---|---|---|
| A | 6569 | 6140 | 2 | 2 | 0.03% | 0.03% | 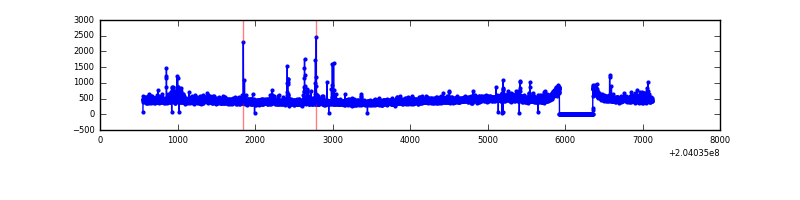 |
| B | 6569 | 6140 | 9 | 9 | 0.14% | 0.15% | 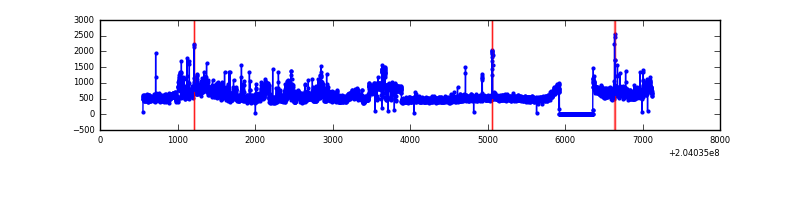 |
| C | 6569 | 6140 | 0 | 0 | 0.00% | 0.00% | 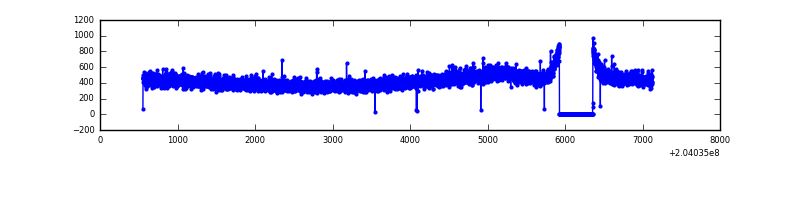 |
| D | 6569 | 6140 | 206 | 206 | 3.14% | 3.36% | 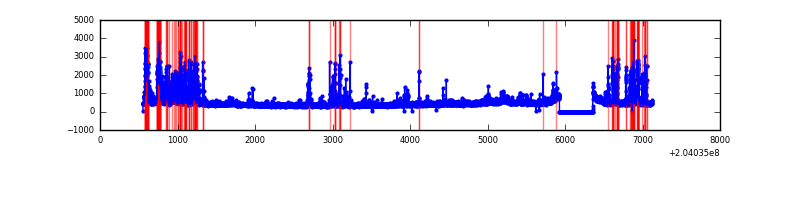 |
Top three noisy pixels from each quadrant. If the there are fewer than three noisy pixels in the level2.evt file, extra rows are filled as -1
| Pixel properties | Quadrant properties | ||||||
|---|---|---|---|---|---|---|---|
| Quadrant | DetID | PixID | Counts | Sigma | Mean | Median | Sigma |
| A | 0 | 118 | 53600 | 368.26 | 695 | 680 | 143.7 |
| A | 0 | 50 | 30339 | 206.39 | 695 | 680 | 143.7 |
| A | 15 | 174 | 12902 | 85.05 | 695 | 680 | 143.7 |
| B | 3 | 0 | 717912 | 5291.77 | 696 | 679 | 135.5 |
| B | 15 | 204 | 94323 | 690.91 | 696 | 679 | 135.5 |
| B | 14 | 167 | 84399 | 617.69 | 696 | 679 | 135.5 |
| C | 10 | 65 | 5911 | 33.29 | 671 | 673 | 157.4 |
| C | 13 | 61 | 5602 | 31.32 | 671 | 673 | 157.4 |
| C | 14 | 238 | 1858 | 7.53 | 671 | 673 | 157.4 |
| D | 2 | 232 | 670412 | 4213.26 | 657 | 637 | 159.0 |
| D | 1 | 7 | 179474 | 1124.98 | 657 | 637 | 159.0 |
| D | 4 | 160 | 169420 | 1061.74 | 657 | 637 | 159.0 |
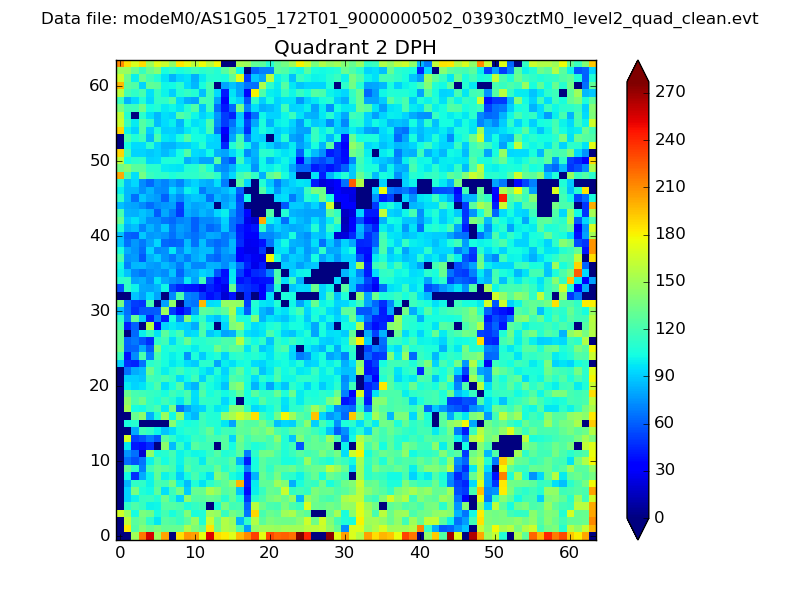
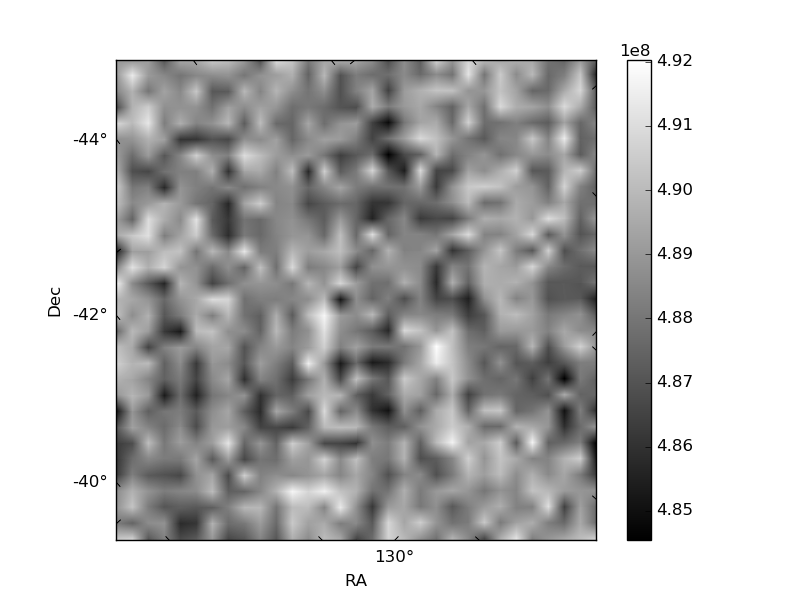
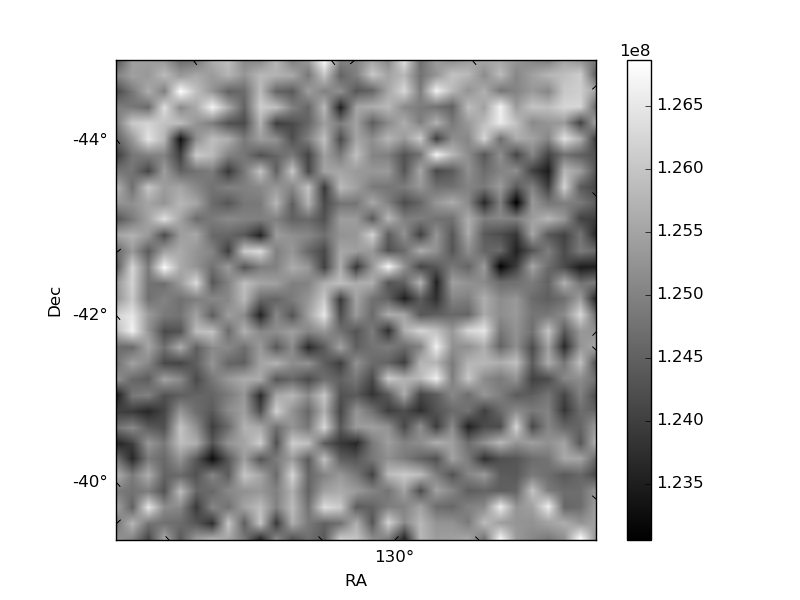
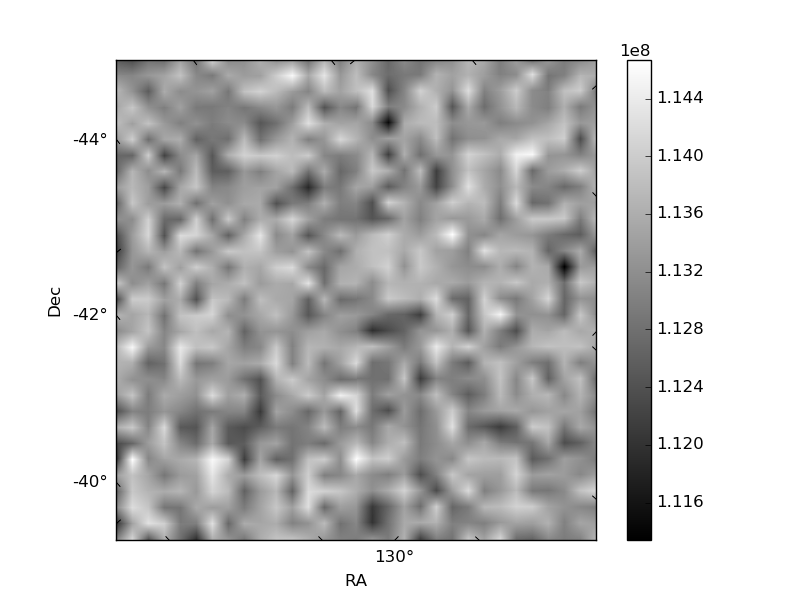
Histogram calculated using DETX and DETY for each event in the final _common_clean file
| Quadrant A | 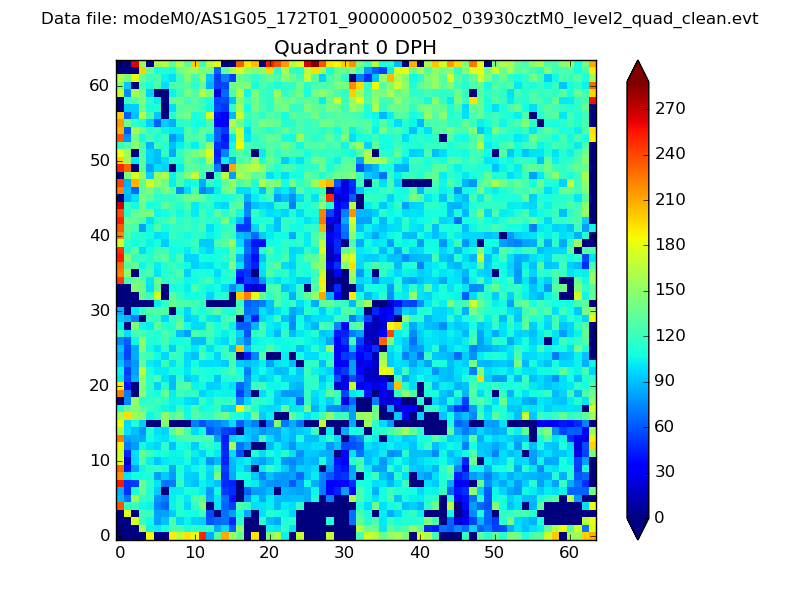 |
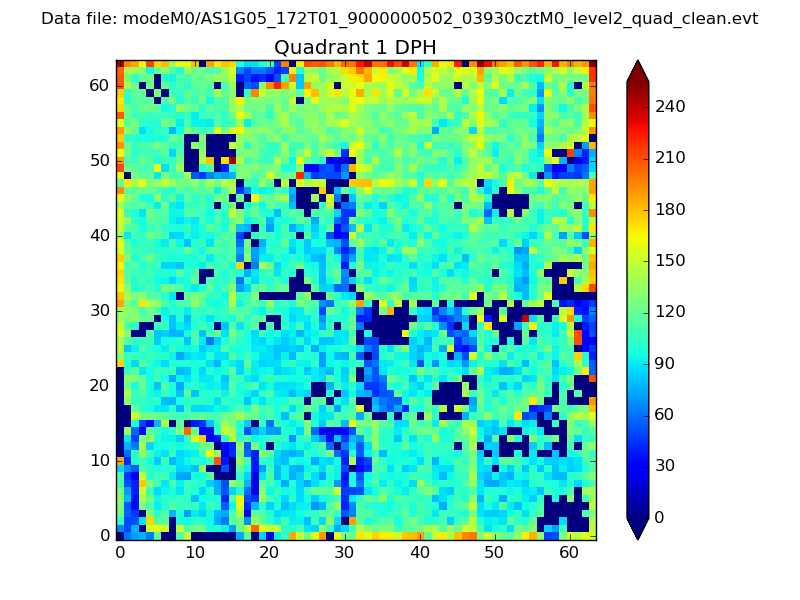 |
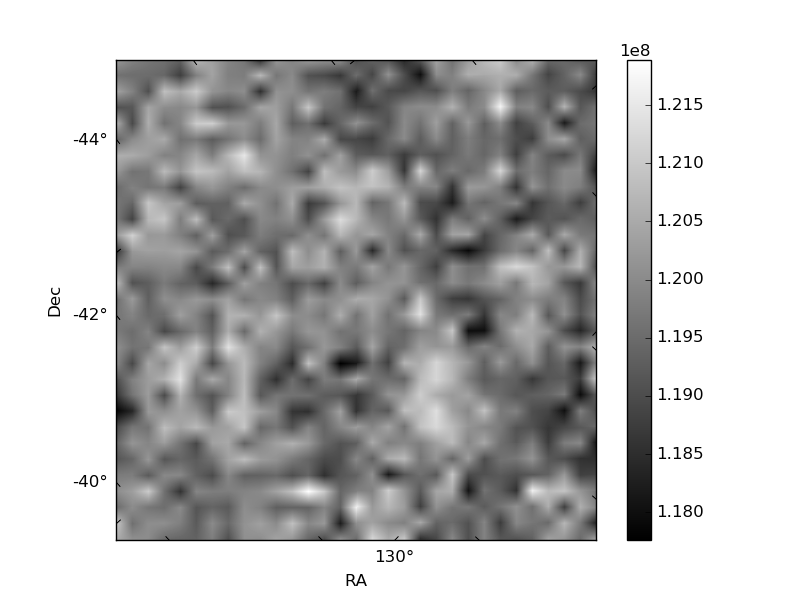
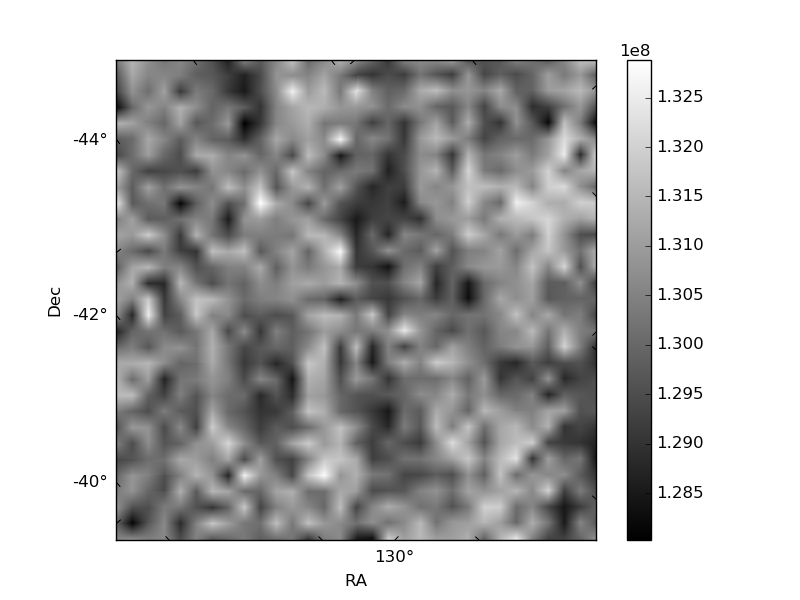
Quadrant B |
|---|---|---|---|
| Quadrant D | 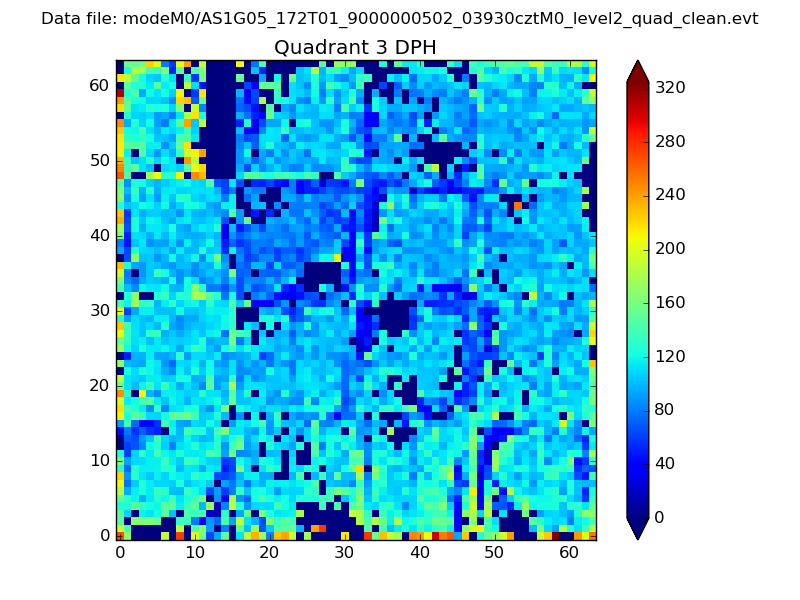 |
 |
Quadrant C |
| Plot type | Count rate plots | Images |
|---|---|---|
| Comparison with Poisson distribution Blue bars denote a histogram of data divided into 1 sec bins. Red curve is a Poisson curve with rate = median count rate of data. |
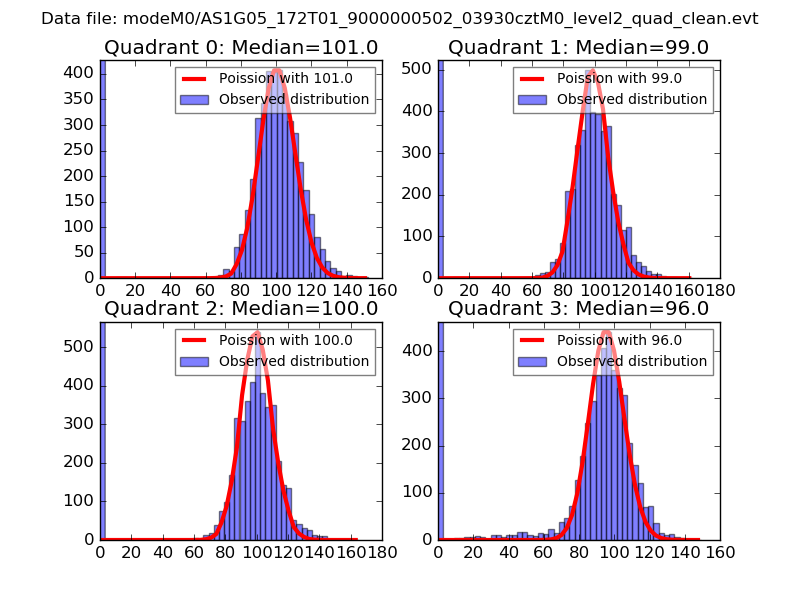 |
 |
| Quadrant-wise count rates Data is divided into 100 sec bins |
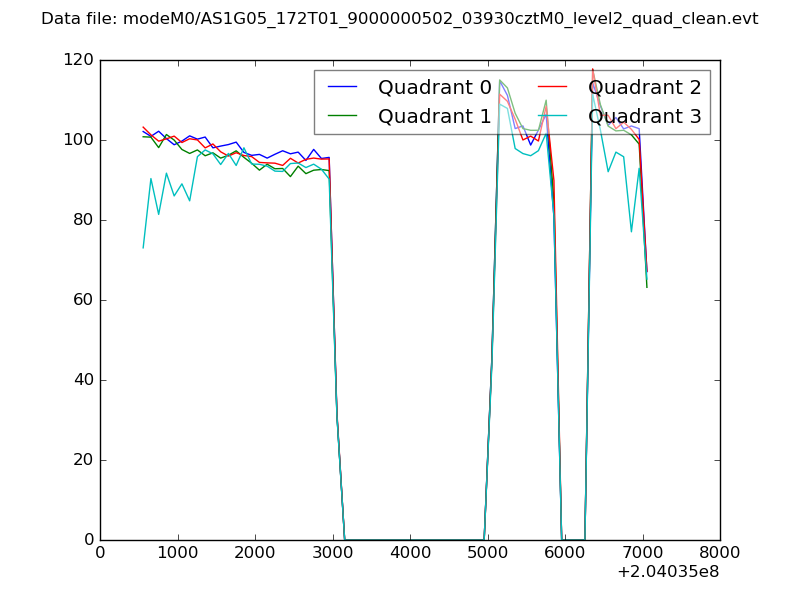 |
|
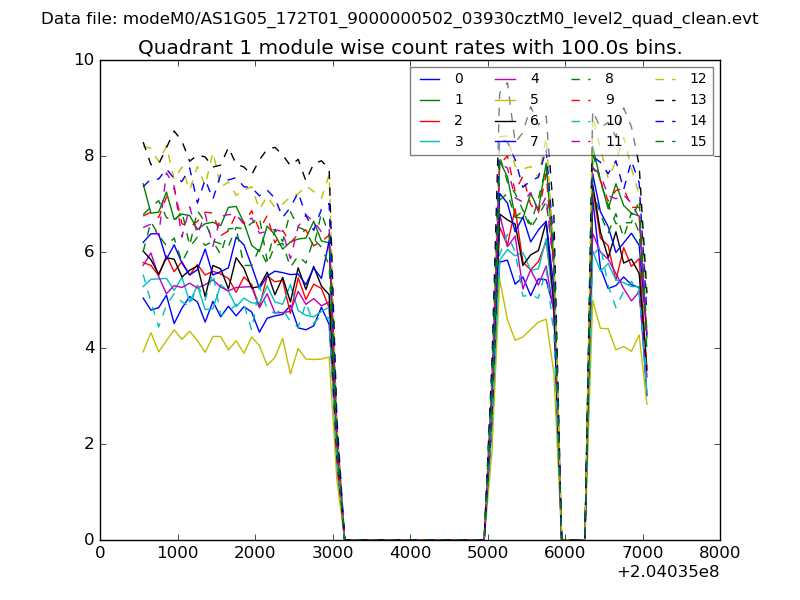
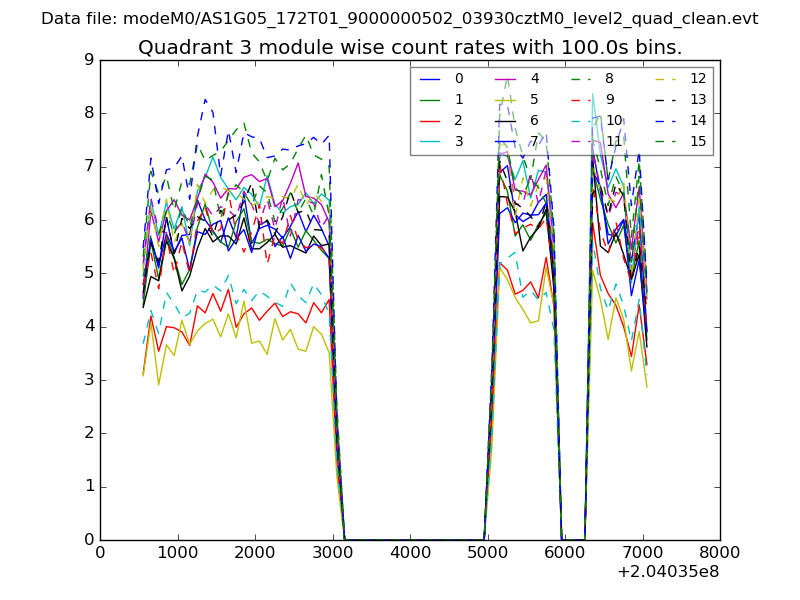
| Module-wise count rates for Quadrant A Data is divided into 100 sec bins |
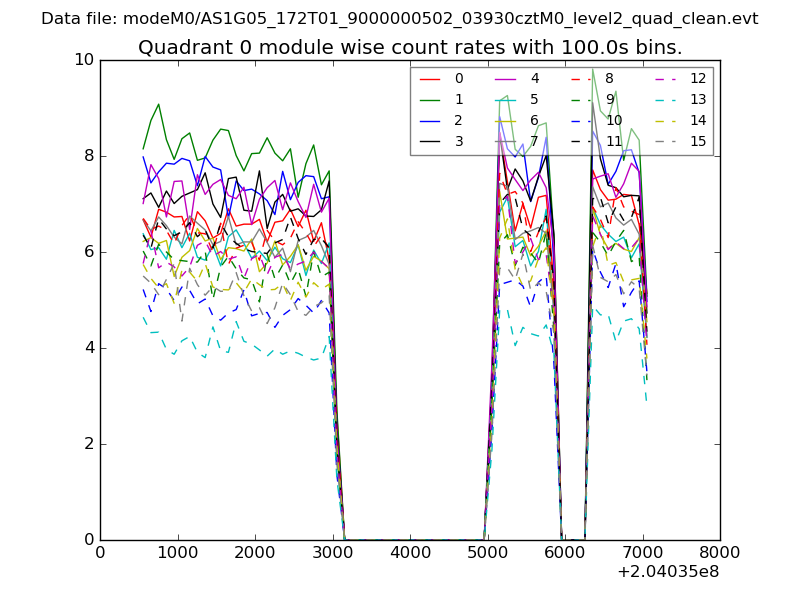 |
 |
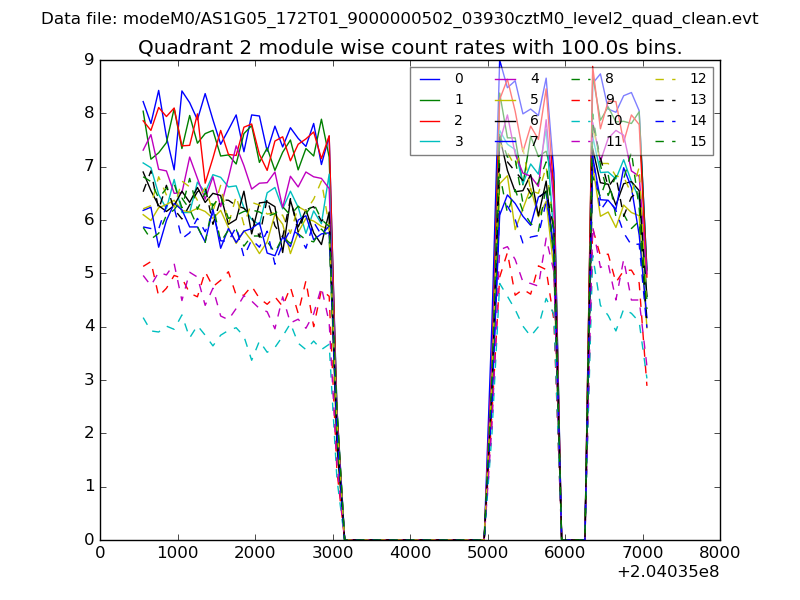
| Module-wise count rates for Quadrant B Data is divided into 100 sec bins |
 |
 |
| Module-wise count rates for Quadrant C Data is divided into 100 sec bins |
 |
 |
| Module-wise count rates for Quadrant D Data is divided into 100 sec bins |
 |
 |
| Parameter | Plot |
|---|---|
| CZT HV Monitor | 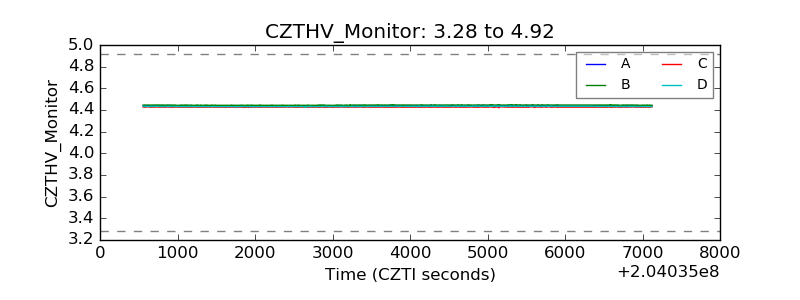 |
| D_VDD | 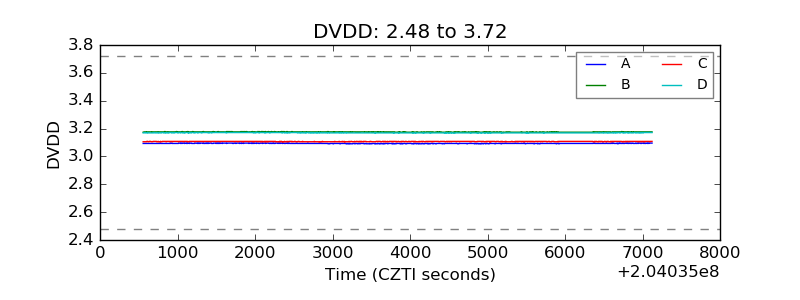 |
| Temperature 1 | 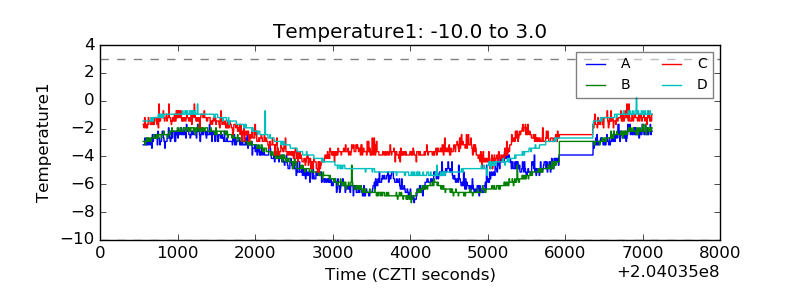 |
| Veto HV Monitor | 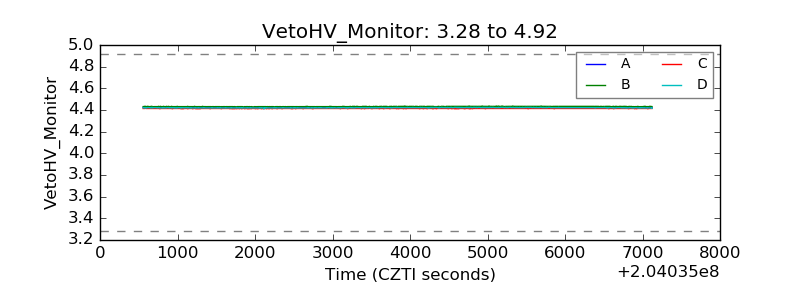 |
| Veto LLD | 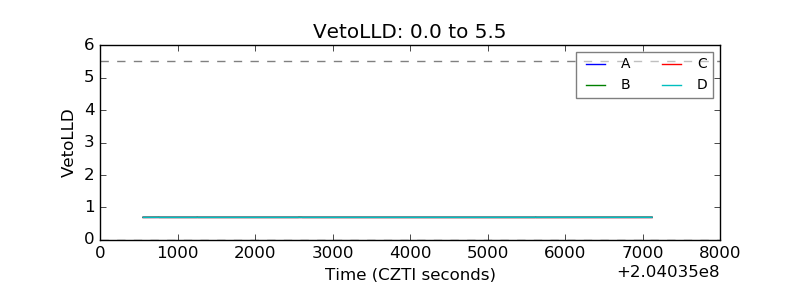 |
| Alpha Counter | 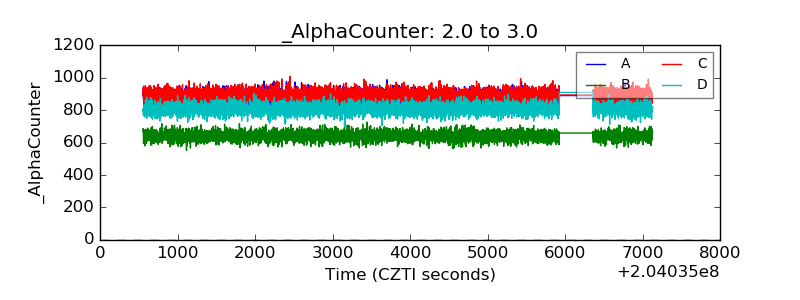 |
| _CPM_Rate | 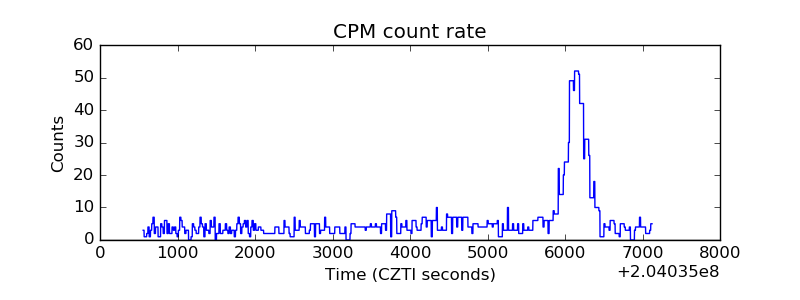 |
| CZT Counter | 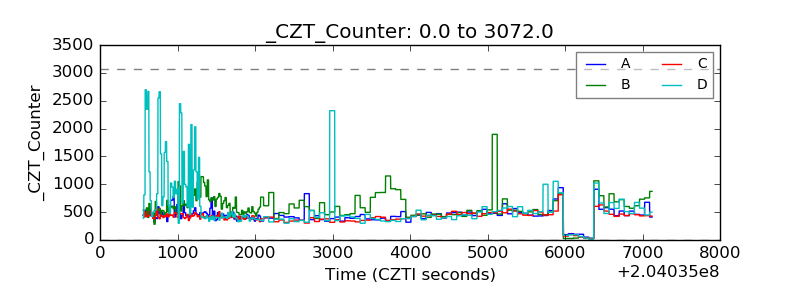 |
| +2.5 Volts monitor |  |
| +5 Volts monitor |  |
| Veto Counter | 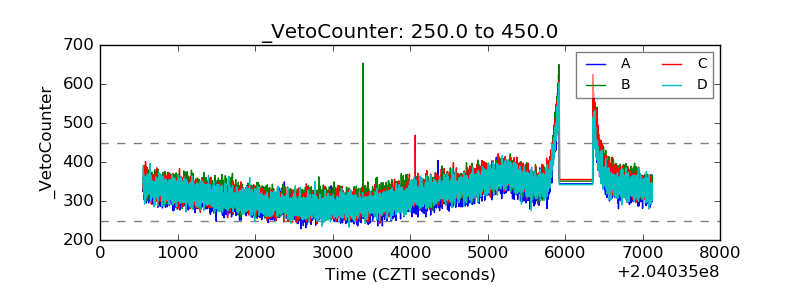 |