| Param | Original file | Final file |
|---|---|---|
| Filename | modeM0/AS1G05_172T01_9000000502_03931cztM0_level2.evt | modeM0/AS1G05_172T01_9000000502_03931cztM0_level2_quad_clean.evt |
| Size (bytes) | 1,749,021,120 | 257,011,200 |
| Size | 1.6 GB | 245.1 MB |
| Events in quadrant A | 11,053,550 | 1,570,771 |
| Events in quadrant B | 14,729,804 | 1,543,231 |
| Events in quadrant C | 10,080,738 | 1,566,340 |
| Events in quadrant D | 15,512,354 | 1,479,813 |
| Mode SS | |||
|---|---|---|---|
| Quadrant | BADHDUFLAG | Total packets | Discarded packets |
| A | 0 | 482 | 0 |
| B | 0 | 482 | 0 |
| C | 0 | 482 | 0 |
| D | 0 | 482 | 0 |
| Mode M9 | |||
|---|---|---|---|
| Quadrant | BADHDUFLAG | Total packets | Discarded packets |
| A | 0 | 20 | 0 |
| B | 0 | 20 | 0 |
| C | 0 | 20 | 0 |
| D | 0 | 20 | 0 |
| Mode M0 | |||
|---|---|---|---|
| Quadrant | BADHDUFLAG | Total packets | Discarded packets |
| A | 0 | 49549 | 6 |
| B | 0 | 59161 | 8 |
| C | 0 | 47863 | 5 |
| D | 0 | 63497 | 10 |
| Quadrant | Total seconds | Saturated seconds | Saturation percentage |
|---|---|---|---|
| A | 23582 | 287 | 1.217030% |
| B | 23581 | 496 | 2.103388% |
| C | 23582 | 61 | 0.258672% |
| D | 23580 | 1556 | 6.598813% |
Noise dominated data is calculated using 1-second bins in cleaned event files. If a bin has >2000 counts, and if more than 50% of those come from <1% of pixels, then it is considered to be noise-dominated and hence unusable.
| Quadrant | # 1 sec bins | Bins with >0 counts | Bins with >2000 counts | High rate bins dominated by noise | Noise dominated (total time) | Noise dominated (detector-on time) | Marked lightcurve |
|---|---|---|---|---|---|---|---|
| A | 25697 | 23587 | 52 | 52 | 0.20% | 0.22% |  |
| B | 25697 | 23587 | 177 | 177 | 0.69% | 0.75% | 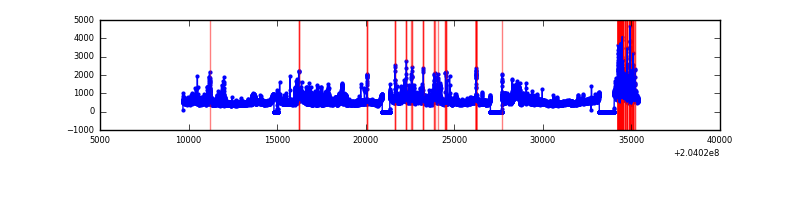 |
| C | 25697 | 23587 | 1 | 1 | 0.00% | 0.00% | 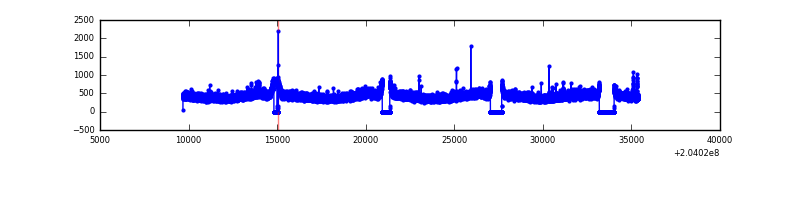 |
| D | 25697 | 23587 | 1285 | 1285 | 5.00% | 5.45% | 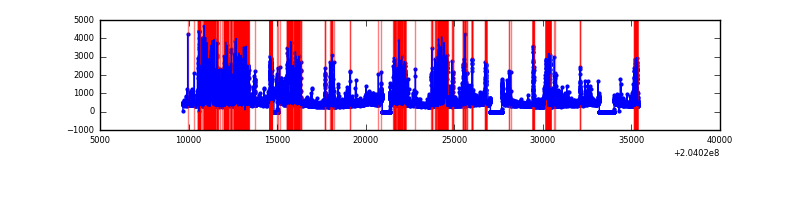 |
Top three noisy pixels from each quadrant. If the there are fewer than three noisy pixels in the level2.evt file, extra rows are filled as -1
| Pixel properties | Quadrant properties | ||||||
|---|---|---|---|---|---|---|---|
| Quadrant | DetID | PixID | Counts | Sigma | Mean | Median | Sigma |
| A | 0 | 118 | 342594 | 627.58 | 2661 | 2603 | 541.7 |
| A | 0 | 50 | 146277 | 265.2 | 2661 | 2603 | 541.7 |
| A | 13 | 251 | 85902 | 153.76 | 2661 | 2603 | 541.7 |
| B | 3 | 0 | 2658002 | 5155.42 | 2667 | 2599 | 515.1 |
| B | 15 | 204 | 592138 | 1144.58 | 2667 | 2599 | 515.1 |
| B | 10 | 16 | 541136 | 1045.56 | 2667 | 2599 | 515.1 |
| C | 10 | 65 | 39415 | 62.13 | 2559 | 2570 | 593.0 |
| C | 12 | 4 | 22482 | 33.58 | 2559 | 2570 | 593.0 |
| C | 13 | 61 | 21604 | 32.1 | 2559 | 2570 | 593.0 |
| D | 2 | 232 | 3046855 | 5105.3 | 2494 | 2420 | 596.3 |
| D | 8 | 112 | 1546231 | 2588.86 | 2494 | 2420 | 596.3 |
| D | 1 | 7 | 329446 | 548.4 | 2494 | 2420 | 596.3 |
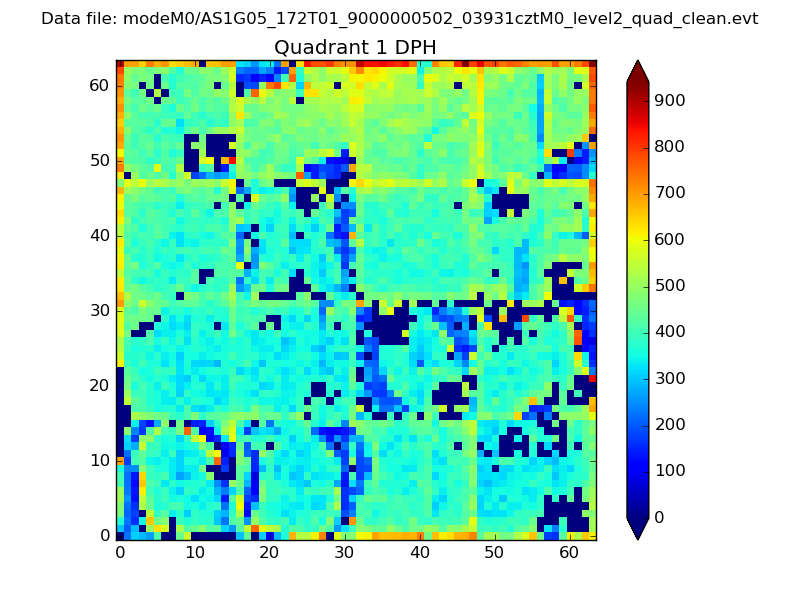
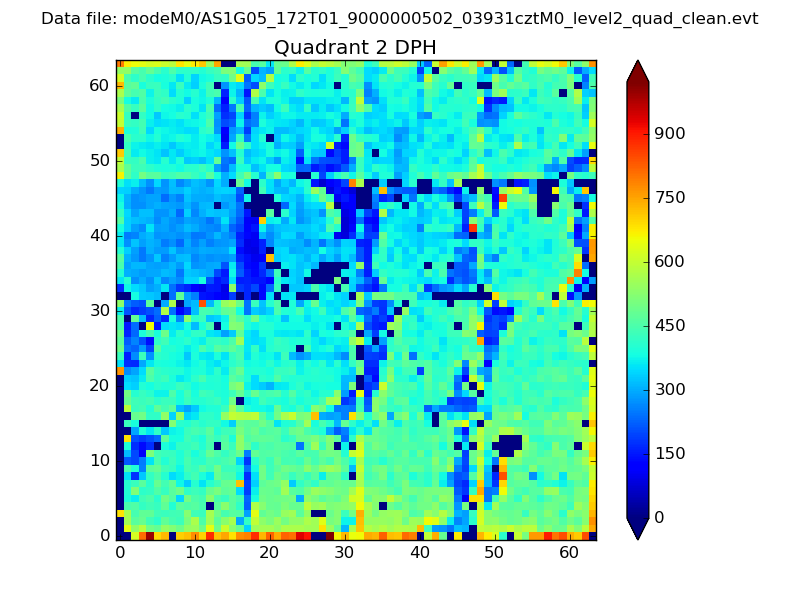
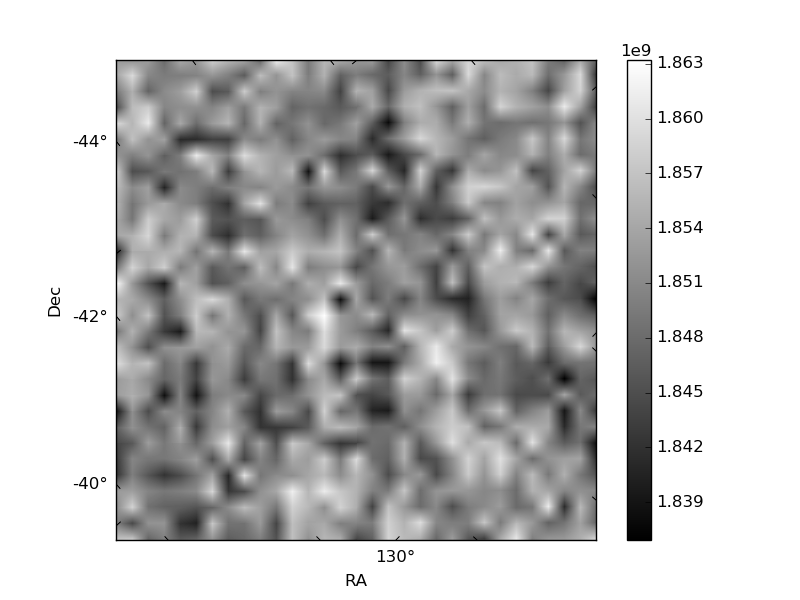
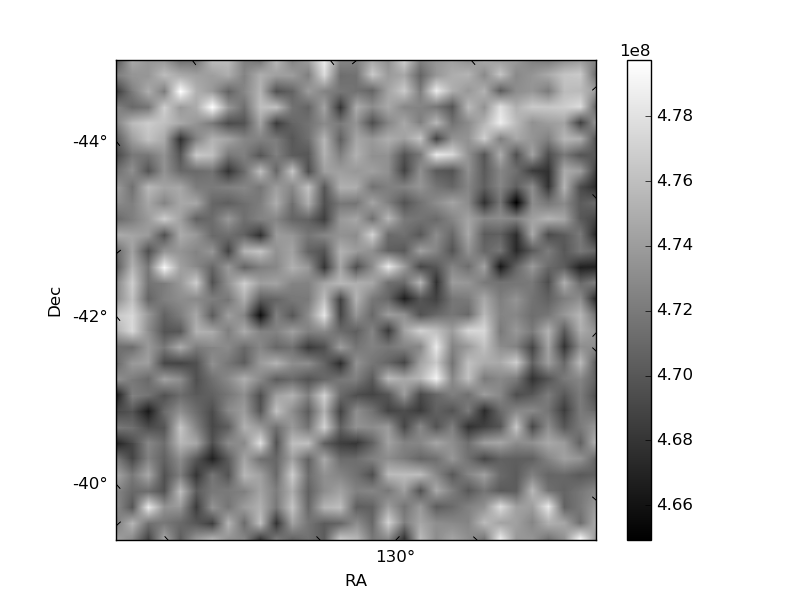
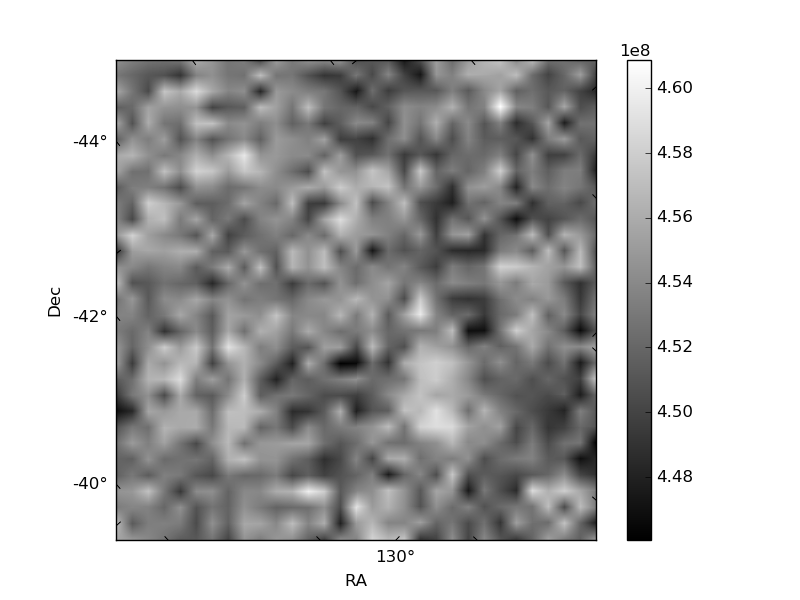
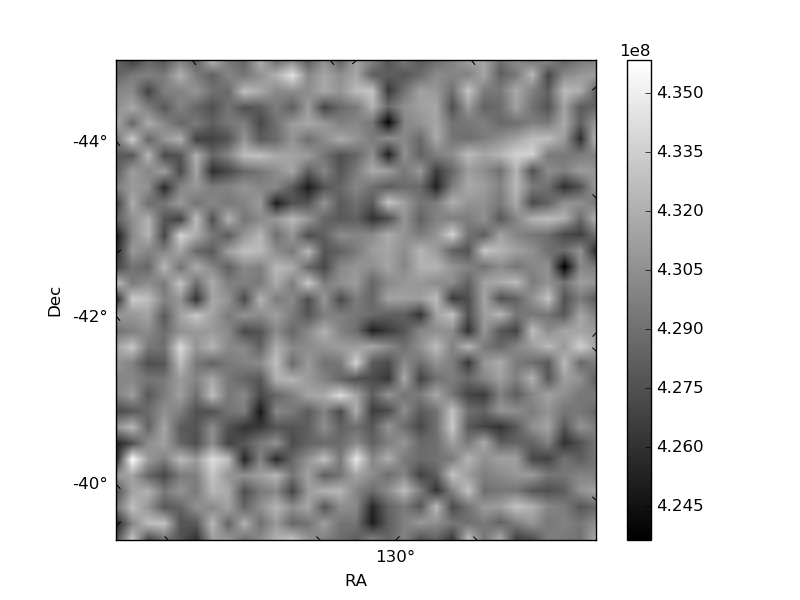
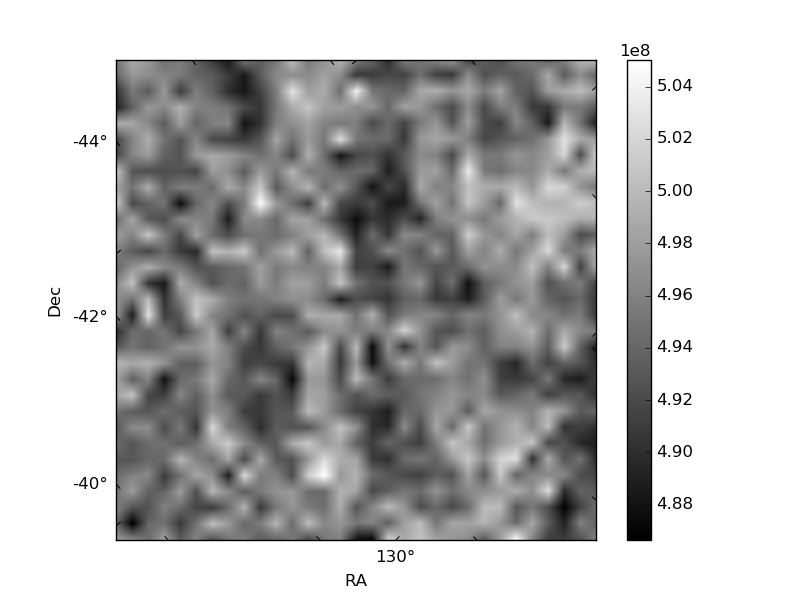
Histogram calculated using DETX and DETY for each event in the final _common_clean file
| Quadrant A | 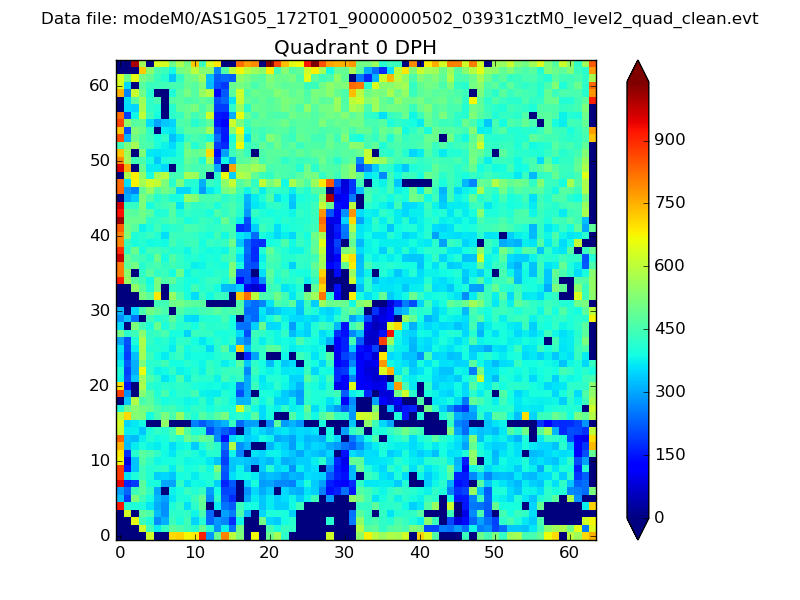 |
 |
Quadrant B |
|---|---|---|---|
| Quadrant D | 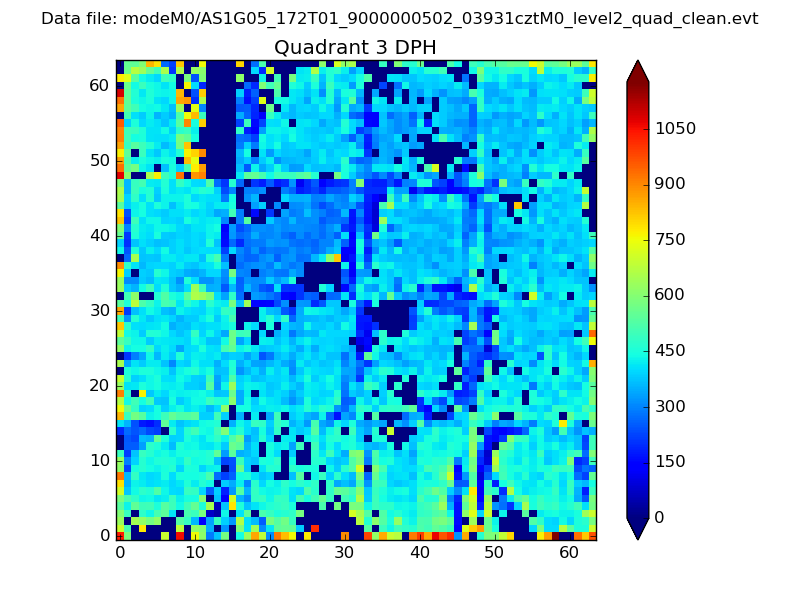 |
 |
Quadrant C |
| Plot type | Count rate plots | Images |
|---|---|---|
| Comparison with Poisson distribution Blue bars denote a histogram of data divided into 1 sec bins. Red curve is a Poisson curve with rate = median count rate of data. |
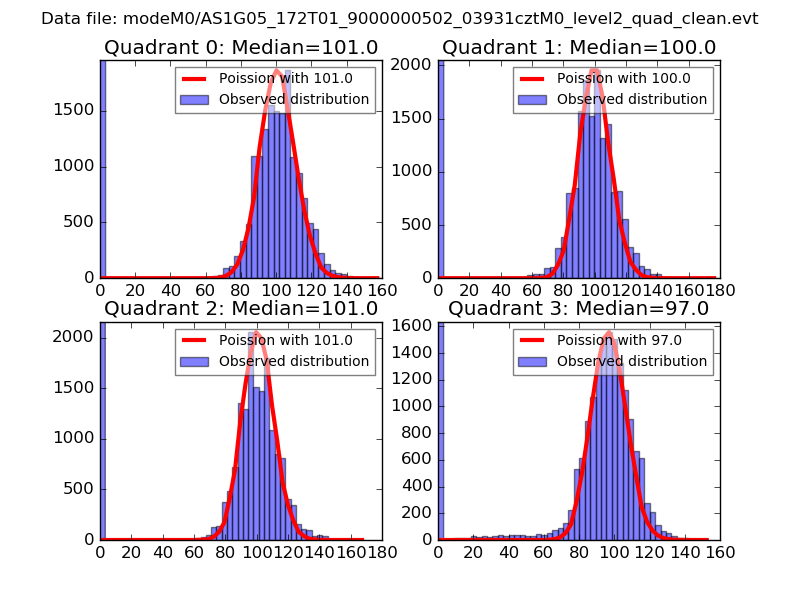 |
 |
| Quadrant-wise count rates Data is divided into 100 sec bins |
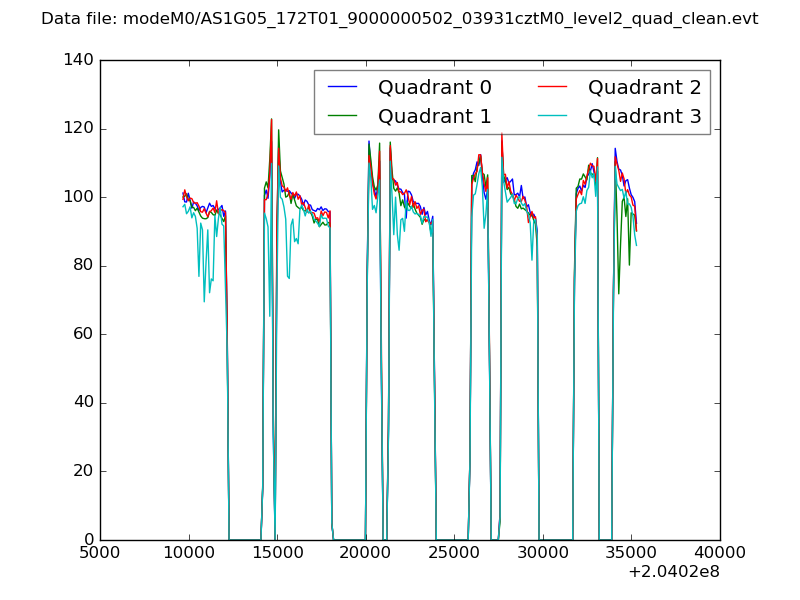 |
|
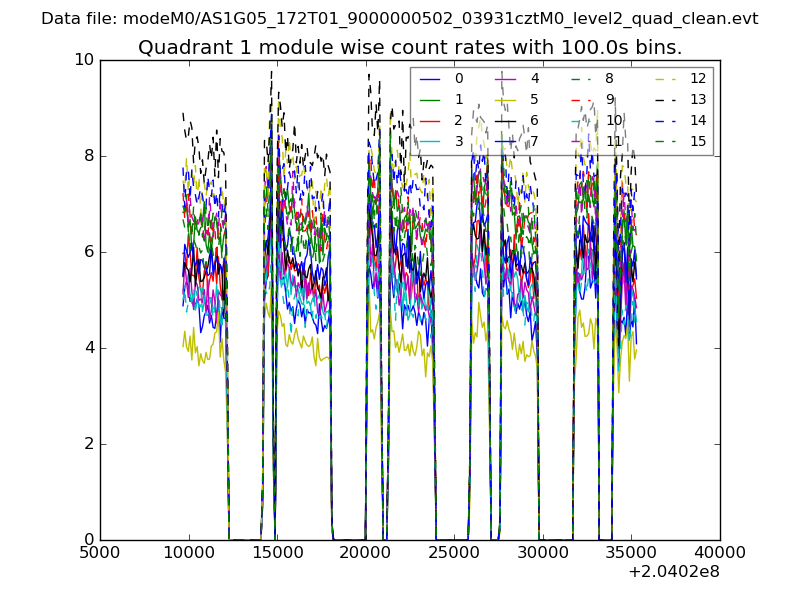
| Module-wise count rates for Quadrant A Data is divided into 100 sec bins |
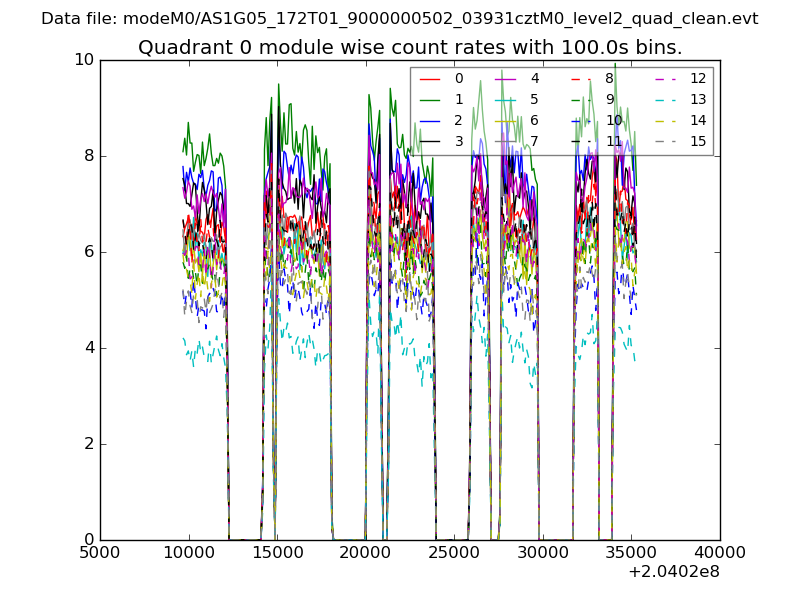 |
 |
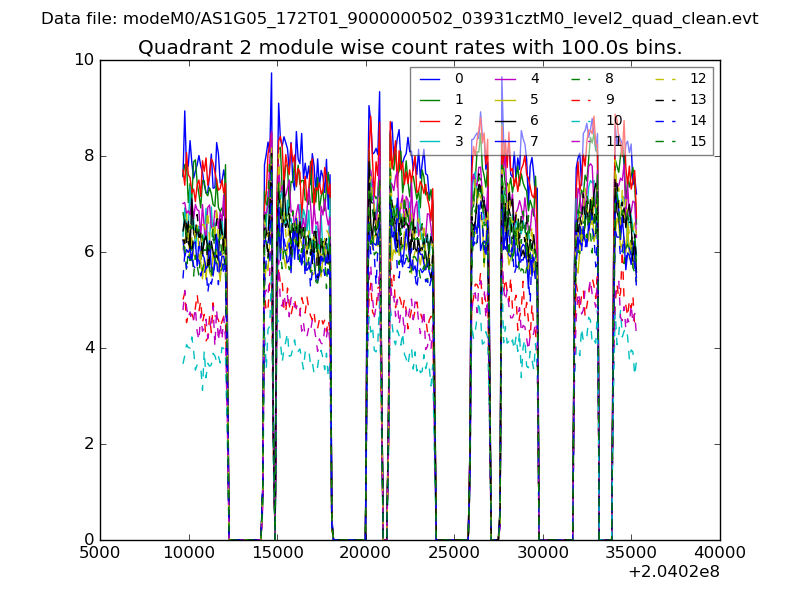
| Module-wise count rates for Quadrant B Data is divided into 100 sec bins |
 |
 |
| Module-wise count rates for Quadrant C Data is divided into 100 sec bins |
 |
 |
| Module-wise count rates for Quadrant D Data is divided into 100 sec bins |
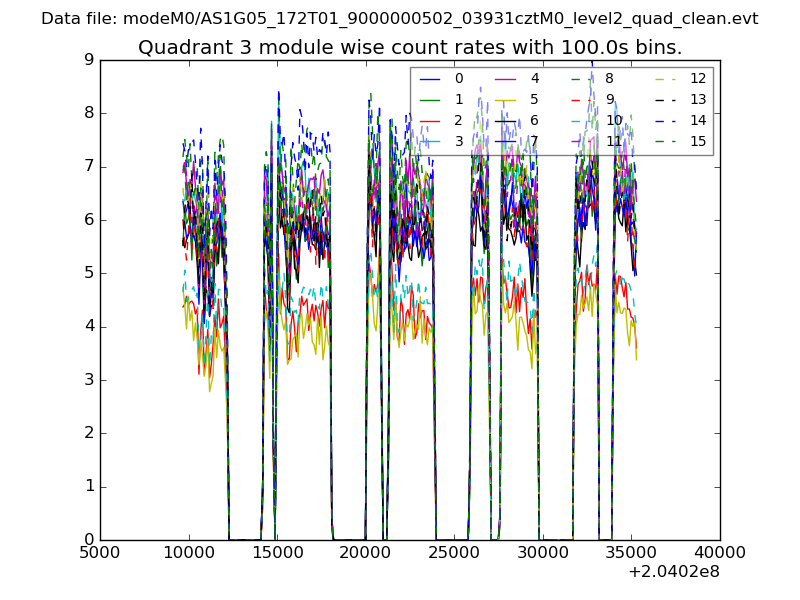 |
 |
| Parameter | Plot |
|---|---|
| CZT HV Monitor | 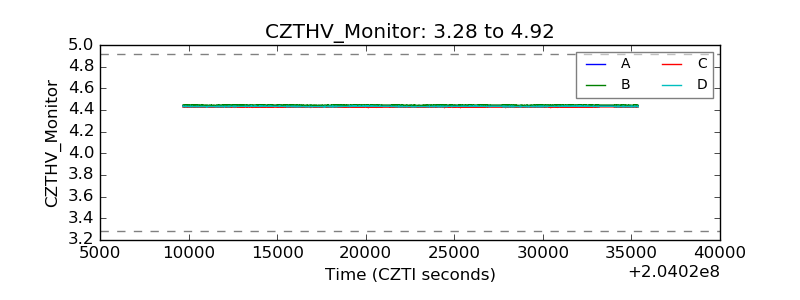 |
| D_VDD | 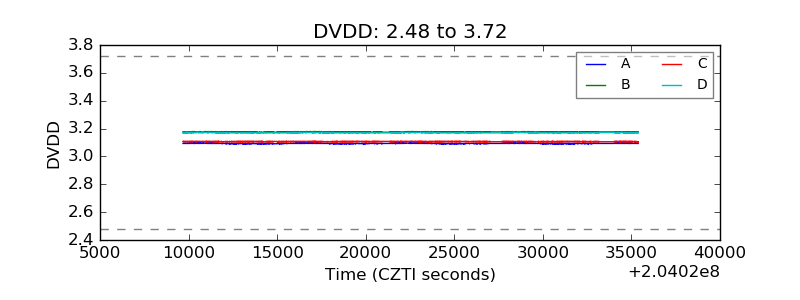 |
| Temperature 1 |  |
| Veto HV Monitor |  |
| Veto LLD | 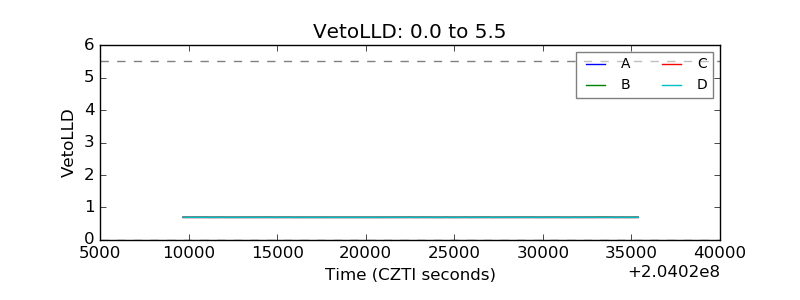 |
| Alpha Counter | 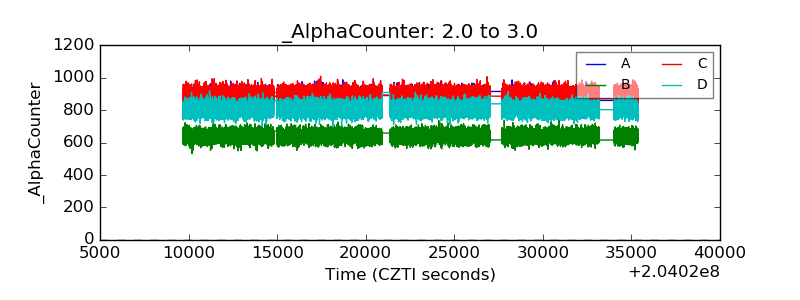 |
| _CPM_Rate | 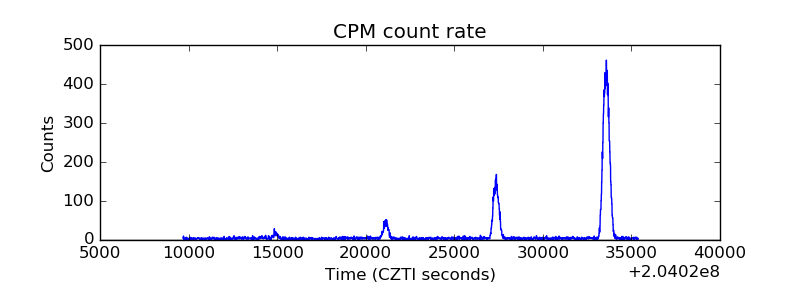 |
| CZT Counter | 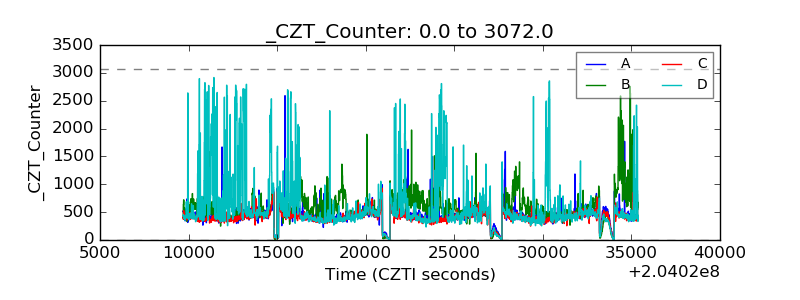 |
| +2.5 Volts monitor |  |
| +5 Volts monitor |  |
| Veto Counter | 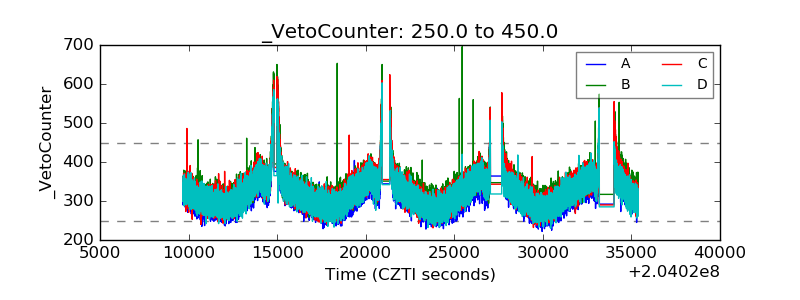 |