| Param | Original file | Final file |
|---|---|---|
| Filename | modeM0/AS1G05_172T01_9000000502_03932cztM0_level2.evt | modeM0/AS1G05_172T01_9000000502_03932cztM0_level2_quad_clean.evt |
| Size (bytes) | 586,008,000 | 73,814,400 |
| Size | 558.9 MB | 70.4 MB |
| Events in quadrant A | 3,575,012 | 455,399 |
| Events in quadrant B | 4,923,221 | 438,492 |
| Events in quadrant C | 2,838,626 | 453,369 |
| Events in quadrant D | 5,964,024 | 427,598 |
| Mode SS | |||
|---|---|---|---|
| Quadrant | BADHDUFLAG | Total packets | Discarded packets |
| A | 0 | 134 | 0 |
| B | 0 | 134 | 0 |
| C | 0 | 134 | 0 |
| D | 0 | 134 | 0 |
| Mode M9 | |||
|---|---|---|---|
| Quadrant | BADHDUFLAG | Total packets | Discarded packets |
| A | 0 | 10 | 0 |
| B | 0 | 10 | 0 |
| C | 0 | 10 | 0 |
| D | 0 | 10 | 0 |
| Mode M0 | |||
|---|---|---|---|
| Quadrant | BADHDUFLAG | Total packets | Discarded packets |
| A | 0 | 15029 | 2 |
| B | 0 | 18956 | 1 |
| C | 0 | 13424 | 1 |
| D | 0 | 22411 | 1 |
| Quadrant | Total seconds | Saturated seconds | Saturation percentage |
|---|---|---|---|
| A | 6597 | 44 | 0.666970% |
| B | 6597 | 284 | 4.304987% |
| C | 6597 | 11 | 0.166742% |
| D | 6597 | 496 | 7.518569% |
Noise dominated data is calculated using 1-second bins in cleaned event files. If a bin has >2000 counts, and if more than 50% of those come from <1% of pixels, then it is considered to be noise-dominated and hence unusable.
| Quadrant | # 1 sec bins | Bins with >0 counts | Bins with >2000 counts | High rate bins dominated by noise | Noise dominated (total time) | Noise dominated (detector-on time) | Marked lightcurve |
|---|---|---|---|---|---|---|---|
| A | 7597 | 6598 | 11 | 11 | 0.14% | 0.17% | 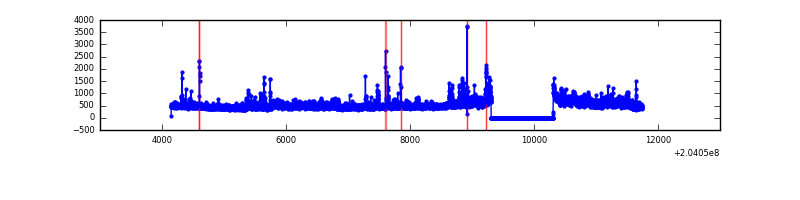 |
| B | 7597 | 6598 | 154 | 154 | 2.03% | 2.33% | 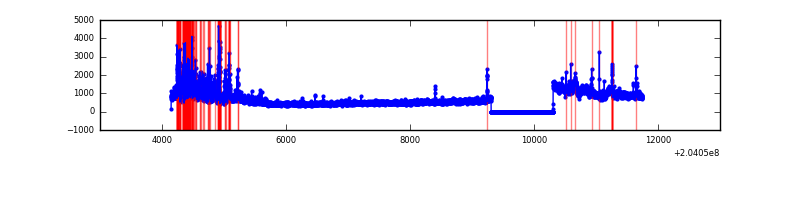 |
| C | 7597 | 6598 | 5 | 5 | 0.07% | 0.08% | 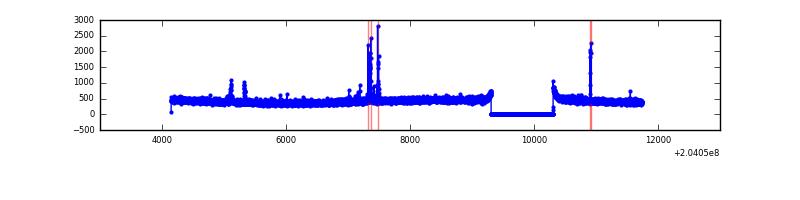 |
| D | 7597 | 6598 | 509 | 509 | 6.70% | 7.71% | 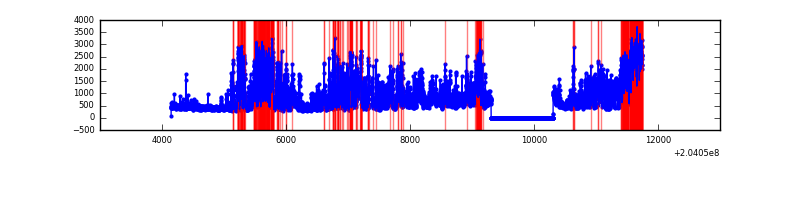 |
Top three noisy pixels from each quadrant. If the there are fewer than three noisy pixels in the level2.evt file, extra rows are filled as -1
| Pixel properties | Quadrant properties | ||||||
|---|---|---|---|---|---|---|---|
| Quadrant | DetID | PixID | Counts | Sigma | Mean | Median | Sigma |
| A | 8 | 15 | 549251 | 3597.99 | 740 | 724 | 152.5 |
| A | 0 | 118 | 100236 | 652.74 | 740 | 724 | 152.5 |
| A | 0 | 50 | 37039 | 238.2 | 740 | 724 | 152.5 |
| B | 3 | 0 | 1253077 | 8756.71 | 736 | 718 | 143.0 |
| B | 10 | 16 | 487224 | 3401.73 | 736 | 718 | 143.0 |
| B | 15 | 204 | 157417 | 1095.67 | 736 | 718 | 143.0 |
| C | 14 | 234 | 37599 | 224.1 | 708 | 711 | 164.6 |
| C | 7 | 222 | 16584 | 96.43 | 708 | 711 | 164.6 |
| C | 12 | 4 | 10603 | 60.09 | 708 | 711 | 164.6 |
| D | 9 | 82 | 1622172 | 9656.17 | 688 | 667 | 167.9 |
| D | 2 | 63 | 772045 | 4593.61 | 688 | 667 | 167.9 |
| D | 2 | 232 | 733239 | 4362.52 | 688 | 667 | 167.9 |
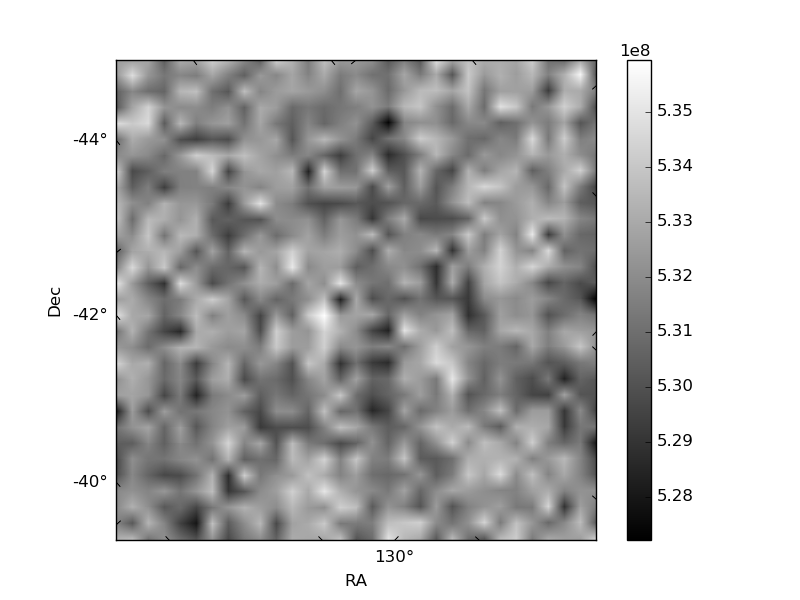
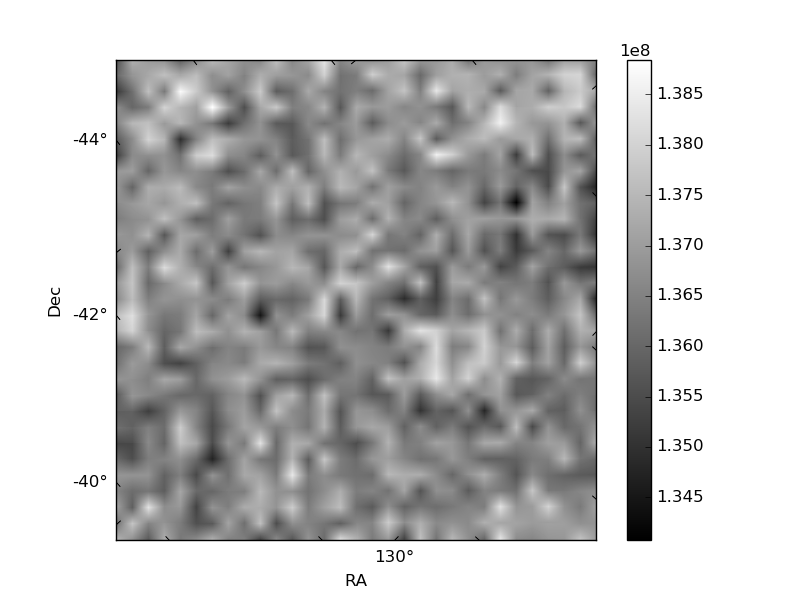
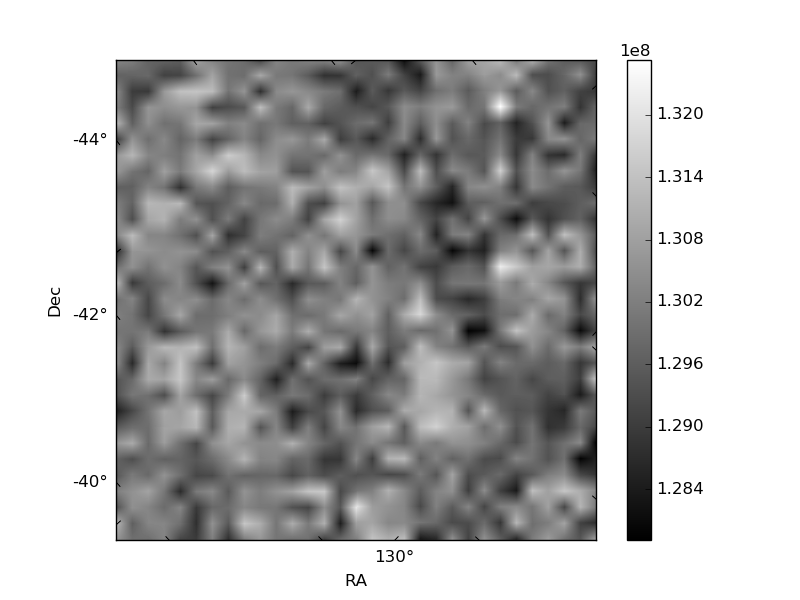
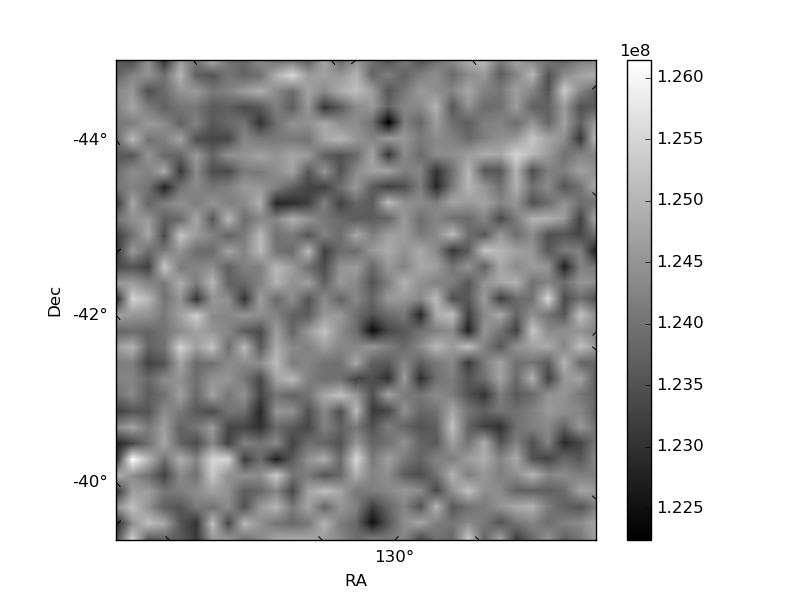
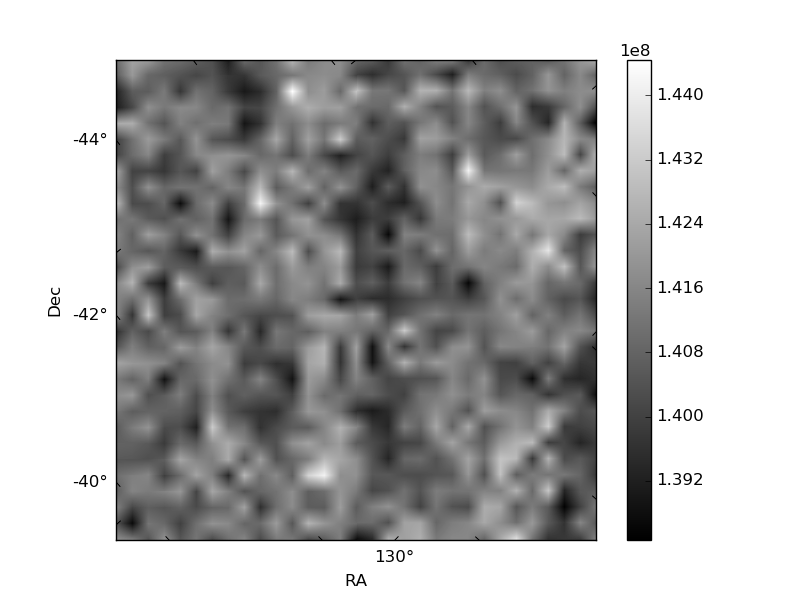
Histogram calculated using DETX and DETY for each event in the final _common_clean file
| Quadrant A | 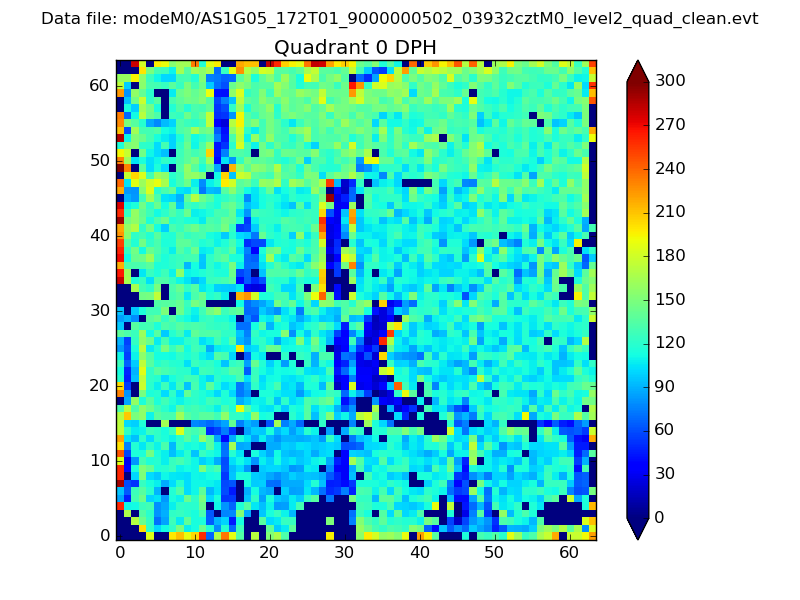 |
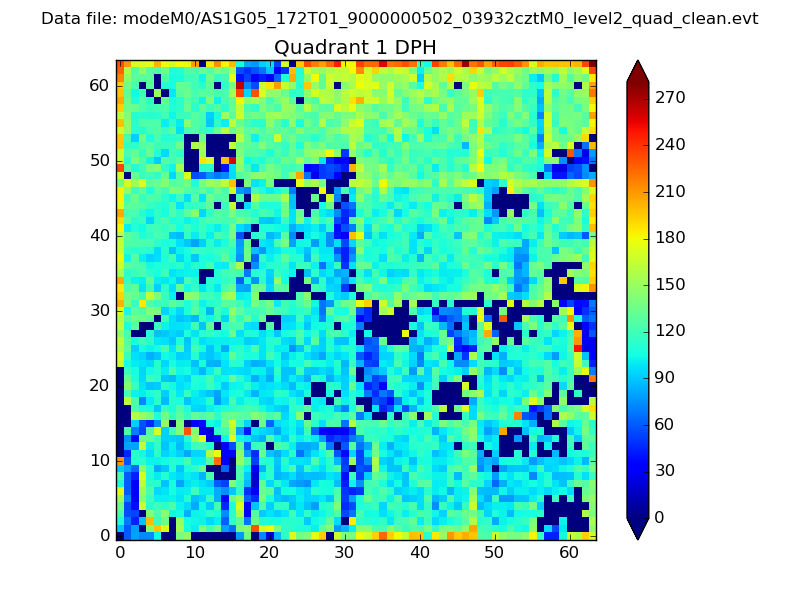 |
Quadrant B |
|---|---|---|---|
| Quadrant D | 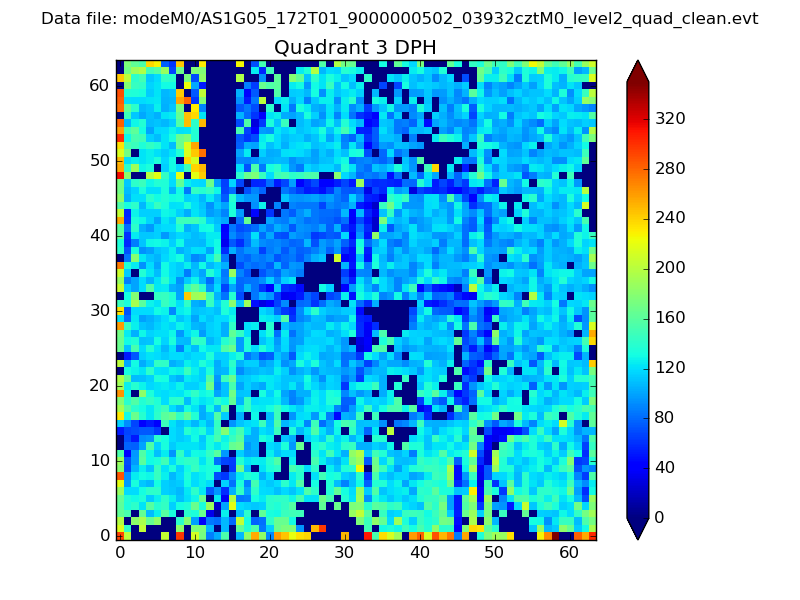 |
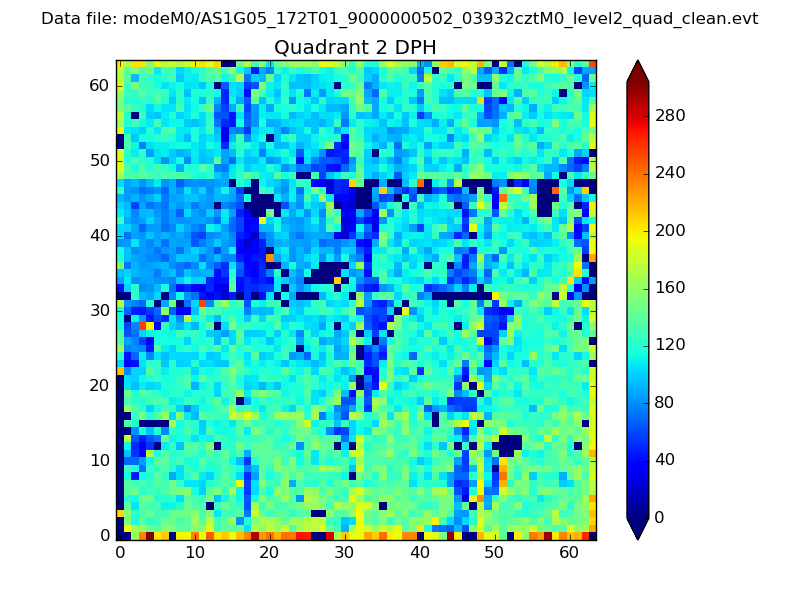 |
Quadrant C |
| Plot type | Count rate plots | Images |
|---|---|---|
| Comparison with Poisson distribution Blue bars denote a histogram of data divided into 1 sec bins. Red curve is a Poisson curve with rate = median count rate of data. |
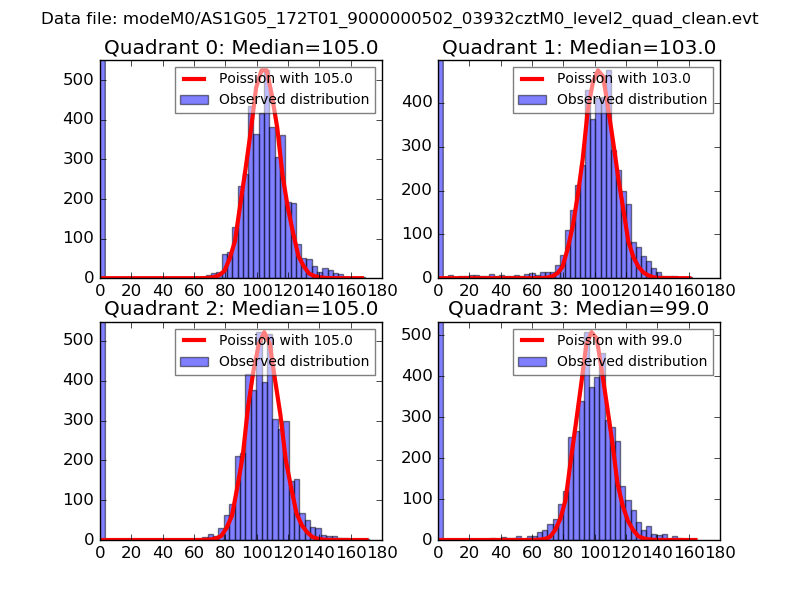 |
 |
| Quadrant-wise count rates Data is divided into 100 sec bins |
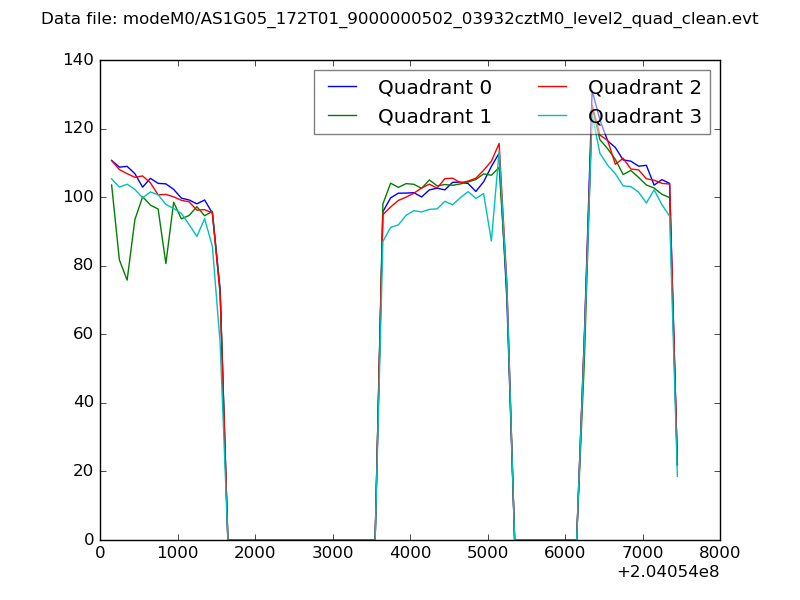 |
|
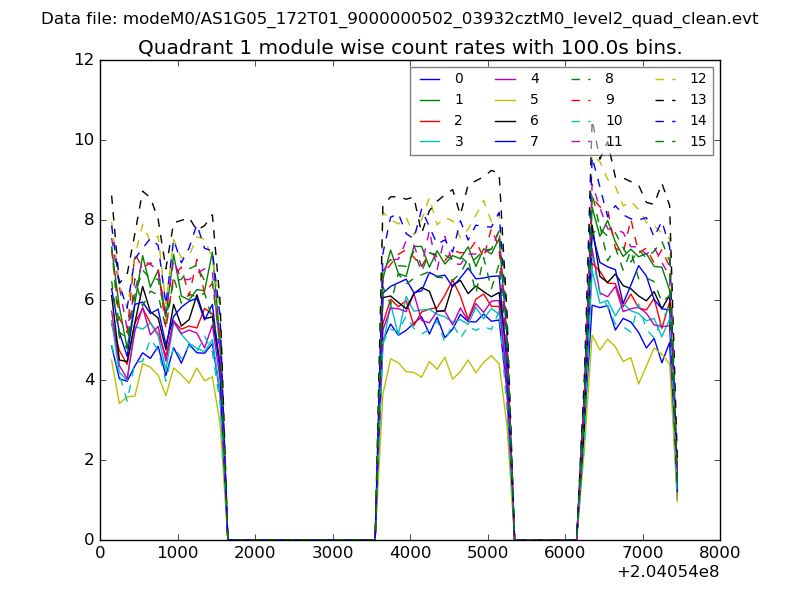
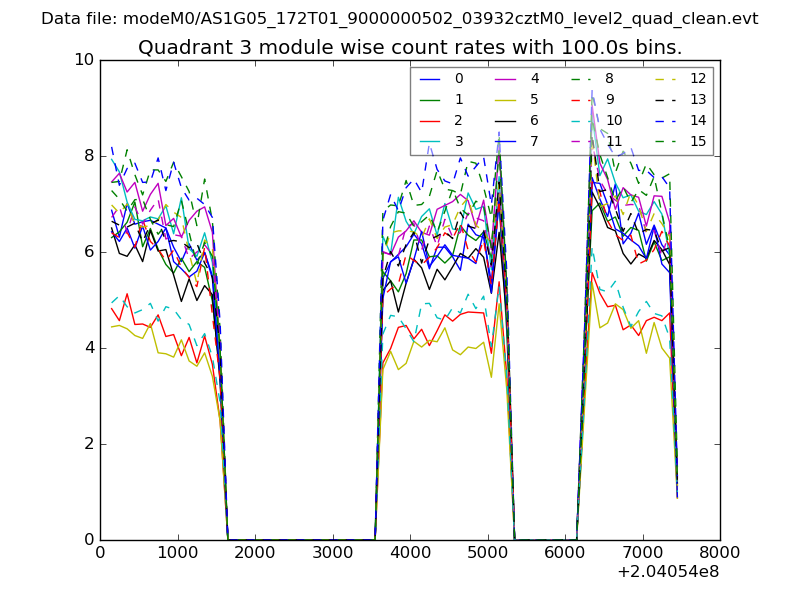
| Module-wise count rates for Quadrant A Data is divided into 100 sec bins |
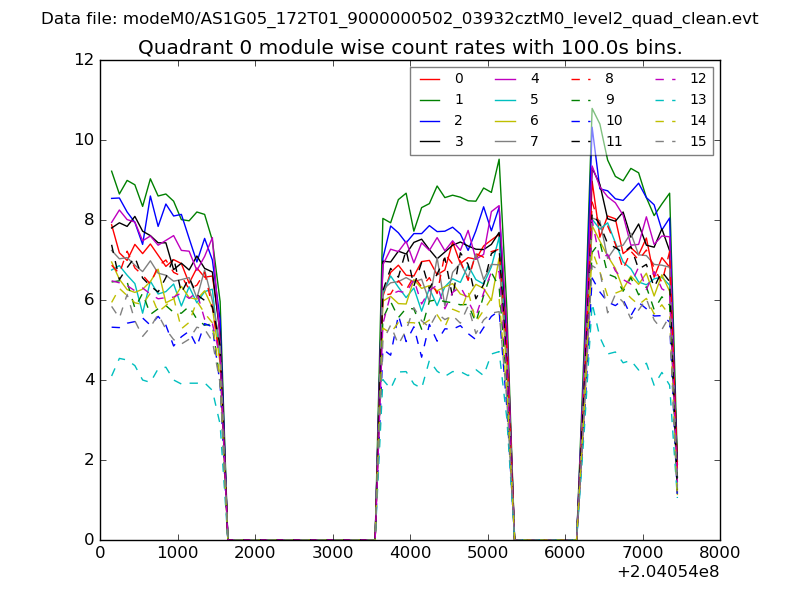 |
 |
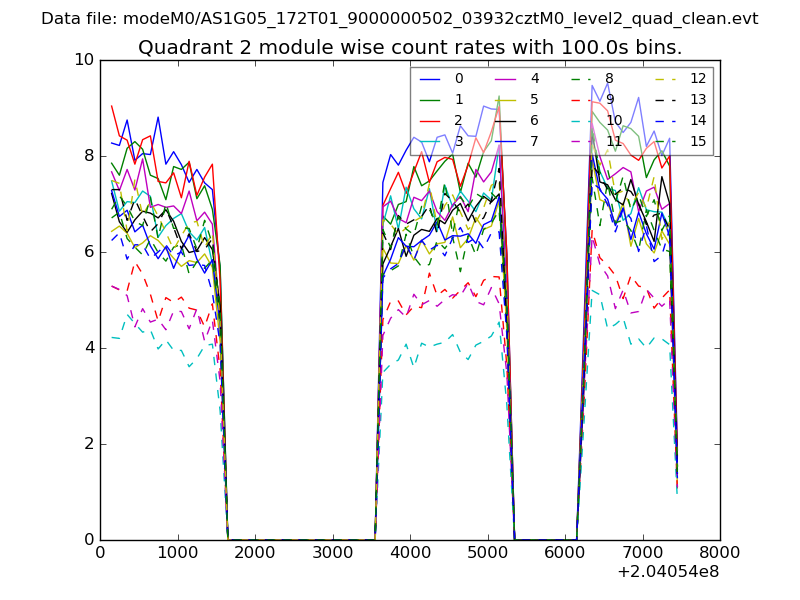
| Module-wise count rates for Quadrant B Data is divided into 100 sec bins |
 |
 |
| Module-wise count rates for Quadrant C Data is divided into 100 sec bins |
 |
 |
| Module-wise count rates for Quadrant D Data is divided into 100 sec bins |
 |
 |
| Parameter | Plot |
|---|---|
| CZT HV Monitor | 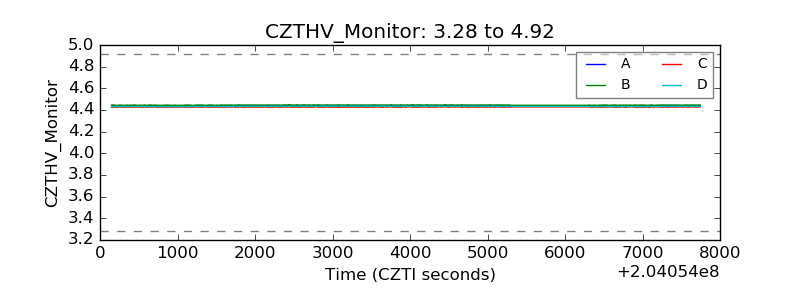 |
| D_VDD | 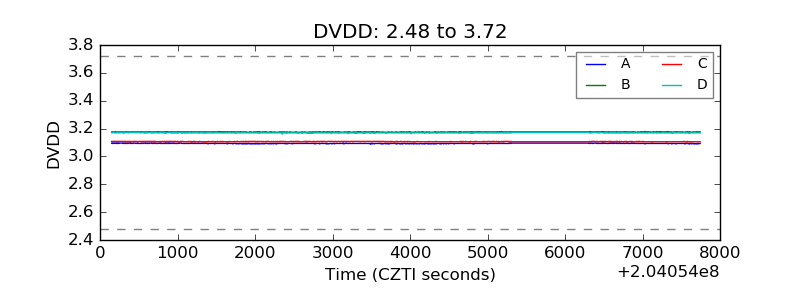 |
| Temperature 1 | 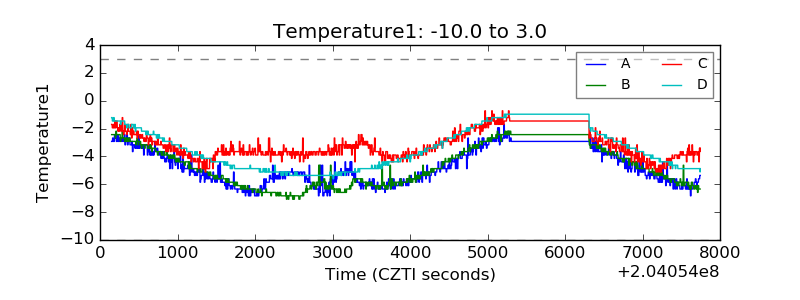 |
| Veto HV Monitor | 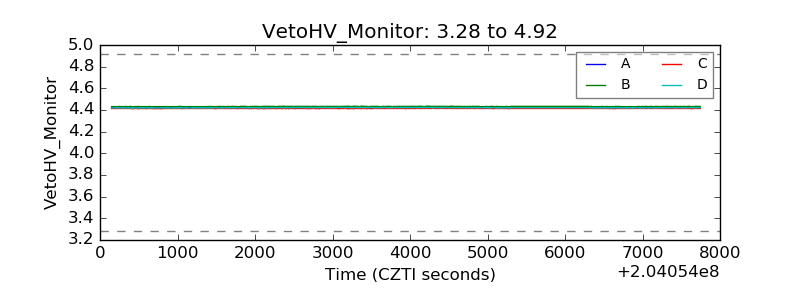 |
| Veto LLD | 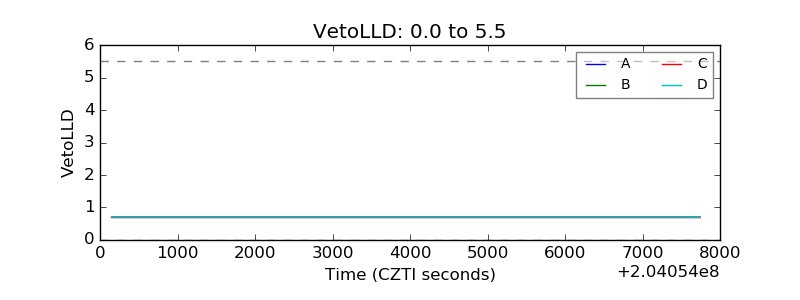 |
| Alpha Counter | 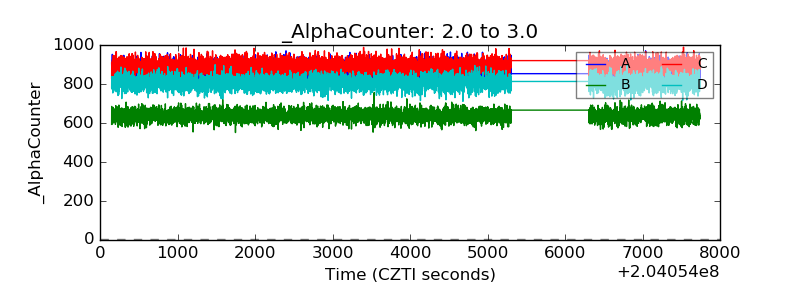 |
| _CPM_Rate | 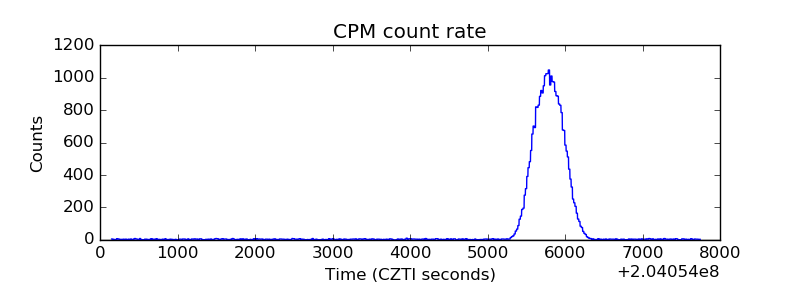 |
| CZT Counter | 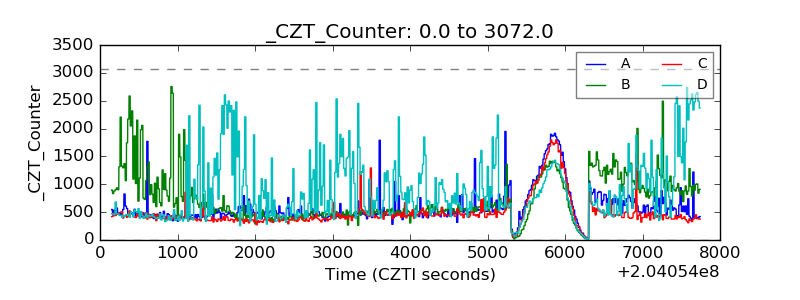 |
| +2.5 Volts monitor |  |
| +5 Volts monitor |  |
| Veto Counter | 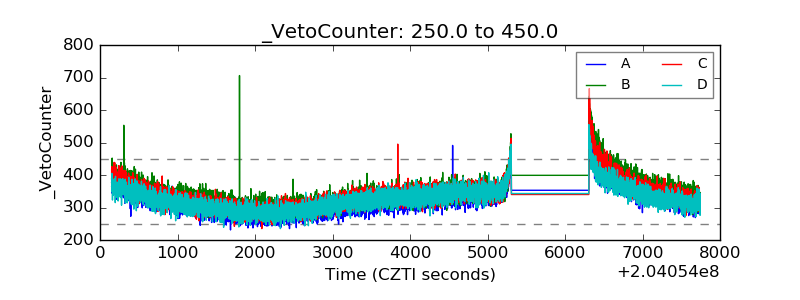 |