| Param | Original file | Final file |
|---|---|---|
| Filename | modeM0/AS1G05_172T01_9000000502_03934cztM0_level2.evt | modeM0/AS1G05_172T01_9000000502_03934cztM0_level2_quad_clean.evt |
| Size (bytes) | 700,272,000 | 69,408,000 |
| Size | 667.8 MB | 66.2 MB |
| Events in quadrant A | 3,626,247 | 427,120 |
| Events in quadrant B | 4,686,462 | 424,303 |
| Events in quadrant C | 2,821,736 | 424,402 |
| Events in quadrant D | 9,634,073 | 371,651 |
| Mode SS | |||
|---|---|---|---|
| Quadrant | BADHDUFLAG | Total packets | Discarded packets |
| A | 0 | 132 | 0 |
| B | 0 | 132 | 0 |
| C | 0 | 132 | 0 |
| D | 0 | 132 | 0 |
| Mode M9 | |||
|---|---|---|---|
| Quadrant | BADHDUFLAG | Total packets | Discarded packets |
| A | 0 | 17 | 0 |
| B | 0 | 17 | 0 |
| C | 0 | 17 | 0 |
| D | 0 | 18 | 0 |
| Mode M0 | |||
|---|---|---|---|
| Quadrant | BADHDUFLAG | Total packets | Discarded packets |
| A | 0 | 15033 | 3 |
| B | 0 | 18239 | 2 |
| C | 0 | 13215 | 2 |
| D | 0 | 33133 | 2 |
| Quadrant | Total seconds | Saturated seconds | Saturation percentage |
|---|---|---|---|
| A | 6504 | 51 | 0.784133% |
| B | 6504 | 101 | 1.552891% |
| C | 6504 | 6 | 0.092251% |
| D | 6504 | 1929 | 29.658672% |
Noise dominated data is calculated using 1-second bins in cleaned event files. If a bin has >2000 counts, and if more than 50% of those come from <1% of pixels, then it is considered to be noise-dominated and hence unusable.
| Quadrant | # 1 sec bins | Bins with >0 counts | Bins with >2000 counts | High rate bins dominated by noise | Noise dominated (total time) | Noise dominated (detector-on time) | Marked lightcurve |
|---|---|---|---|---|---|---|---|
| A | 7644 | 6505 | 11 | 11 | 0.14% | 0.17% | 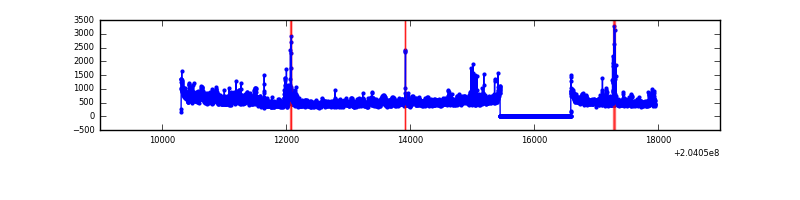 |
| B | 7644 | 6505 | 26 | 26 | 0.34% | 0.40% | 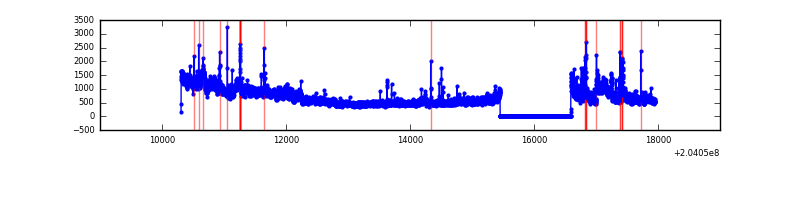 |
| C | 7644 | 6505 | 2 | 2 | 0.03% | 0.03% | 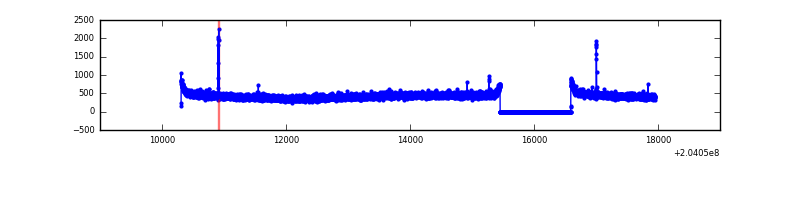 |
| D | 7644 | 6505 | 1892 | 1892 | 24.75% | 29.09% | 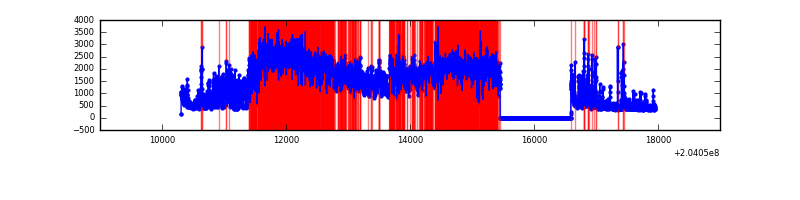 |
Top three noisy pixels from each quadrant. If the there are fewer than three noisy pixels in the level2.evt file, extra rows are filled as -1
| Pixel properties | Quadrant properties | ||||||
|---|---|---|---|---|---|---|---|
| Quadrant | DetID | PixID | Counts | Sigma | Mean | Median | Sigma |
| A | 8 | 15 | 552687 | 3605.1 | 748 | 733 | 153.1 |
| A | 0 | 118 | 137561 | 893.69 | 748 | 733 | 153.1 |
| A | 0 | 226 | 20095 | 126.46 | 748 | 733 | 153.1 |
| B | 3 | 0 | 1483733 | 10118.72 | 755 | 736 | 146.6 |
| B | 15 | 204 | 82294 | 556.48 | 755 | 736 | 146.6 |
| B | 4 | 81 | 70646 | 477.01 | 755 | 736 | 146.6 |
| C | 7 | 222 | 19251 | 111.08 | 716 | 719 | 166.8 |
| C | 13 | 61 | 6086 | 32.17 | 716 | 719 | 166.8 |
| C | 7 | 247 | 3043 | 13.93 | 716 | 719 | 166.8 |
| D | 9 | 82 | 4004351 | 25462.41 | 648 | 630 | 157.2 |
| D | 2 | 63 | 2640624 | 16789.53 | 648 | 630 | 157.2 |
| D | 2 | 232 | 243484 | 1544.47 | 648 | 630 | 157.2 |
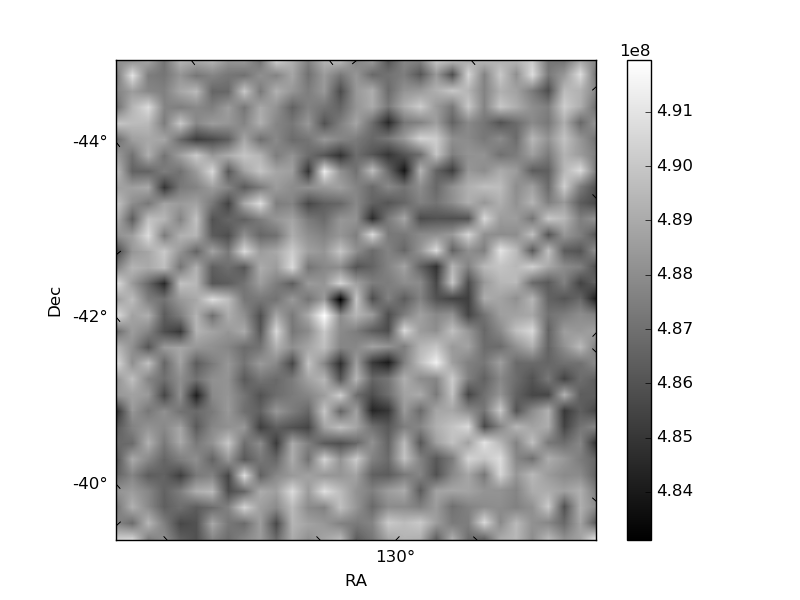
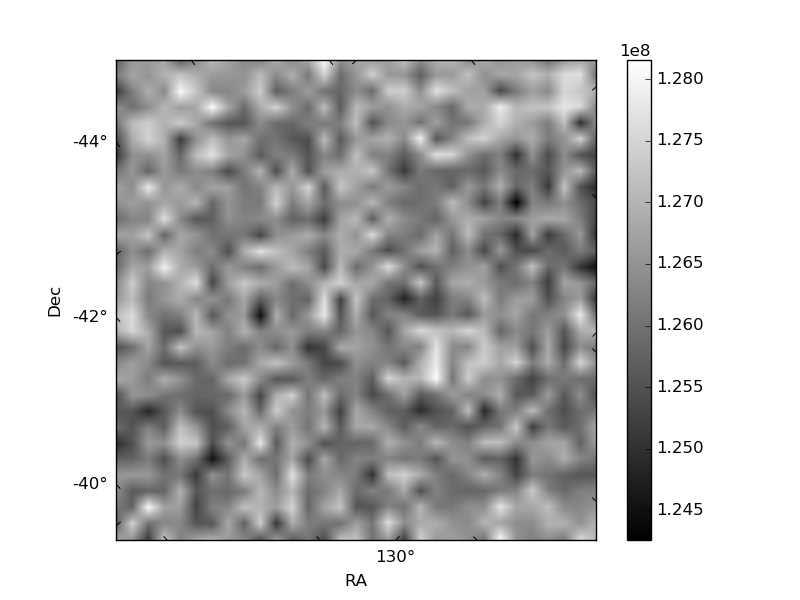
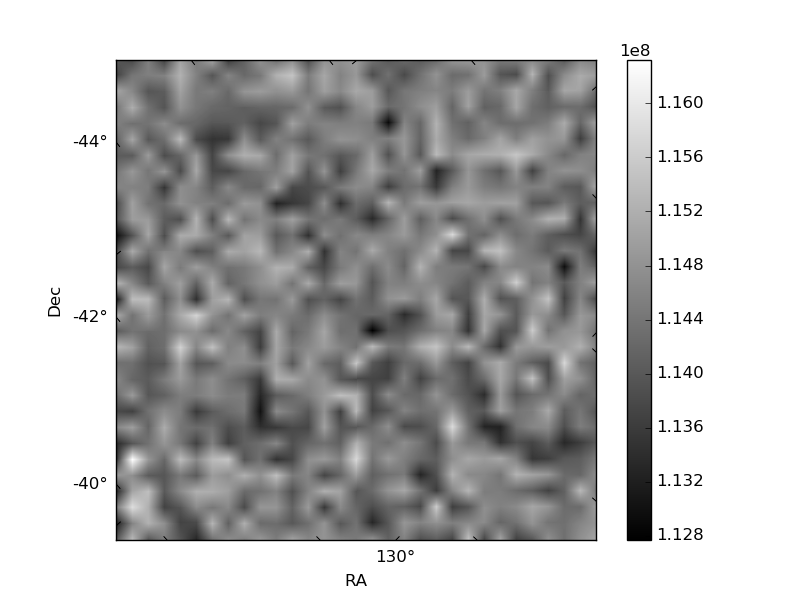
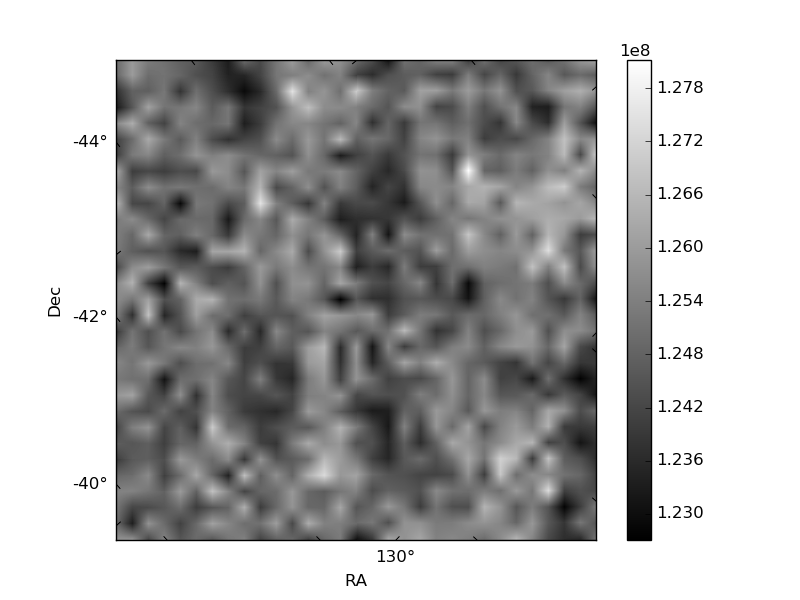
Histogram calculated using DETX and DETY for each event in the final _common_clean file
| Quadrant A | 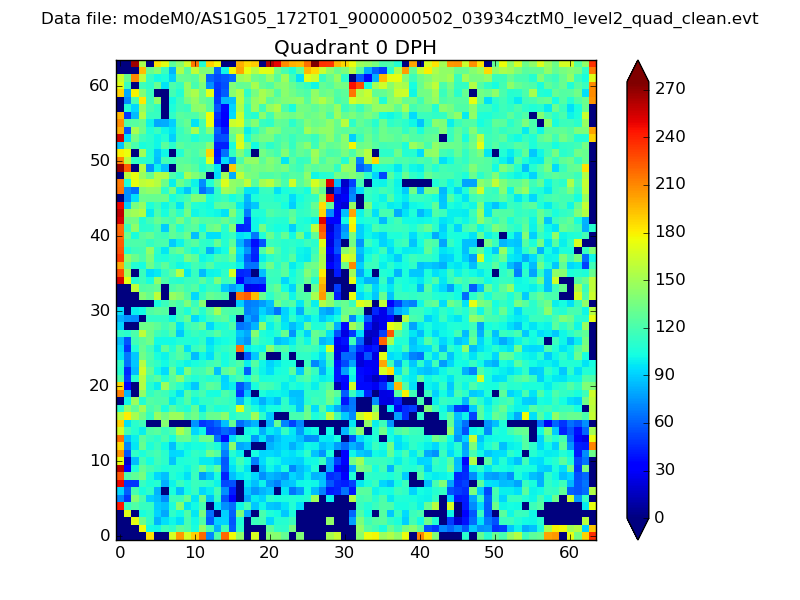 |
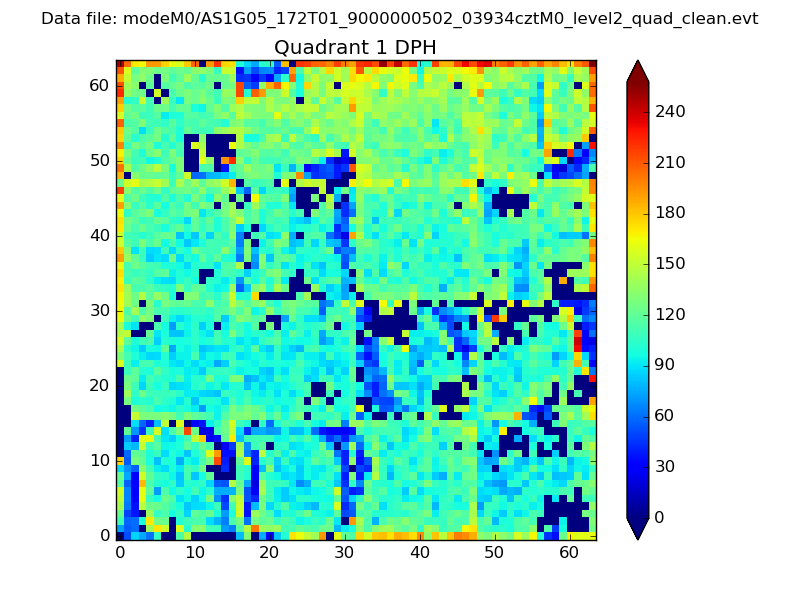 |
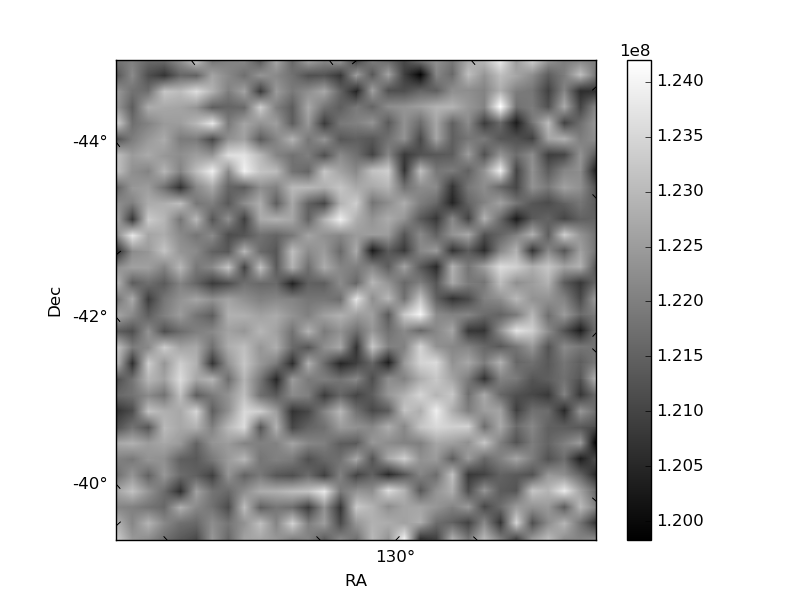
Quadrant B |
|---|---|---|---|
| Quadrant D | 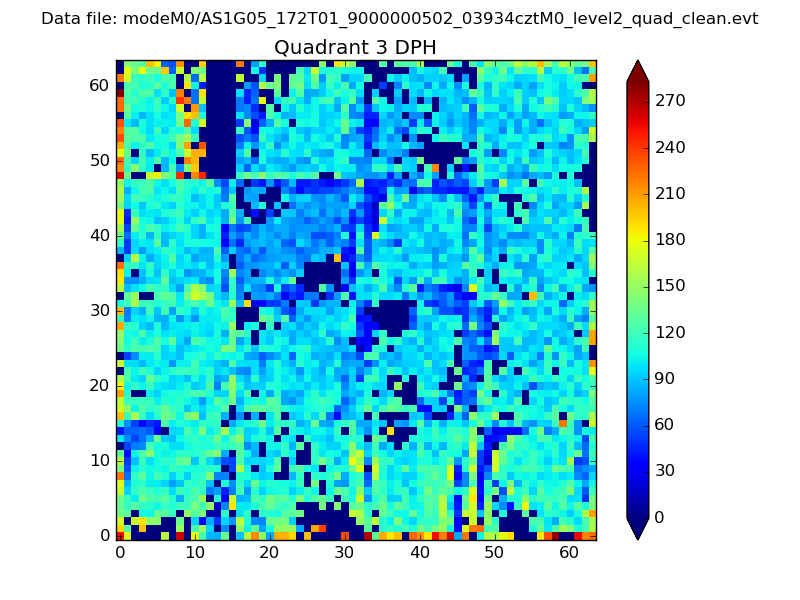 |
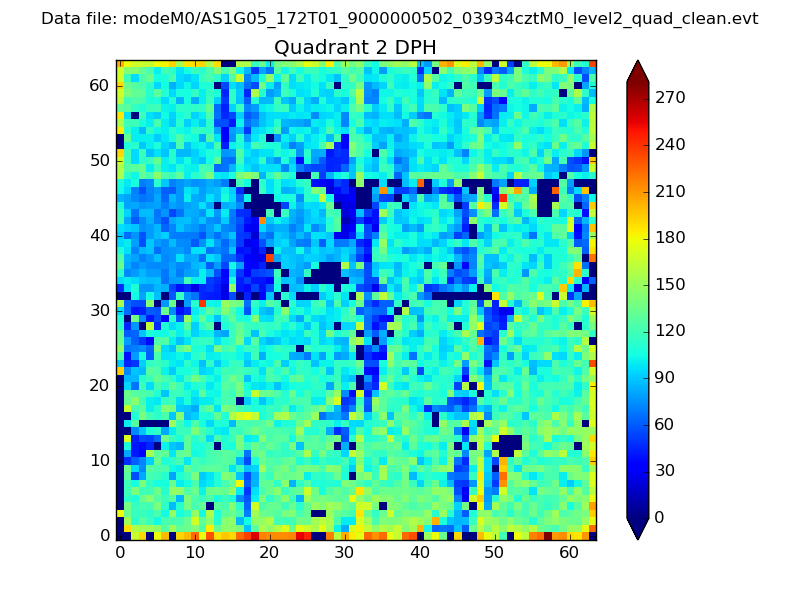 |
Quadrant C |
| Plot type | Count rate plots | Images |
|---|---|---|
| Comparison with Poisson distribution Blue bars denote a histogram of data divided into 1 sec bins. Red curve is a Poisson curve with rate = median count rate of data. |
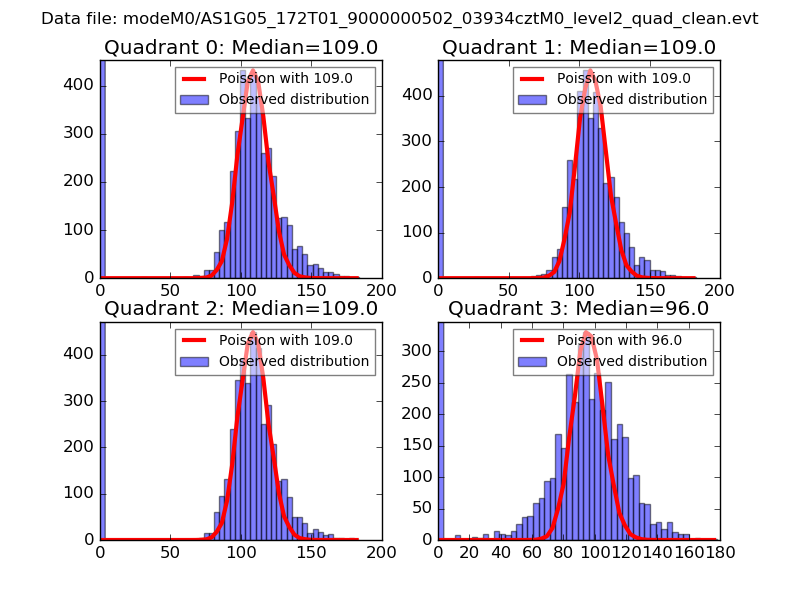 |
 |
| Quadrant-wise count rates Data is divided into 100 sec bins |
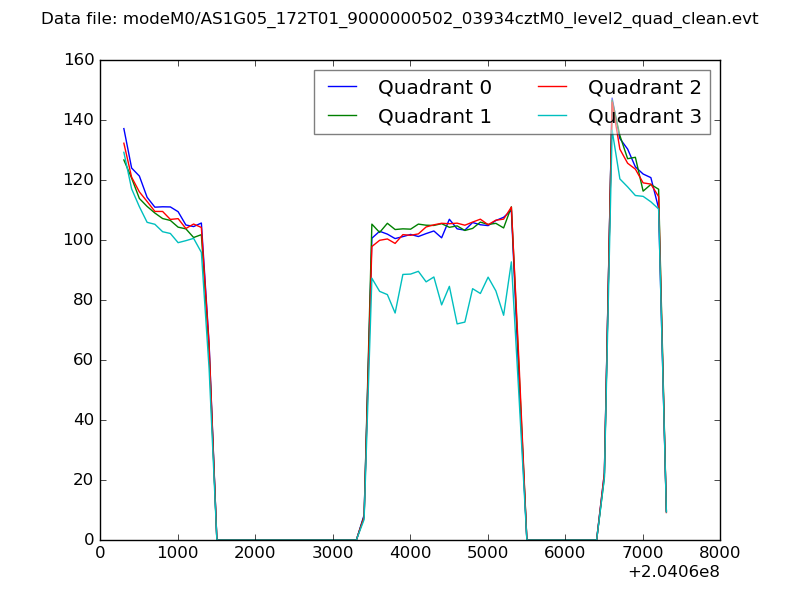 |
|
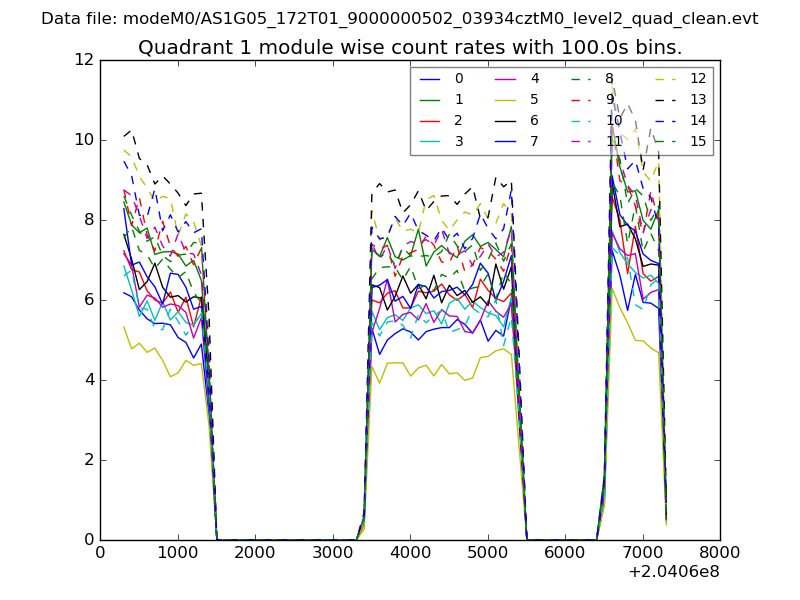
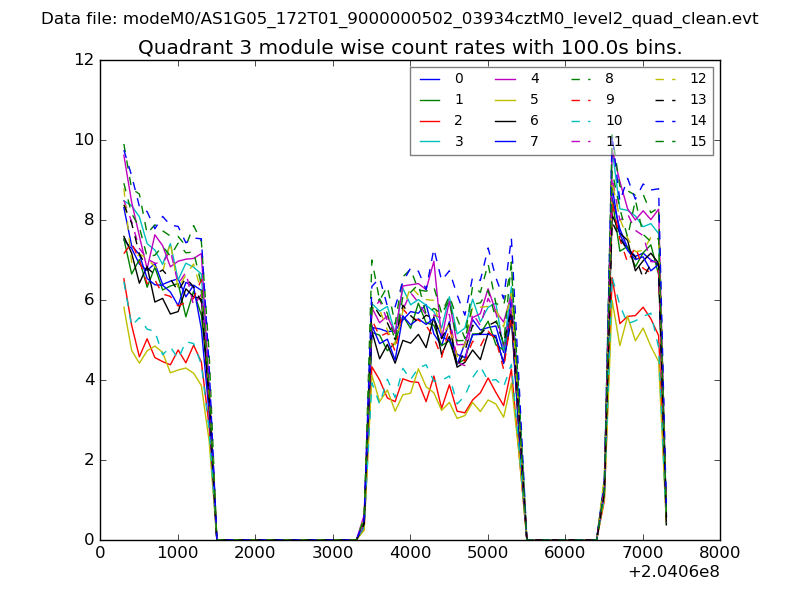
| Module-wise count rates for Quadrant A Data is divided into 100 sec bins |
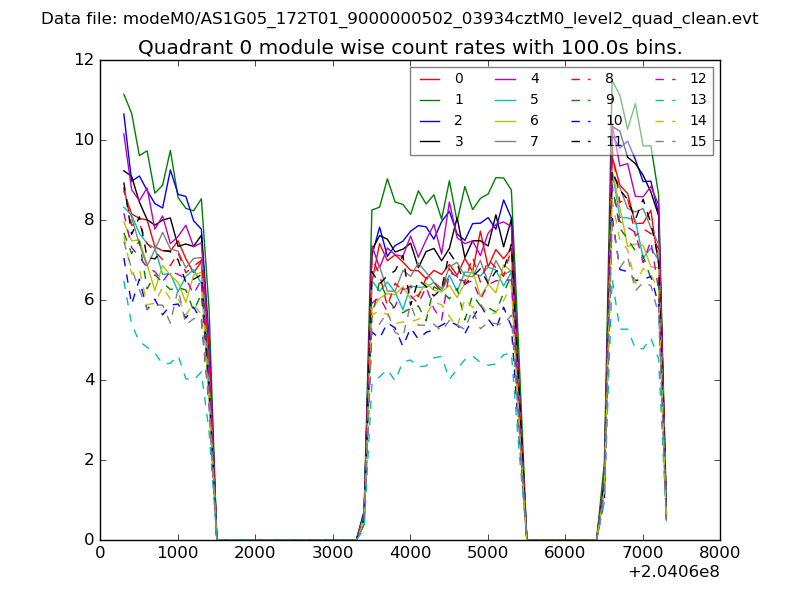 |
 |
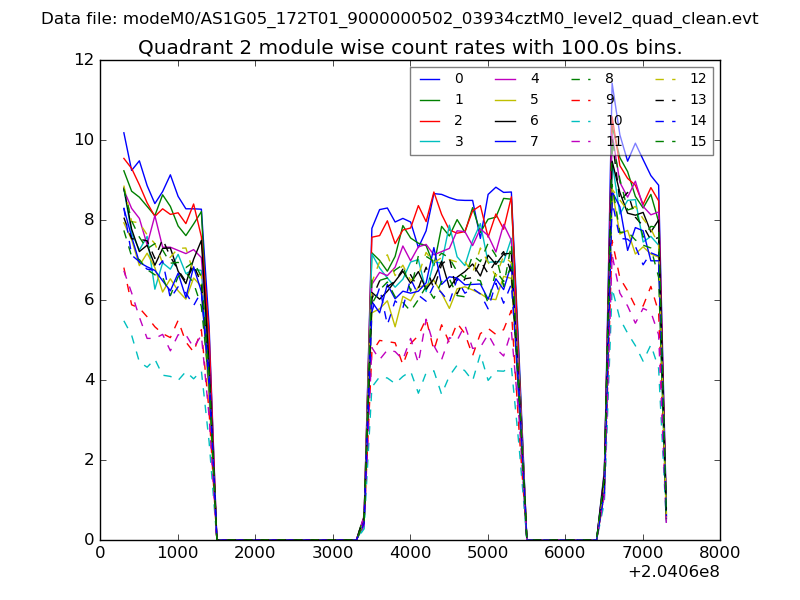
| Module-wise count rates for Quadrant B Data is divided into 100 sec bins |
 |
 |
| Module-wise count rates for Quadrant C Data is divided into 100 sec bins |
 |
 |
| Module-wise count rates for Quadrant D Data is divided into 100 sec bins |
 |
 |
| Parameter | Plot |
|---|---|
| CZT HV Monitor | 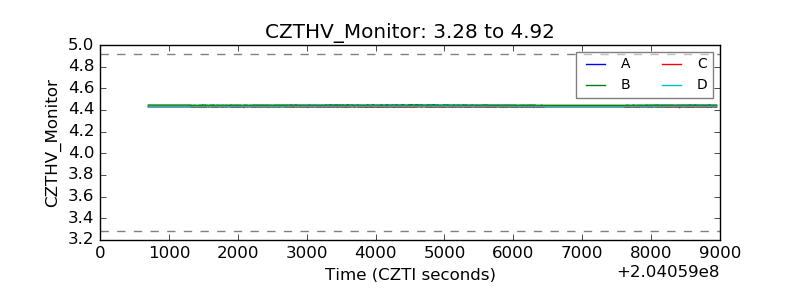 |
| D_VDD | 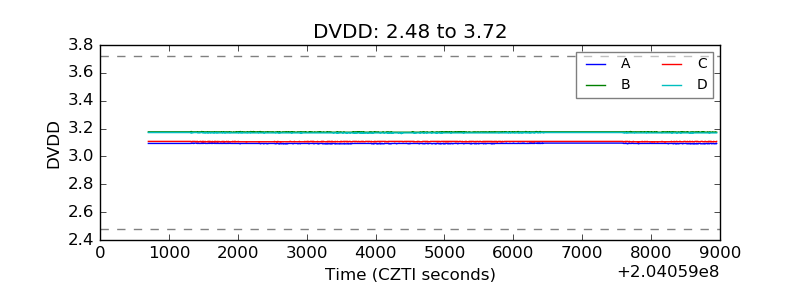 |
| Temperature 1 | 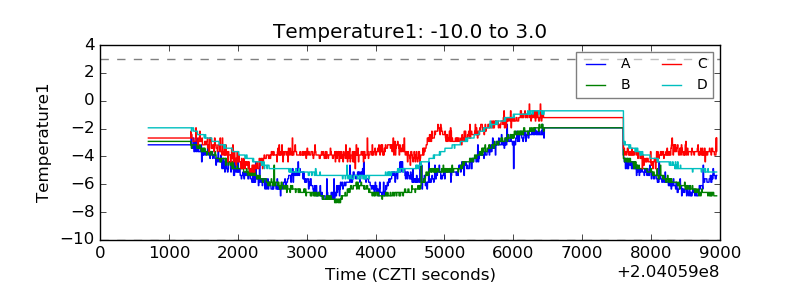 |
| Veto HV Monitor | 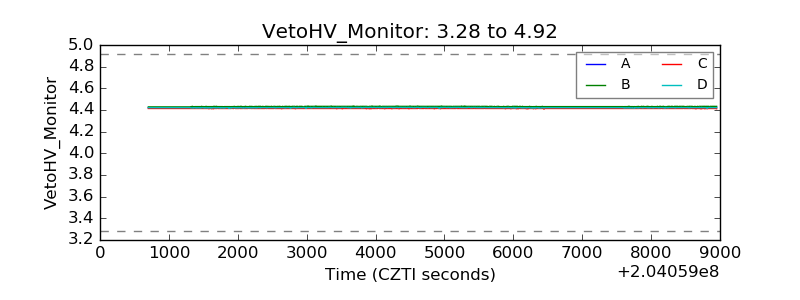 |
| Veto LLD | 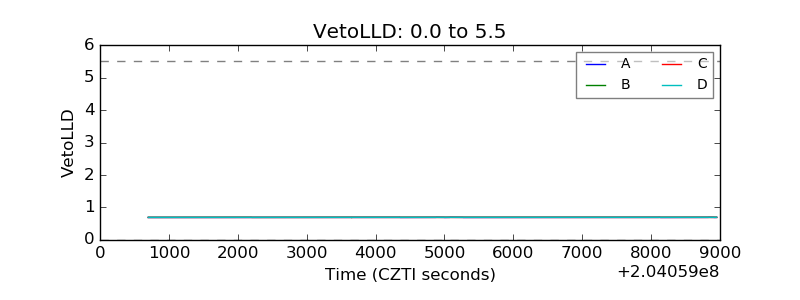 |
| Alpha Counter | 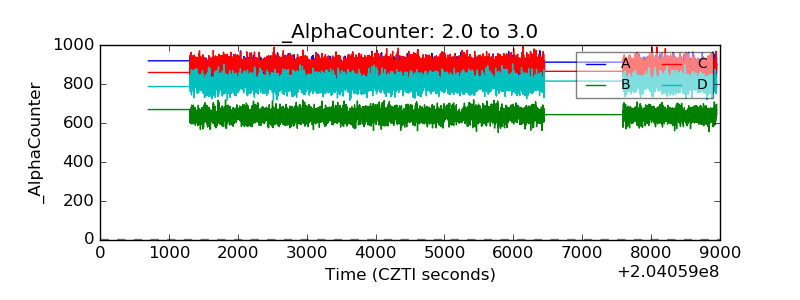 |
| _CPM_Rate | 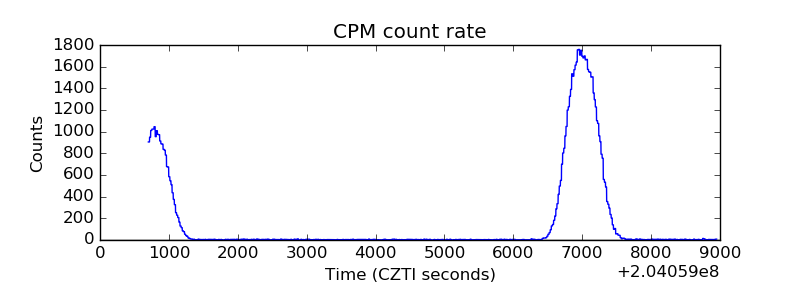 |
| CZT Counter | 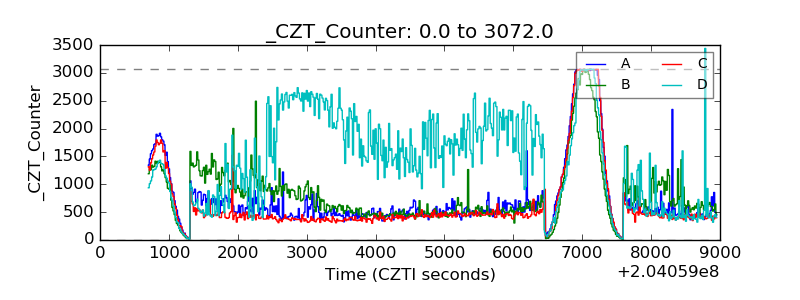 |
| +2.5 Volts monitor |  |
| +5 Volts monitor |  |
| Veto Counter | 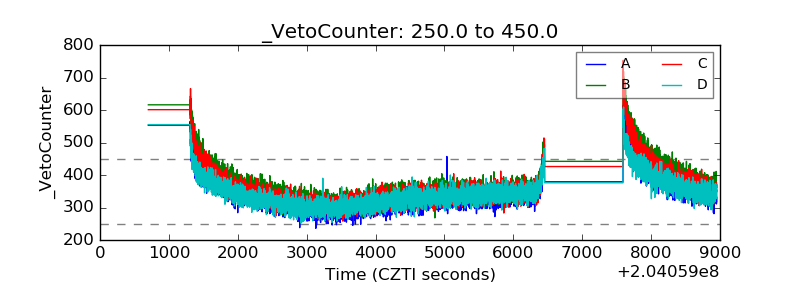 |