| Param | Original file | Final file |
|---|---|---|
| Filename | modeM0/AS1G05_172T01_9000000502_03937cztM0_level2.evt | modeM0/AS1G05_172T01_9000000502_03937cztM0_level2_quad_clean.evt |
| Size (bytes) | 498,985,920 | 58,688,640 |
| Size | 475.9 MB | 56.0 MB |
| Events in quadrant A | 3,172,732 | 334,064 |
| Events in quadrant B | 4,849,959 | 339,906 |
| Events in quadrant C | 3,014,050 | 336,965 |
| Events in quadrant D | 3,638,778 | 317,092 |
| Mode SS | |||
|---|---|---|---|
| Quadrant | BADHDUFLAG | Total packets | Discarded packets |
| A | 0 | 132 | 0 |
| B | 0 | 132 | 0 |
| C | 0 | 132 | 0 |
| D | 0 | 132 | 0 |
| Mode M9 | |||
|---|---|---|---|
| Quadrant | BADHDUFLAG | Total packets | Discarded packets |
| A | 0 | 13 | 0 |
| B | 0 | 13 | 0 |
| C | 0 | 13 | 0 |
| D | 0 | 13 | 0 |
| Mode M0 | |||
|---|---|---|---|
| Quadrant | BADHDUFLAG | Total packets | Discarded packets |
| A | 0 | 13458 | 0 |
| B | 0 | 18362 | 0 |
| C | 0 | 13115 | 0 |
| D | 0 | 15111 | 0 |
| Quadrant | Total seconds | Saturated seconds | Saturation percentage |
|---|---|---|---|
| A | 6426 | 53 | 0.824774% |
| B | 6426 | 258 | 4.014939% |
| C | 6426 | 28 | 0.435730% |
| D | 6426 | 116 | 1.805167% |
Noise dominated data is calculated using 1-second bins in cleaned event files. If a bin has >2000 counts, and if more than 50% of those come from <1% of pixels, then it is considered to be noise-dominated and hence unusable.
| Quadrant | # 1 sec bins | Bins with >0 counts | Bins with >2000 counts | High rate bins dominated by noise | Noise dominated (total time) | Noise dominated (detector-on time) | Marked lightcurve |
|---|---|---|---|---|---|---|---|
| A | 7786 | 6427 | 19 | 19 | 0.24% | 0.30% | 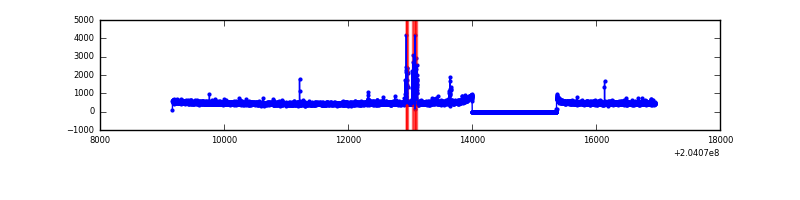 |
| B | 7786 | 6427 | 103 | 103 | 1.32% | 1.60% | 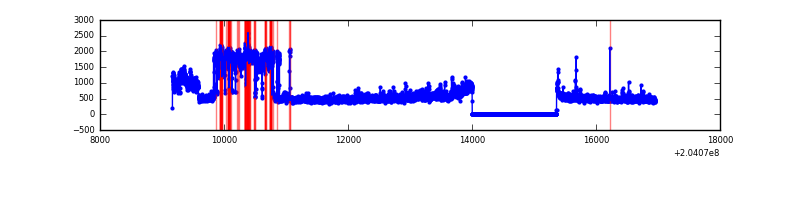 |
| C | 7786 | 6427 | 2 | 2 | 0.03% | 0.03% | 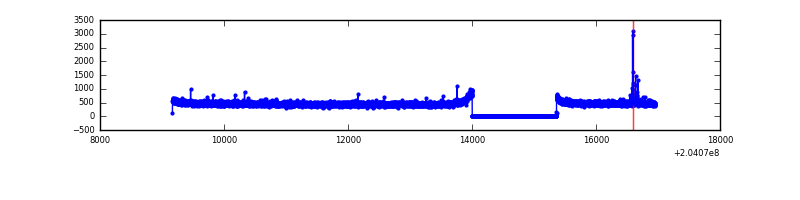 |
| D | 7786 | 6427 | 86 | 86 | 1.10% | 1.34% | 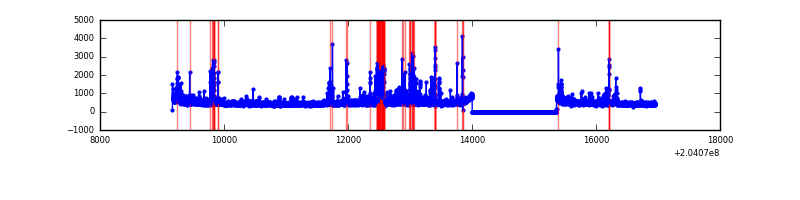 |
Top three noisy pixels from each quadrant. If the there are fewer than three noisy pixels in the level2.evt file, extra rows are filled as -1
| Pixel properties | Quadrant properties | ||||||
|---|---|---|---|---|---|---|---|
| Quadrant | DetID | PixID | Counts | Sigma | Mean | Median | Sigma |
| A | 0 | 118 | 114671 | 724.67 | 781 | 767 | 157.2 |
| A | 0 | 226 | 18359 | 111.92 | 781 | 767 | 157.2 |
| A | 8 | 15 | 13519 | 81.13 | 781 | 767 | 157.2 |
| B | 3 | 0 | 1571349 | 10528.18 | 790 | 773 | 149.2 |
| B | 15 | 204 | 129502 | 862.92 | 790 | 773 | 149.2 |
| B | 4 | 81 | 57897 | 382.92 | 790 | 773 | 149.2 |
| C | 1 | 16 | 16393 | 88.89 | 763 | 767 | 175.8 |
| C | 10 | 65 | 14132 | 76.03 | 763 | 767 | 175.8 |
| C | 13 | 61 | 6362 | 31.83 | 763 | 767 | 175.8 |
| D | 9 | 82 | 420628 | 2348.15 | 749 | 729 | 178.8 |
| D | 2 | 232 | 175872 | 979.43 | 749 | 729 | 178.8 |
| D | 13 | 223 | 96190 | 533.83 | 749 | 729 | 178.8 |
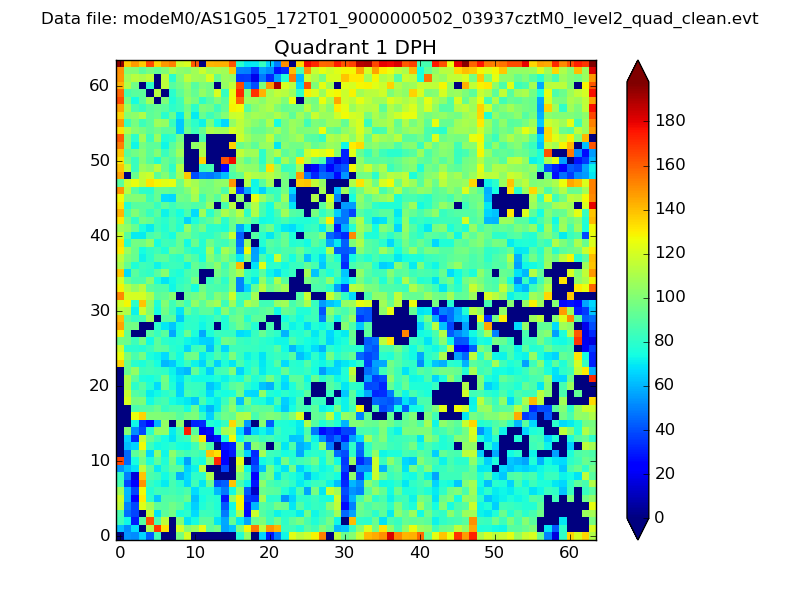
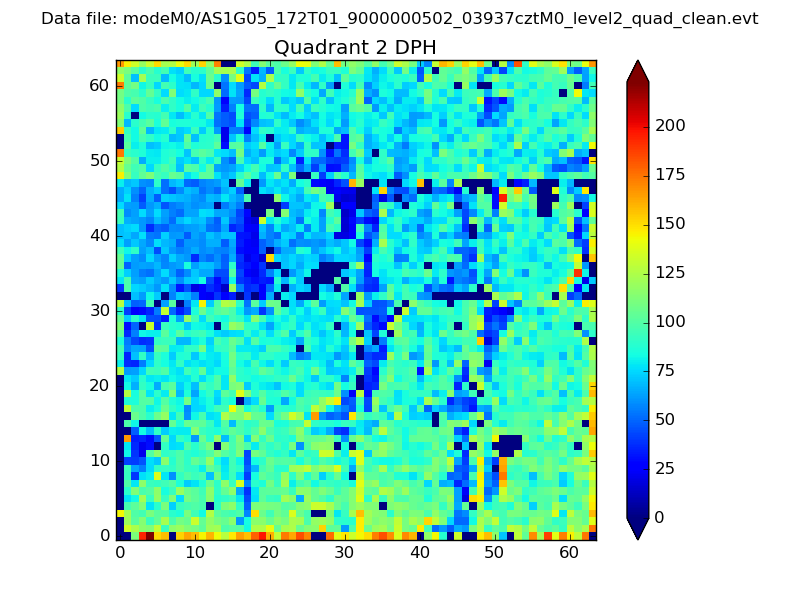
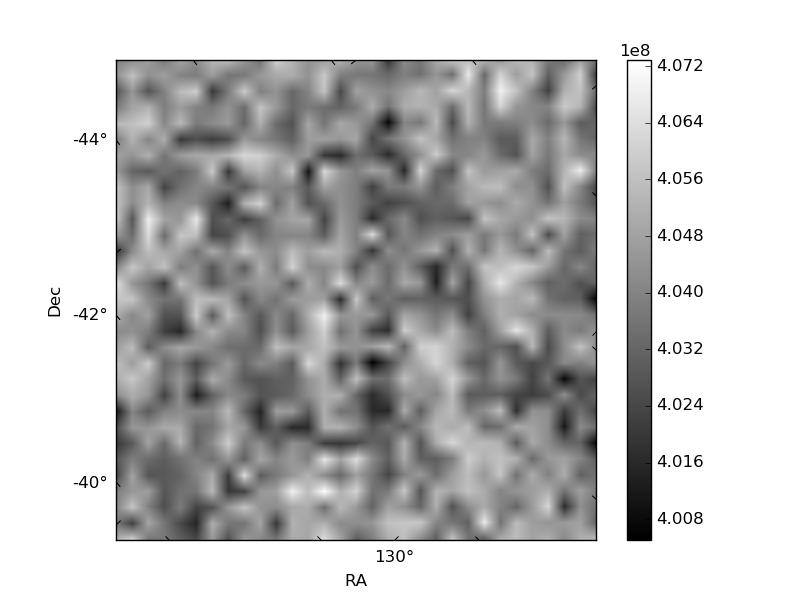
Histogram calculated using DETX and DETY for each event in the final _common_clean file
| Quadrant A |  |
 |
Quadrant B |
|---|---|---|---|
| Quadrant D | 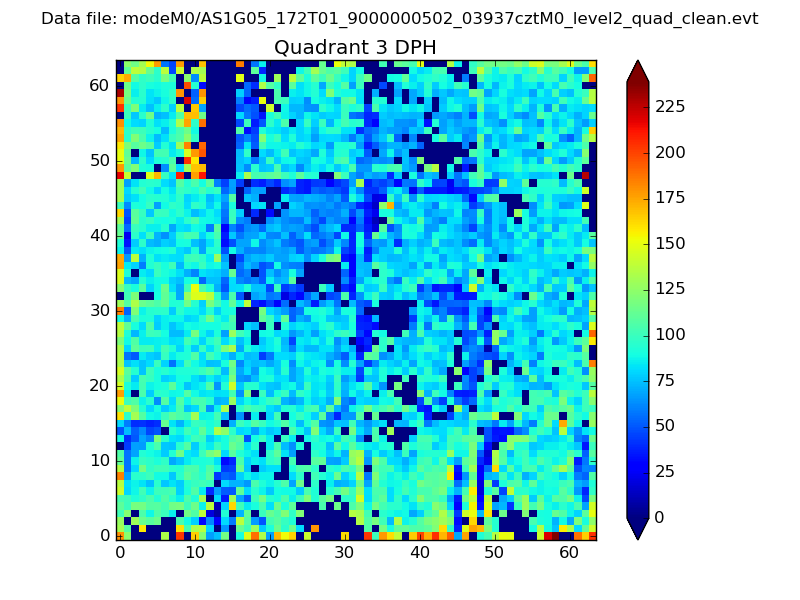 |
 |
Quadrant C |
| Plot type | Count rate plots | Images |
|---|---|---|
| Comparison with Poisson distribution Blue bars denote a histogram of data divided into 1 sec bins. Red curve is a Poisson curve with rate = median count rate of data. |
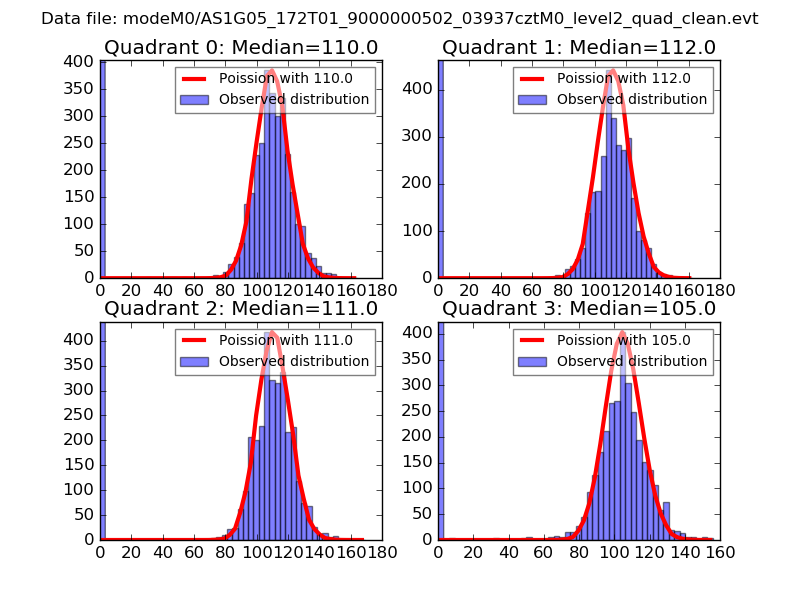 |
 |
| Quadrant-wise count rates Data is divided into 100 sec bins |
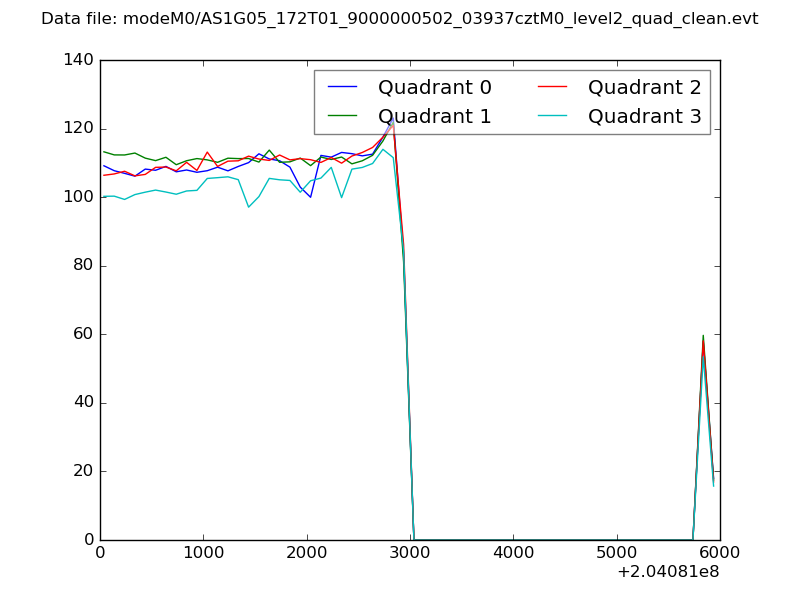 |
|
| Module-wise count rates for Quadrant A Data is divided into 100 sec bins |
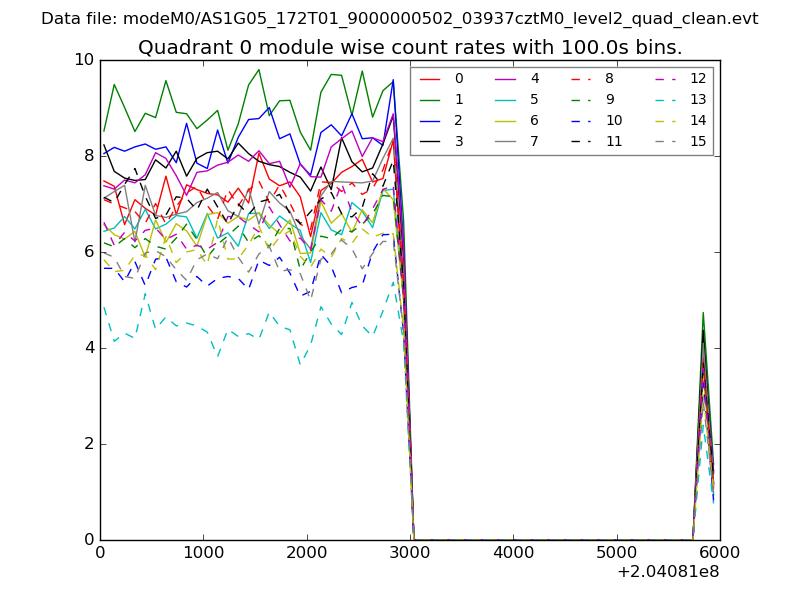 |
 |
| Module-wise count rates for Quadrant B Data is divided into 100 sec bins |
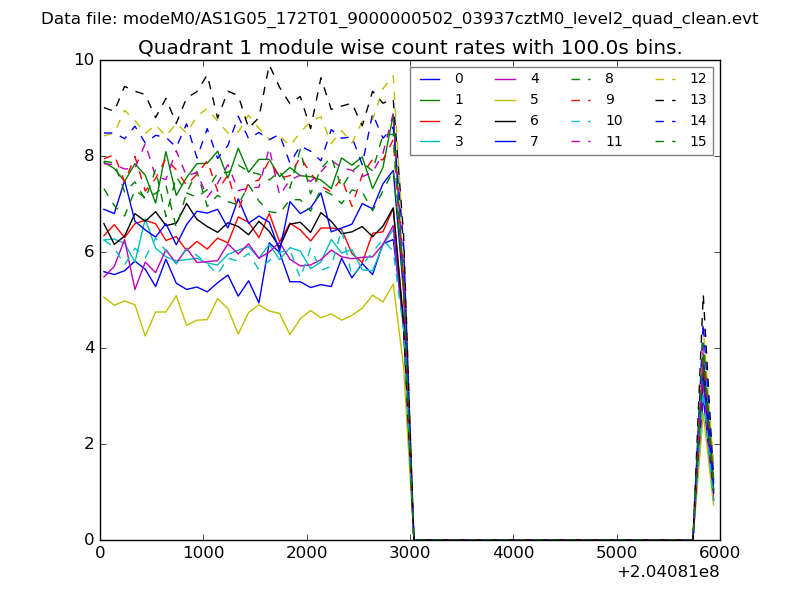 |
 |
| Module-wise count rates for Quadrant C Data is divided into 100 sec bins |
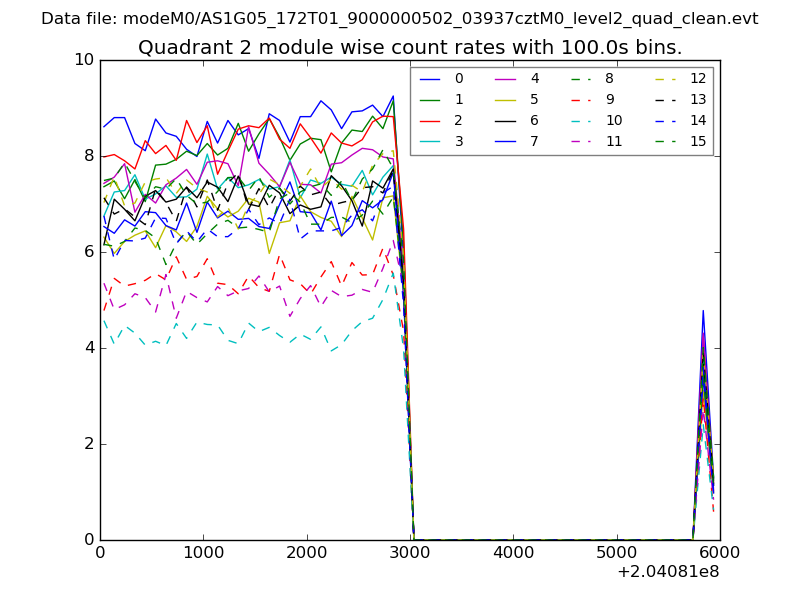 |
 |
| Module-wise count rates for Quadrant D Data is divided into 100 sec bins |
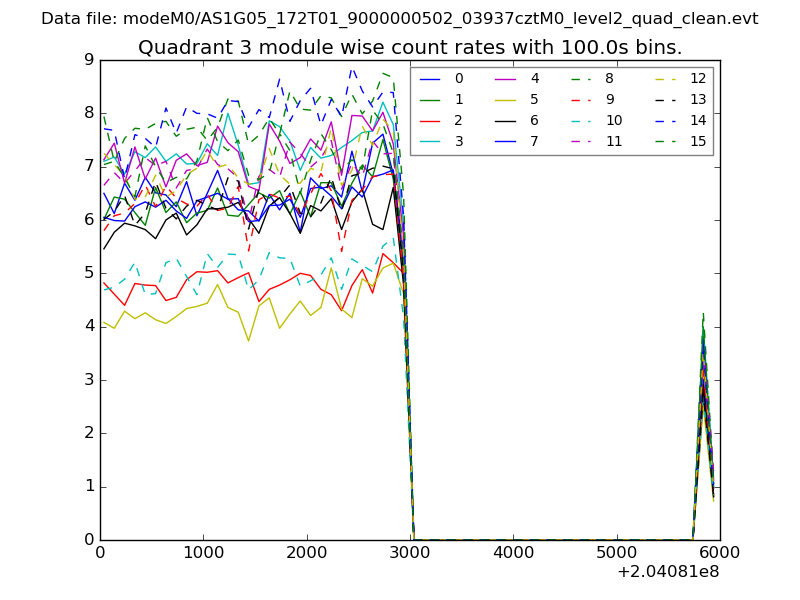 |
 |
| Parameter | Plot |
|---|---|
| CZT HV Monitor | 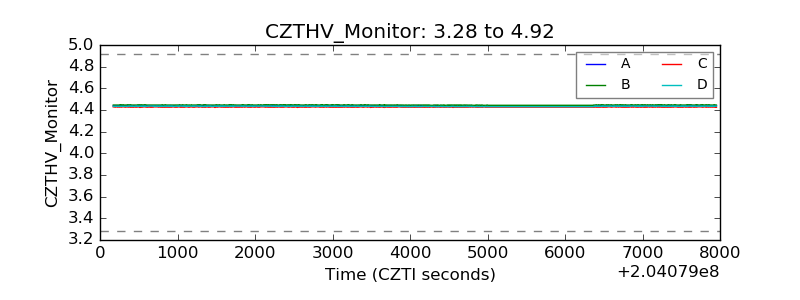 |
| D_VDD | 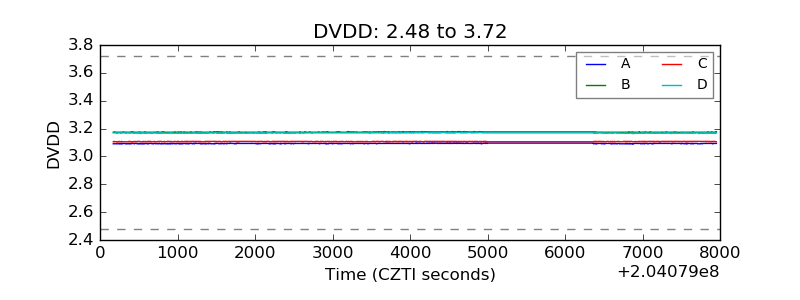 |
| Temperature 1 | 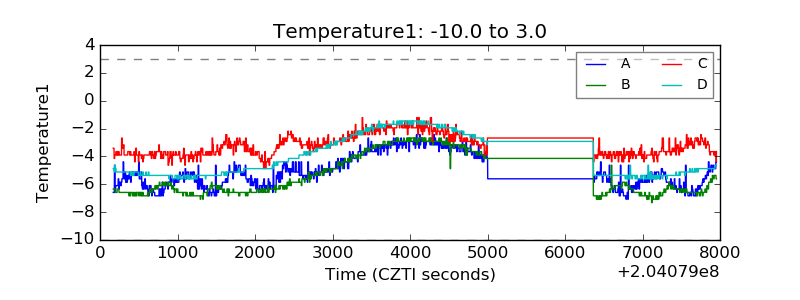 |
| Veto HV Monitor | 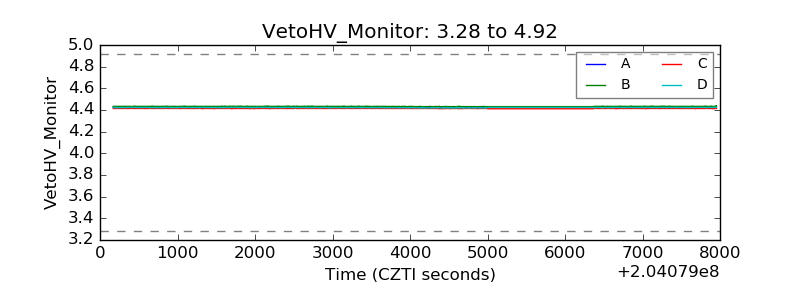 |
| Veto LLD | 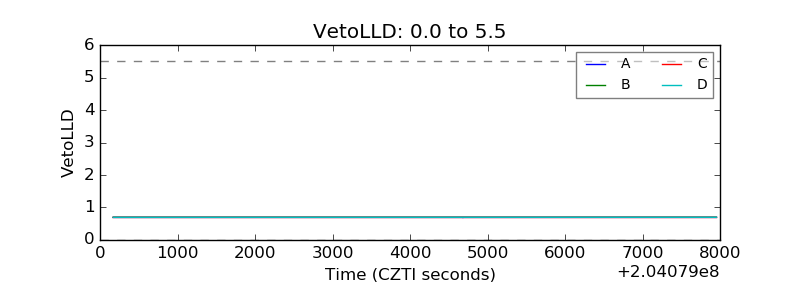 |
| Alpha Counter | 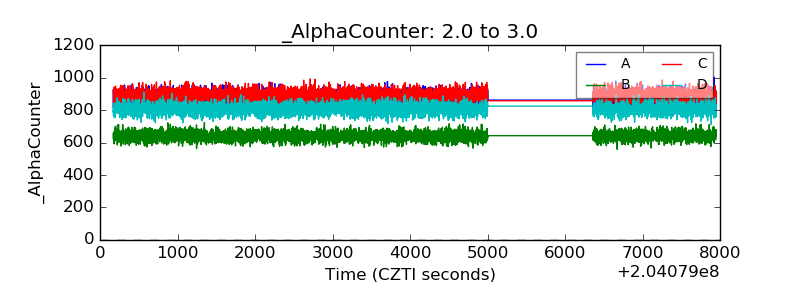 |
| _CPM_Rate | 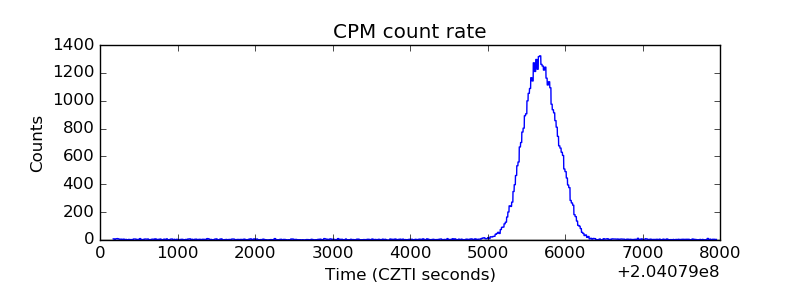 |
| CZT Counter | 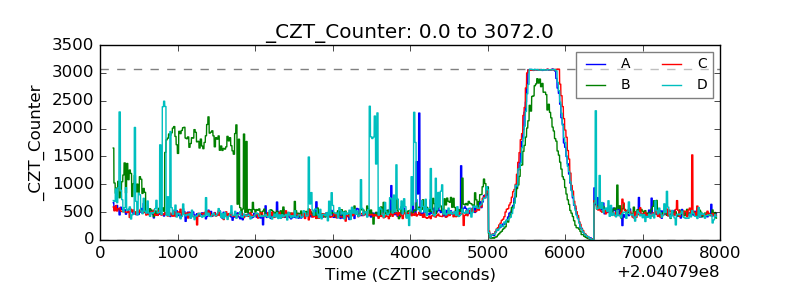 |
| +2.5 Volts monitor |  |
| +5 Volts monitor |  |
| _ROLL_ROT | 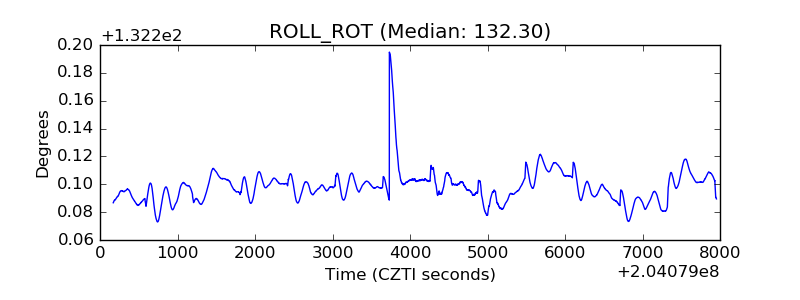 |
| _Roll_DEC | 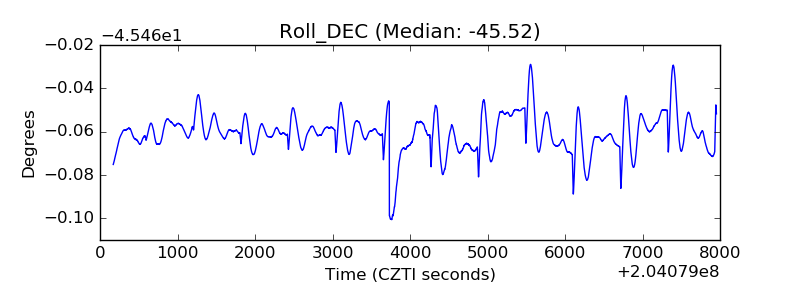 |
| _Roll_RA | 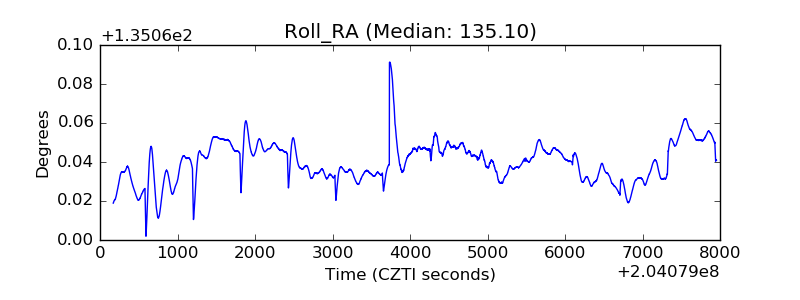 |
| Veto Counter | 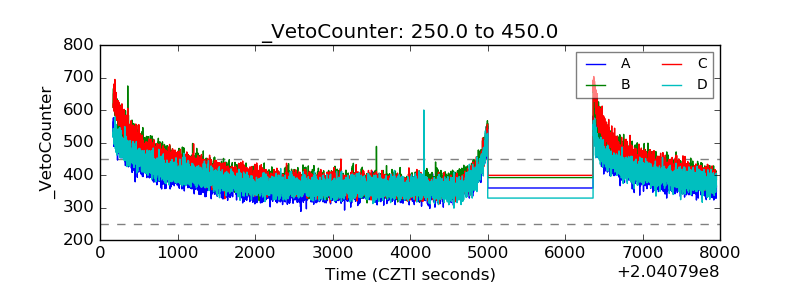 |