| Param | Original file | Final file |
|---|---|---|
| Filename | modeM0/AS1G05_172T01_9000000502_03939cztM0_level2.evt | modeM0/AS1G05_172T01_9000000502_03939cztM0_level2_quad_clean.evt |
| Size (bytes) | 470,108,160 | 78,134,400 |
| Size | 448.3 MB | 74.5 MB |
| Events in quadrant A | 3,226,864 | 479,019 |
| Events in quadrant B | 3,294,518 | 485,141 |
| Events in quadrant C | 3,001,734 | 481,064 |
| Events in quadrant D | 4,259,122 | 453,741 |
| Mode SS | |||
|---|---|---|---|
| Quadrant | BADHDUFLAG | Total packets | Discarded packets |
| A | 0 | 136 | 0 |
| B | 0 | 136 | 0 |
| C | 0 | 136 | 0 |
| D | 0 | 136 | 0 |
| Mode M9 | |||
|---|---|---|---|
| Quadrant | BADHDUFLAG | Total packets | Discarded packets |
| A | 0 | 10 | 0 |
| B | 0 | 10 | 0 |
| C | 0 | 10 | 0 |
| D | 0 | 10 | 0 |
| Mode M0 | |||
|---|---|---|---|
| Quadrant | BADHDUFLAG | Total packets | Discarded packets |
| A | 0 | 14079 | 2 |
| B | 0 | 13936 | 1 |
| C | 0 | 13649 | 1 |
| D | 0 | 17327 | 1 |
| Quadrant | Total seconds | Saturated seconds | Saturation percentage |
|---|---|---|---|
| A | 6698 | 87 | 1.298895% |
| B | 6698 | 79 | 1.179457% |
| C | 6698 | 64 | 0.955509% |
| D | 6698 | 198 | 2.956106% |
Noise dominated data is calculated using 1-second bins in cleaned event files. If a bin has >2000 counts, and if more than 50% of those come from <1% of pixels, then it is considered to be noise-dominated and hence unusable.
| Quadrant | # 1 sec bins | Bins with >0 counts | Bins with >2000 counts | High rate bins dominated by noise | Noise dominated (total time) | Noise dominated (detector-on time) | Marked lightcurve |
|---|---|---|---|---|---|---|---|
| A | 7668 | 6699 | 16 | 16 | 0.21% | 0.24% | 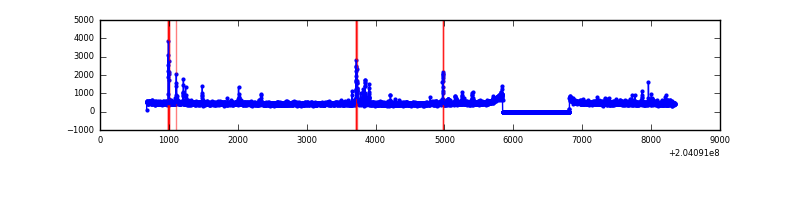 |
| B | 7668 | 6699 | 0 | 0 | 0.00% | 0.00% | 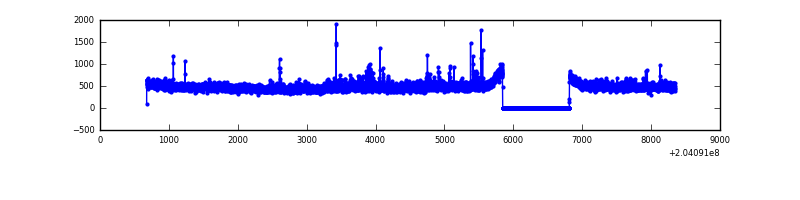 |
| C | 7668 | 6699 | 1 | 1 | 0.01% | 0.01% | 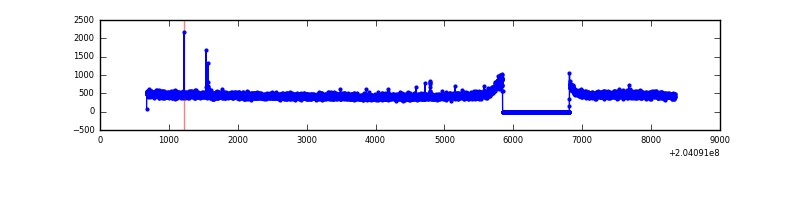 |
| D | 7668 | 6699 | 109 | 109 | 1.42% | 1.63% | 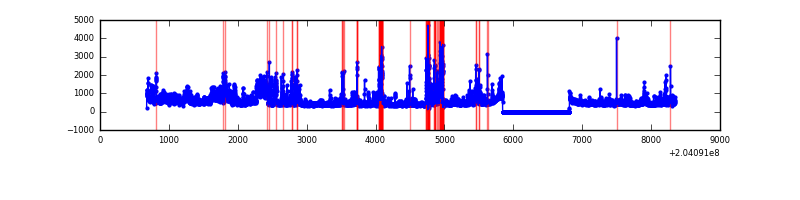 |
Top three noisy pixels from each quadrant. If the there are fewer than three noisy pixels in the level2.evt file, extra rows are filled as -1
| Pixel properties | Quadrant properties | ||||||
|---|---|---|---|---|---|---|---|
| Quadrant | DetID | PixID | Counts | Sigma | Mean | Median | Sigma |
| A | 0 | 118 | 103698 | 646.56 | 781 | 765 | 159.2 |
| A | 0 | 50 | 32030 | 196.39 | 781 | 765 | 159.2 |
| A | 12 | 113 | 28001 | 171.08 | 781 | 765 | 159.2 |
| B | 15 | 204 | 106809 | 691.48 | 792 | 772 | 153.3 |
| B | 4 | 81 | 39550 | 252.88 | 792 | 772 | 153.3 |
| B | 0 | 229 | 30775 | 195.65 | 792 | 772 | 153.3 |
| C | 1 | 16 | 9908 | 51.51 | 764 | 767 | 177.4 |
| C | 13 | 61 | 6429 | 31.91 | 764 | 767 | 177.4 |
| C | 10 | 65 | 2817 | 11.55 | 764 | 767 | 177.4 |
| D | 9 | 82 | 715218 | 4016.8 | 748 | 726 | 177.9 |
| D | 2 | 232 | 505870 | 2839.87 | 748 | 726 | 177.9 |
| D | 13 | 239 | 66510 | 369.83 | 748 | 726 | 177.9 |
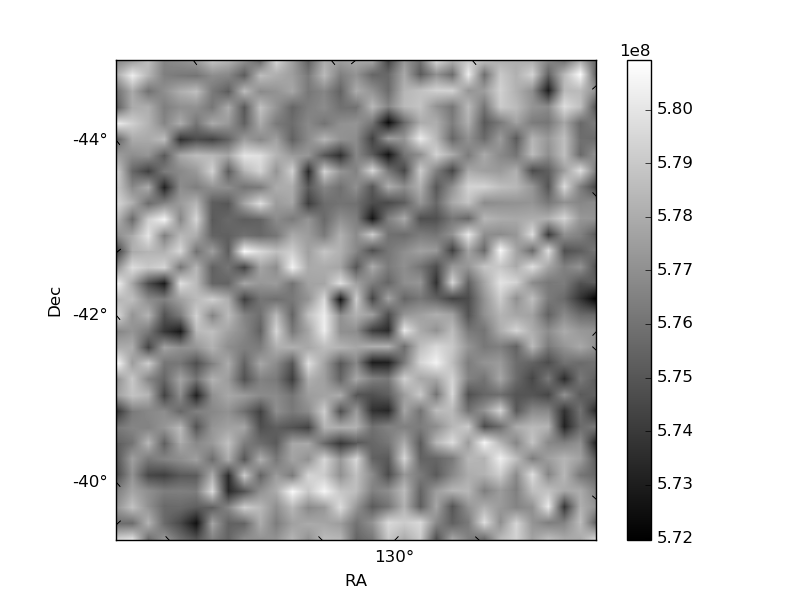
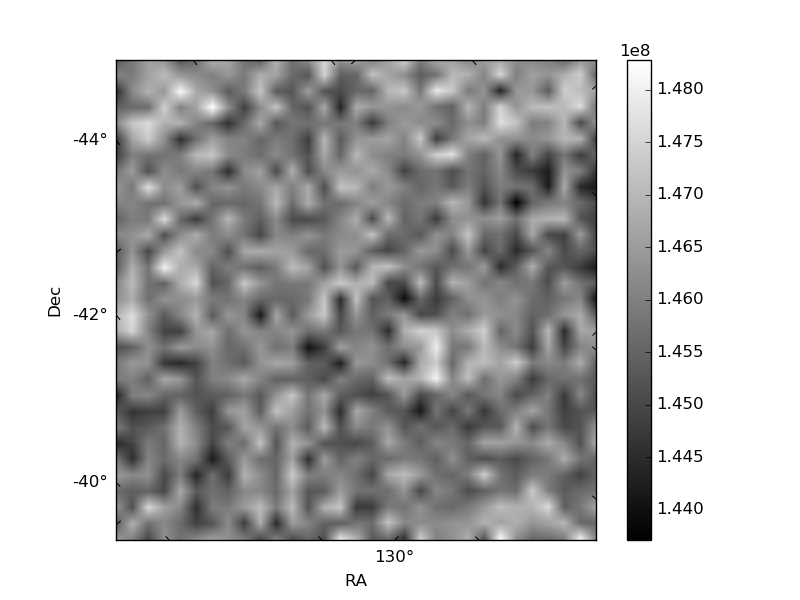
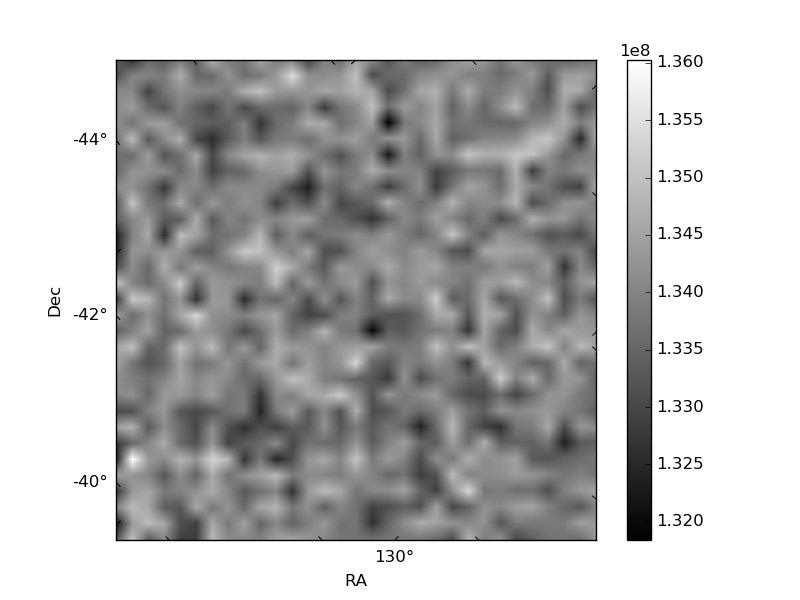
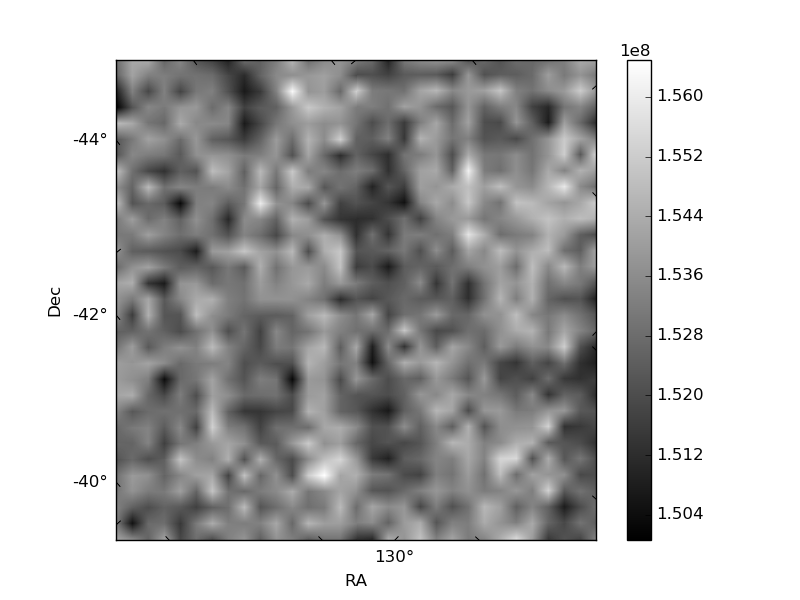
Histogram calculated using DETX and DETY for each event in the final _common_clean file
| Quadrant A | 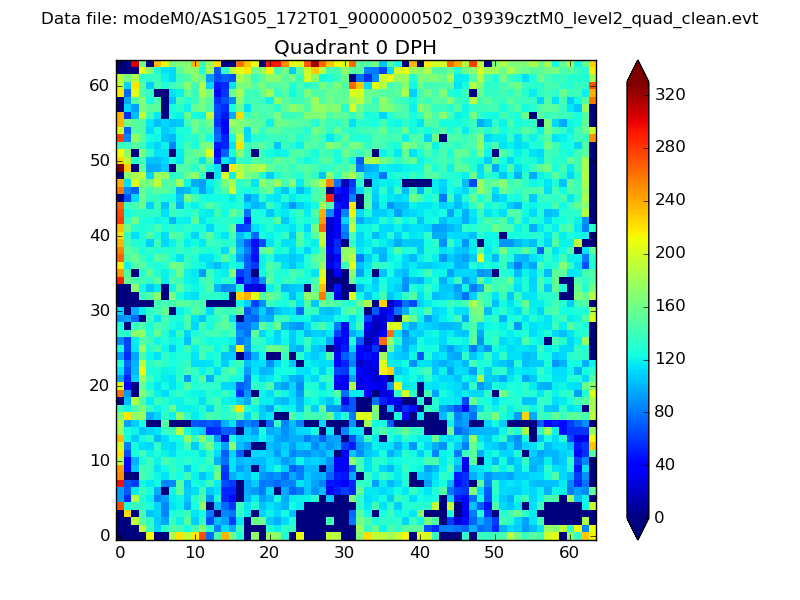 |
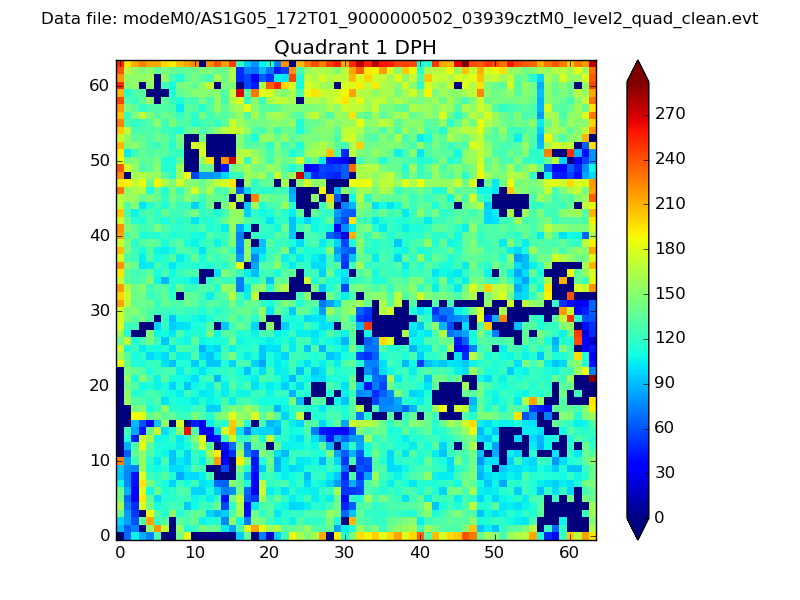 |
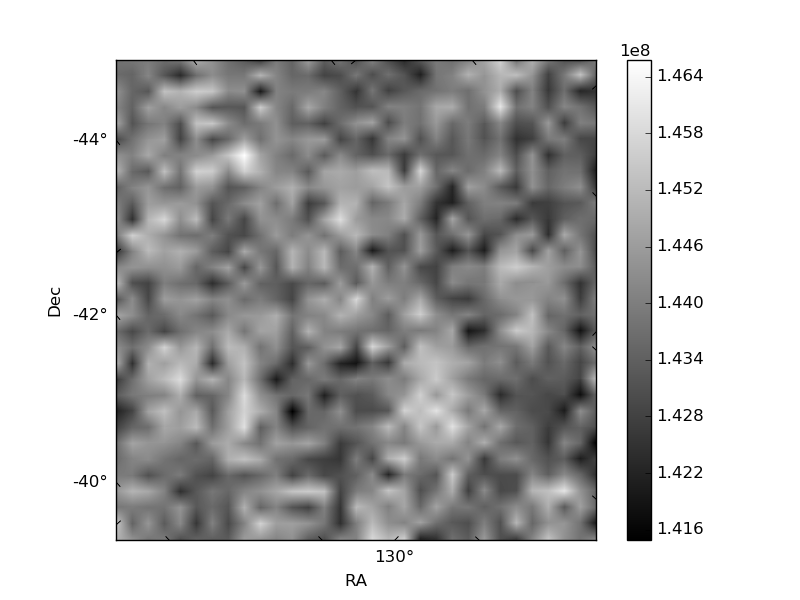
Quadrant B |
|---|---|---|---|
| Quadrant D | 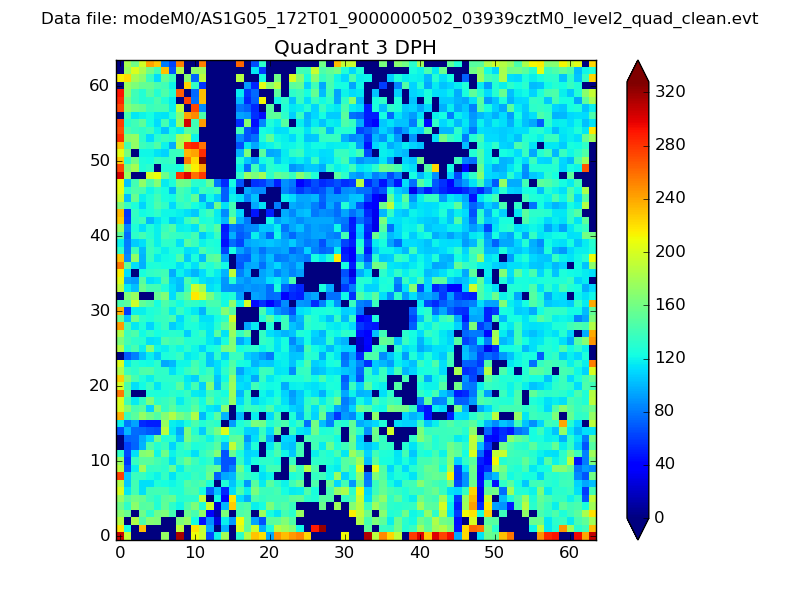 |
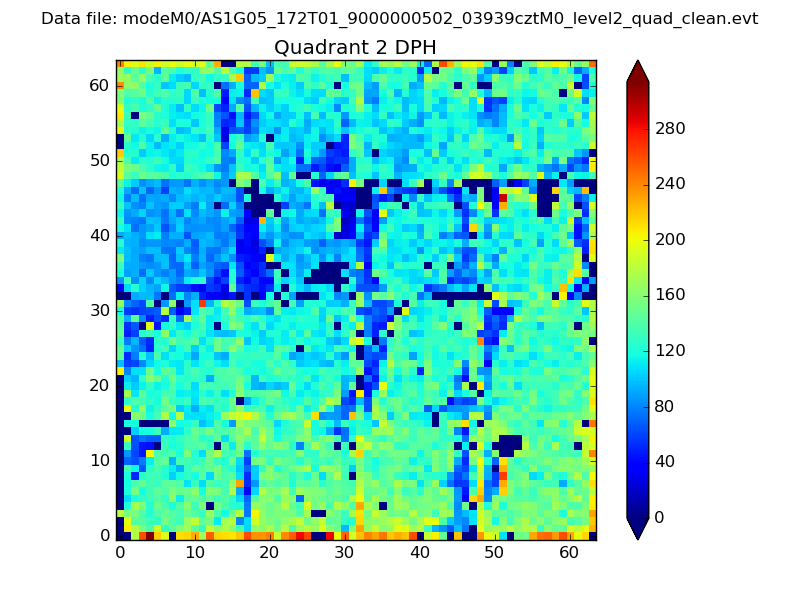 |
Quadrant C |
| Plot type | Count rate plots | Images |
|---|---|---|
| Comparison with Poisson distribution Blue bars denote a histogram of data divided into 1 sec bins. Red curve is a Poisson curve with rate = median count rate of data. |
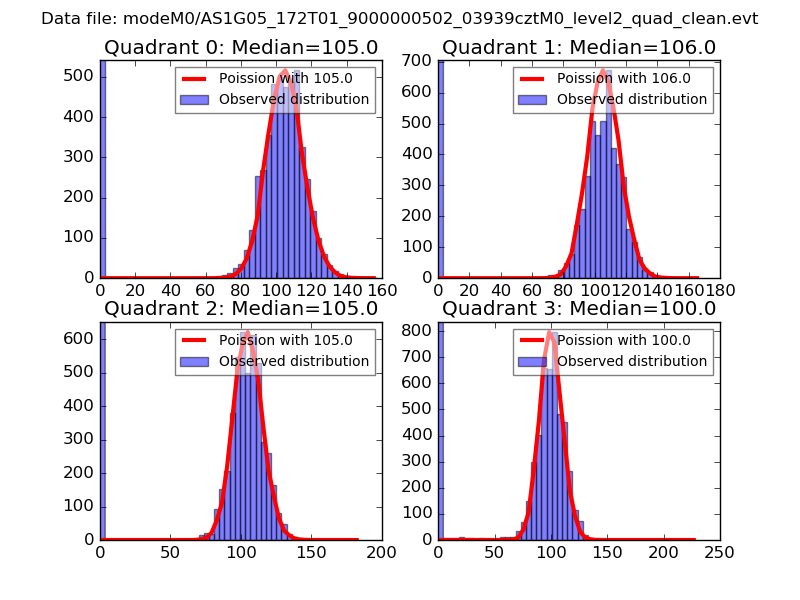 |
 |
| Quadrant-wise count rates Data is divided into 100 sec bins |
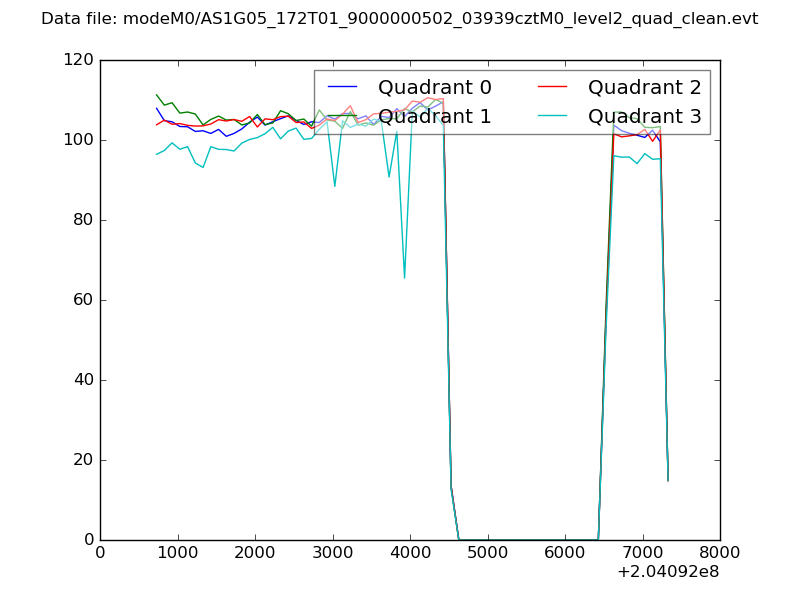 |
|
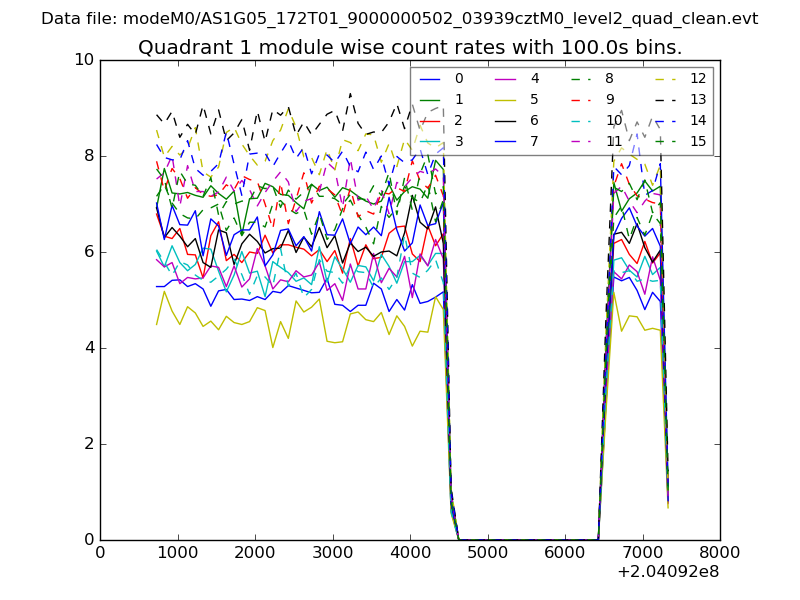
| Module-wise count rates for Quadrant A Data is divided into 100 sec bins |
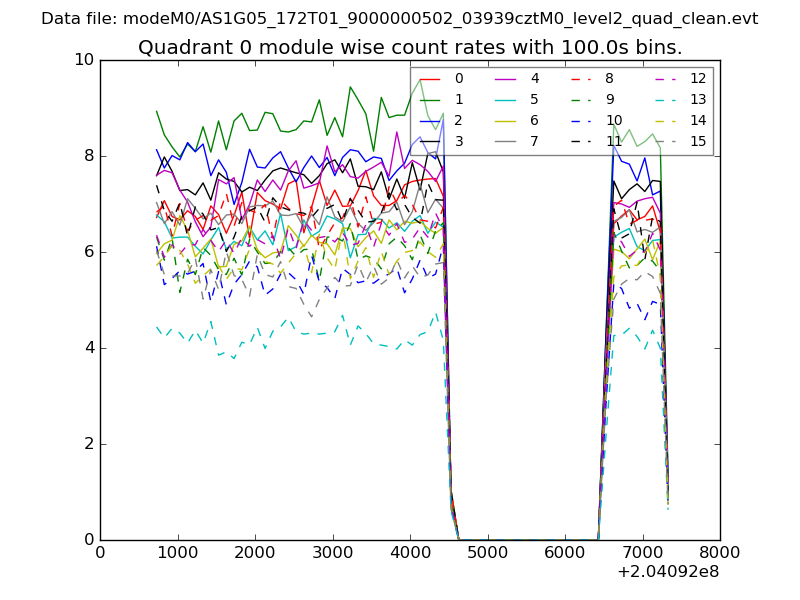 |
 |
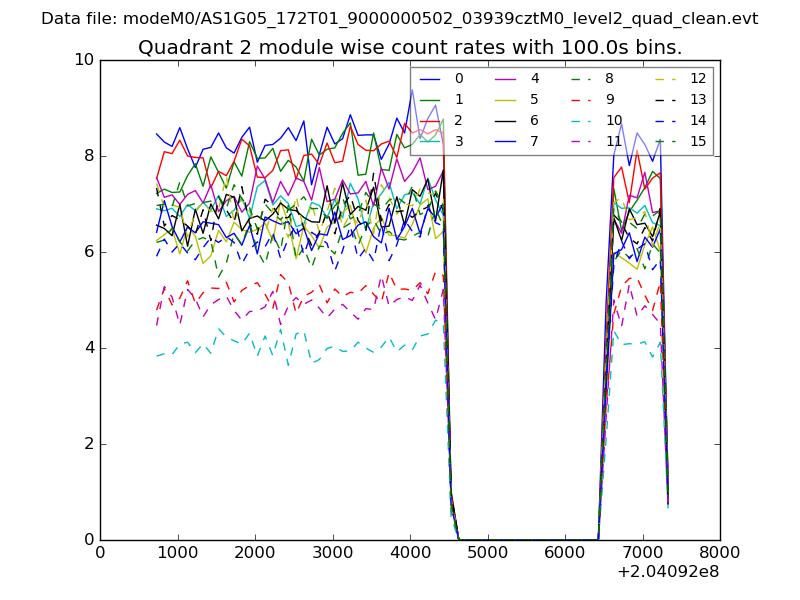
| Module-wise count rates for Quadrant B Data is divided into 100 sec bins |
 |
 |
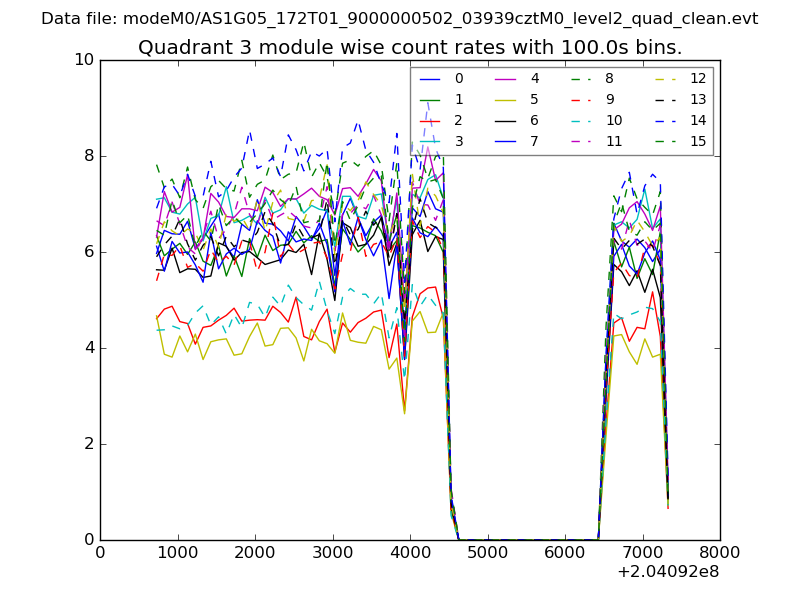
| Module-wise count rates for Quadrant C Data is divided into 100 sec bins |
 |
 |
| Module-wise count rates for Quadrant D Data is divided into 100 sec bins |
 |
 |
| Parameter | Plot |
|---|---|
| CZT HV Monitor | 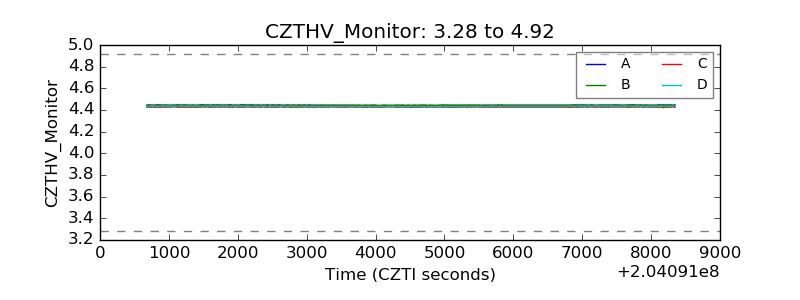 |
| D_VDD | 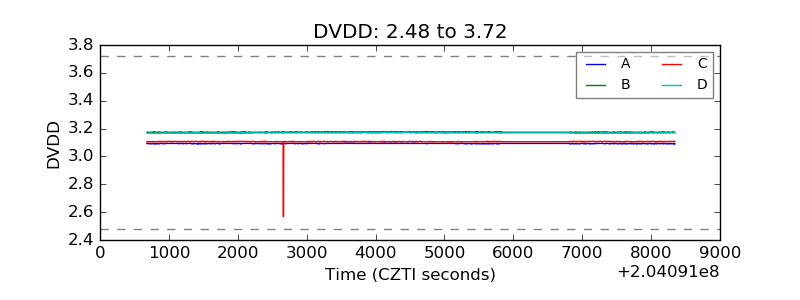 |
| Temperature 1 | 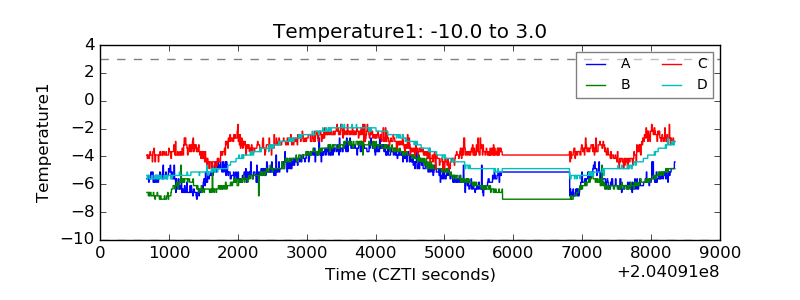 |
| Veto HV Monitor | 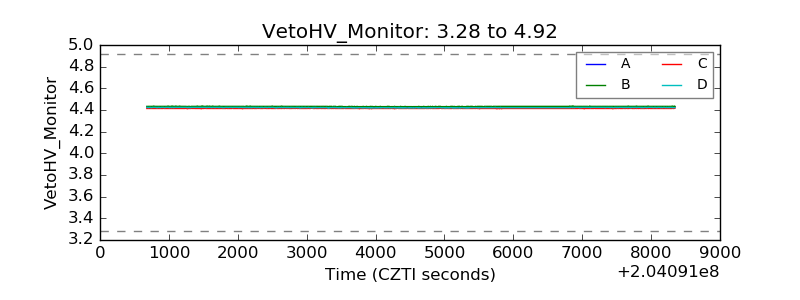 |
| Veto LLD |  |
| Alpha Counter | 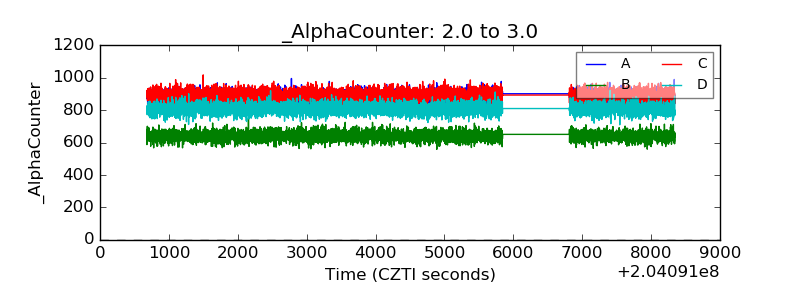 |
| _CPM_Rate | 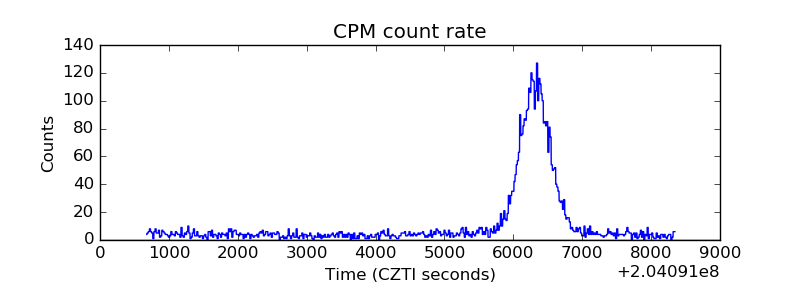 |
| CZT Counter | 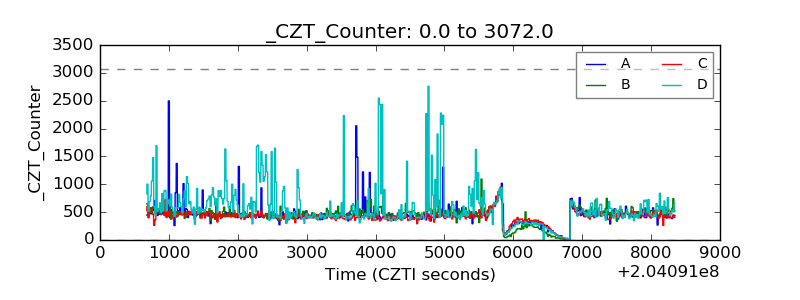 |
| +2.5 Volts monitor |  |
| +5 Volts monitor |  |
| Veto Counter | 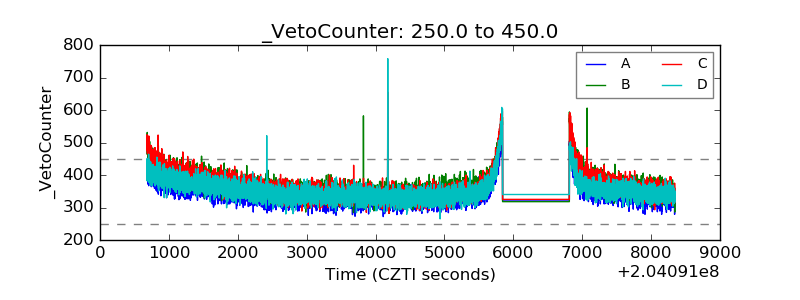 |