| Param | Original file | Final file |
|---|---|---|
| Filename | modeM0/AS1G05_172T01_9000000502_03940cztM0_level2.evt | modeM0/AS1G05_172T01_9000000502_03940cztM0_level2_quad_clean.evt |
| Size (bytes) | 513,383,040 | 85,536,000 |
| Size | 489.6 MB | 81.6 MB |
| Events in quadrant A | 3,605,826 | 520,917 |
| Events in quadrant B | 3,732,842 | 527,718 |
| Events in quadrant C | 3,341,171 | 521,974 |
| Events in quadrant D | 4,359,166 | 498,565 |
| Mode SS | |||
|---|---|---|---|
| Quadrant | BADHDUFLAG | Total packets | Discarded packets |
| A | 0 | 152 | 0 |
| B | 0 | 152 | 0 |
| C | 0 | 152 | 0 |
| D | 0 | 152 | 0 |
| Mode M9 | |||
|---|---|---|---|
| Quadrant | BADHDUFLAG | Total packets | Discarded packets |
| A | 0 | 7 | 0 |
| B | 0 | 7 | 0 |
| C | 0 | 7 | 0 |
| D | 0 | 8 | 0 |
| Mode M0 | |||
|---|---|---|---|
| Quadrant | BADHDUFLAG | Total packets | Discarded packets |
| A | 0 | 15883 | 3 |
| B | 0 | 15978 | 2 |
| C | 0 | 15403 | 2 |
| D | 0 | 18208 | 2 |
| Quadrant | Total seconds | Saturated seconds | Saturation percentage |
|---|---|---|---|
| A | 7488 | 180 | 2.403846% |
| B | 7488 | 163 | 2.176816% |
| C | 7488 | 146 | 1.949786% |
| D | 7488 | 230 | 3.071581% |
Noise dominated data is calculated using 1-second bins in cleaned event files. If a bin has >2000 counts, and if more than 50% of those come from <1% of pixels, then it is considered to be noise-dominated and hence unusable.
| Quadrant | # 1 sec bins | Bins with >0 counts | Bins with >2000 counts | High rate bins dominated by noise | Noise dominated (total time) | Noise dominated (detector-on time) | Marked lightcurve |
|---|---|---|---|---|---|---|---|
| A | 7968 | 7489 | 17 | 17 | 0.21% | 0.23% | 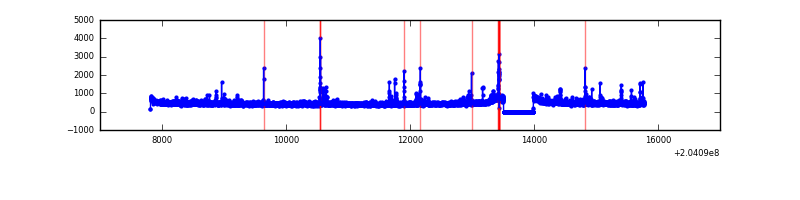 |
| B | 7968 | 7489 | 2 | 2 | 0.03% | 0.03% |  |
| C | 7968 | 7489 | 0 | 0 | 0.00% | 0.00% | 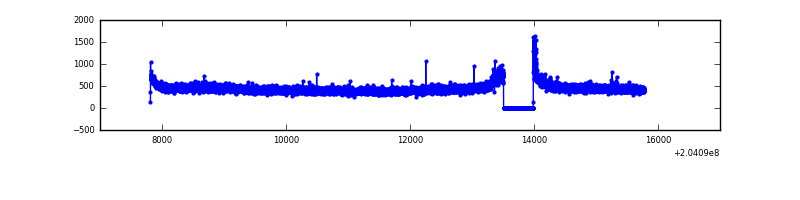 |
| D | 7968 | 7489 | 59 | 59 | 0.74% | 0.79% | 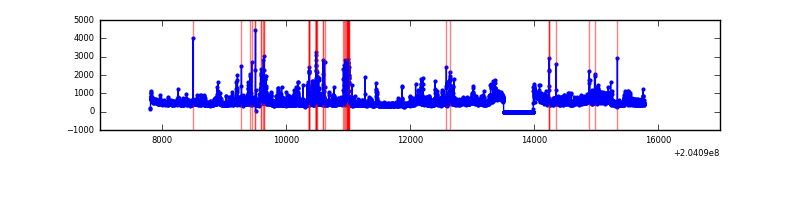 |
Top three noisy pixels from each quadrant. If the there are fewer than three noisy pixels in the level2.evt file, extra rows are filled as -1
| Pixel properties | Quadrant properties | ||||||
|---|---|---|---|---|---|---|---|
| Quadrant | DetID | PixID | Counts | Sigma | Mean | Median | Sigma |
| A | 0 | 118 | 183713 | 1019.73 | 866 | 844 | 179.3 |
| A | 8 | 15 | 42847 | 234.22 | 866 | 844 | 179.3 |
| A | 0 | 226 | 24808 | 133.63 | 866 | 844 | 179.3 |
| B | 14 | 167 | 122294 | 716.12 | 877 | 855 | 169.6 |
| B | 15 | 204 | 107304 | 627.72 | 877 | 855 | 169.6 |
| B | 4 | 81 | 47197 | 273.28 | 877 | 855 | 169.6 |
| C | 9 | 247 | 19311 | 93.93 | 846 | 849 | 196.5 |
| C | 10 | 65 | 9449 | 43.76 | 846 | 849 | 196.5 |
| C | 13 | 61 | 7040 | 31.5 | 846 | 849 | 196.5 |
| D | 9 | 82 | 629820 | 3132.33 | 837 | 813 | 200.8 |
| D | 2 | 232 | 233540 | 1158.94 | 837 | 813 | 200.8 |
| D | 2 | 63 | 85650 | 422.47 | 837 | 813 | 200.8 |
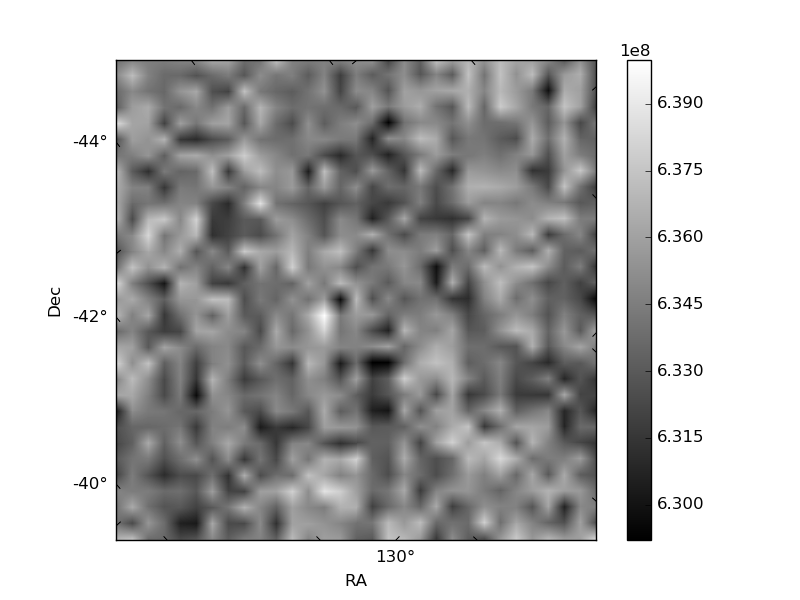
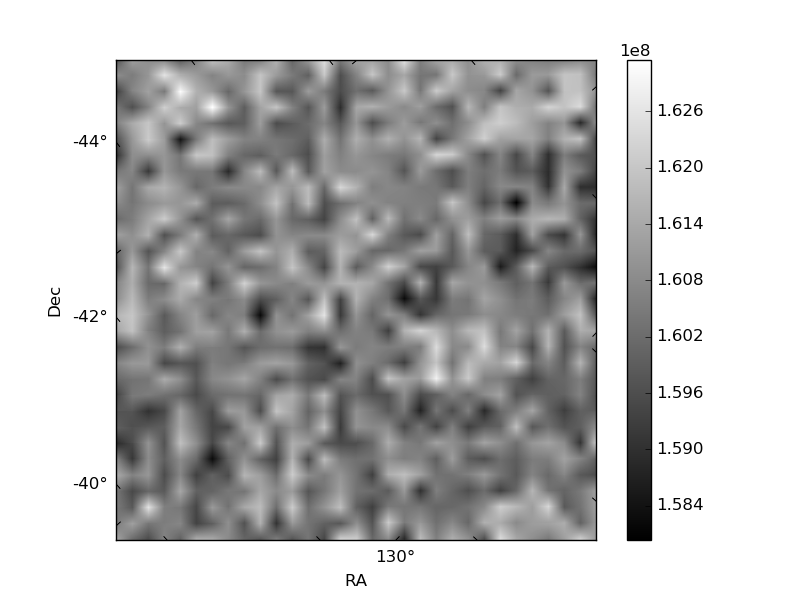
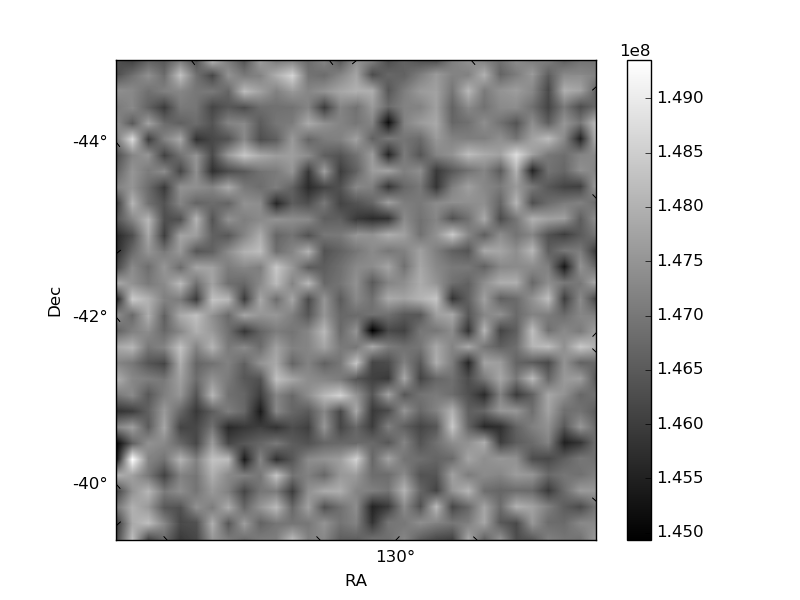
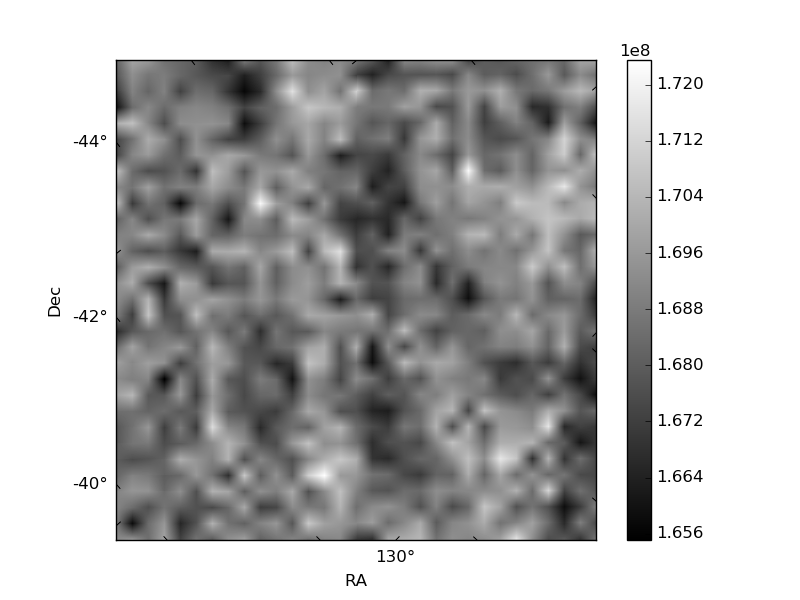
Histogram calculated using DETX and DETY for each event in the final _common_clean file
| Quadrant A |  |
 |
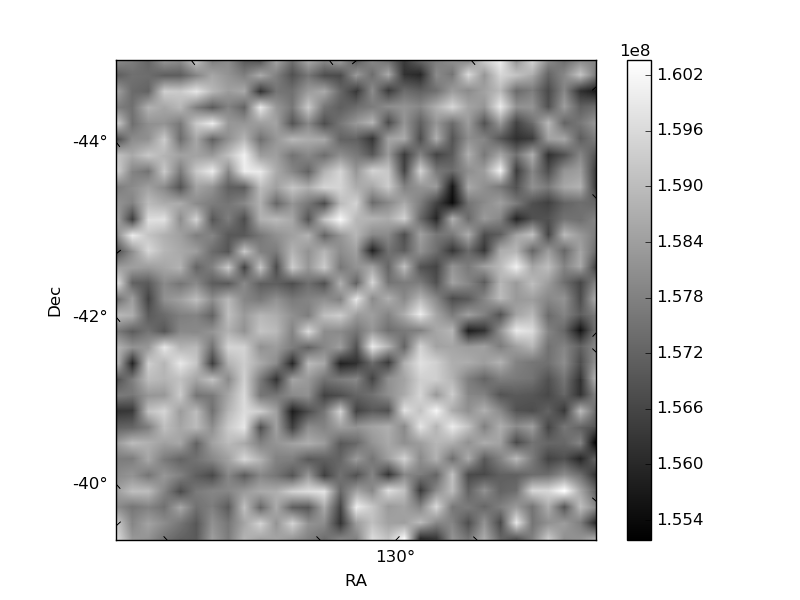
Quadrant B |
|---|---|---|---|
| Quadrant D | 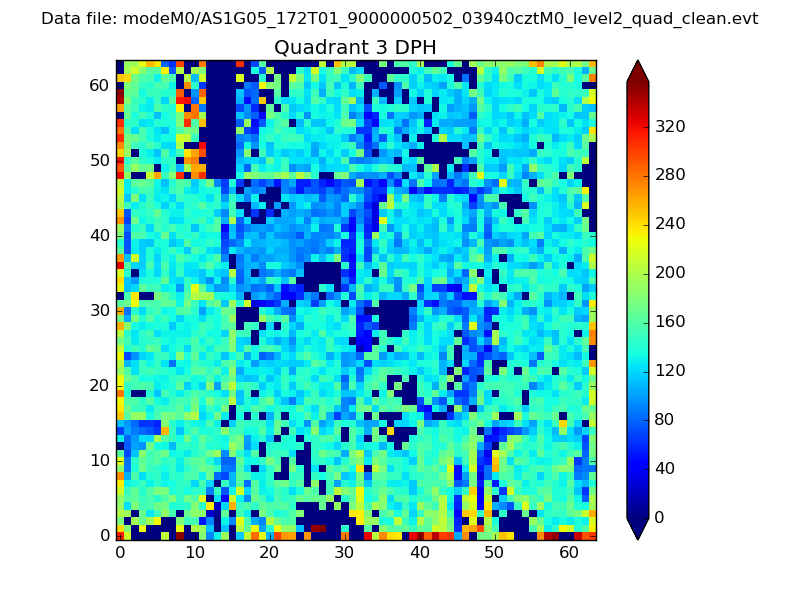 |
 |
Quadrant C |
| Plot type | Count rate plots | Images |
|---|---|---|
| Comparison with Poisson distribution Blue bars denote a histogram of data divided into 1 sec bins. Red curve is a Poisson curve with rate = median count rate of data. |
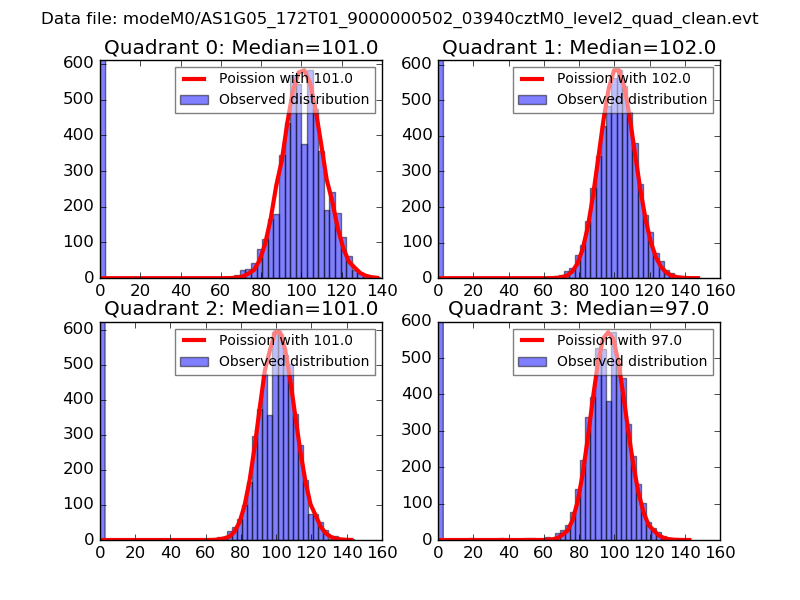 |
 |
| Quadrant-wise count rates Data is divided into 100 sec bins |
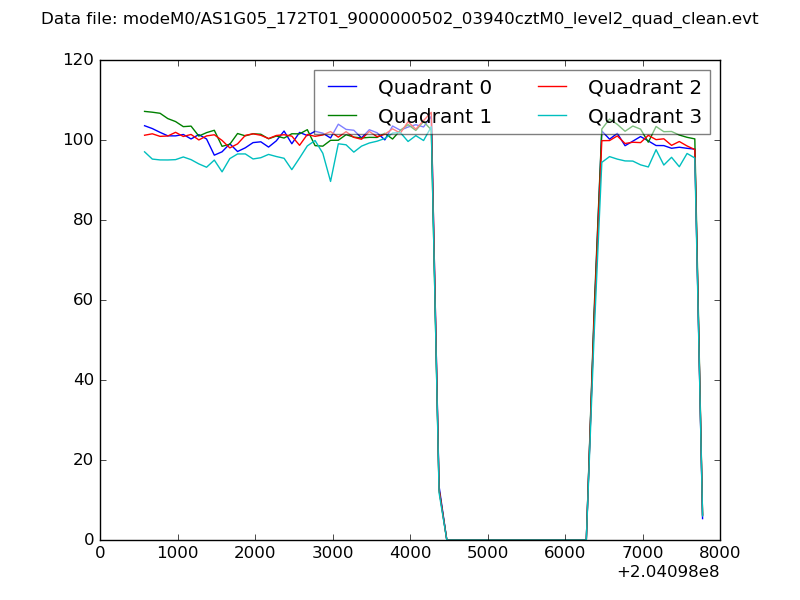 |
|
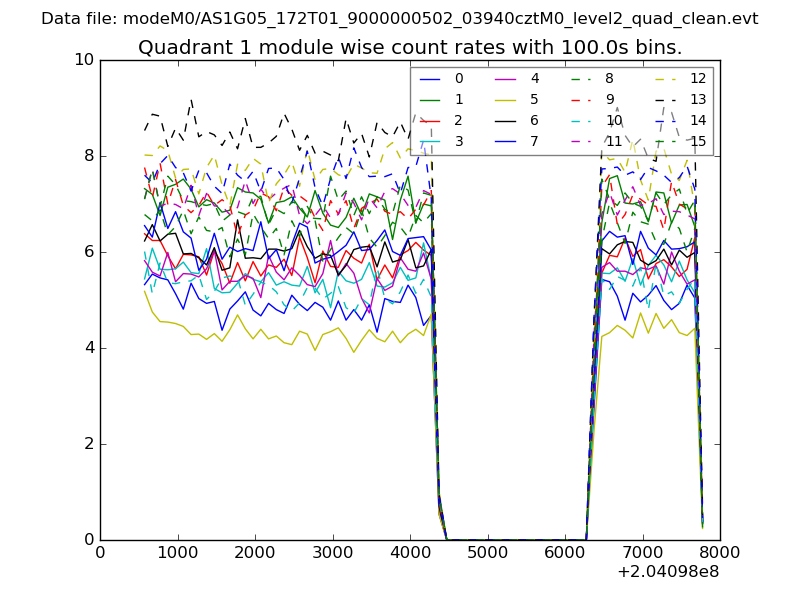
| Module-wise count rates for Quadrant A Data is divided into 100 sec bins |
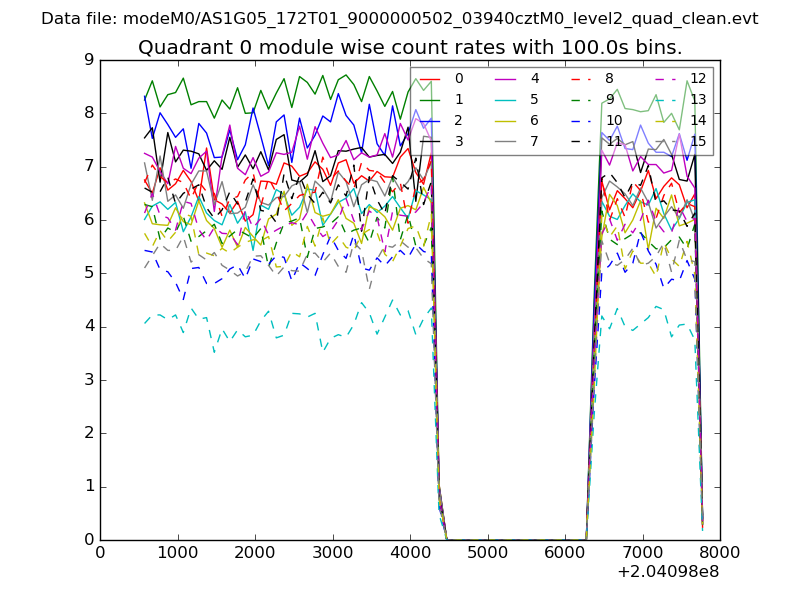 |
 |
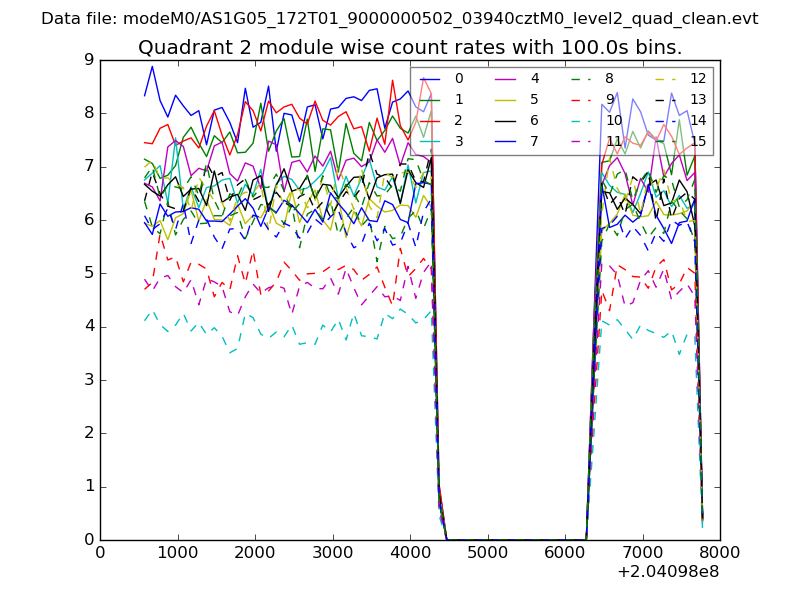
| Module-wise count rates for Quadrant B Data is divided into 100 sec bins |
 |
 |
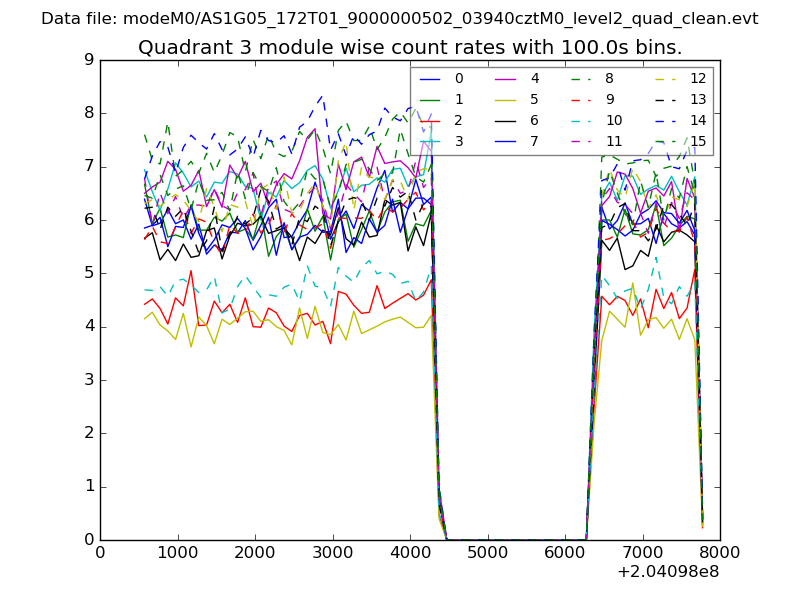
| Module-wise count rates for Quadrant C Data is divided into 100 sec bins |
 |
 |
| Module-wise count rates for Quadrant D Data is divided into 100 sec bins |
 |
 |
| Parameter | Plot |
|---|---|
| CZT HV Monitor | 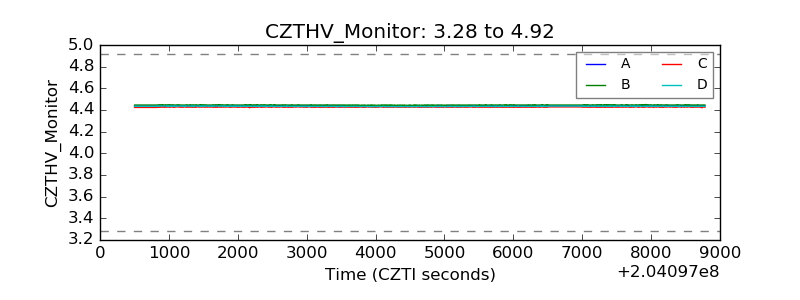 |
| D_VDD | 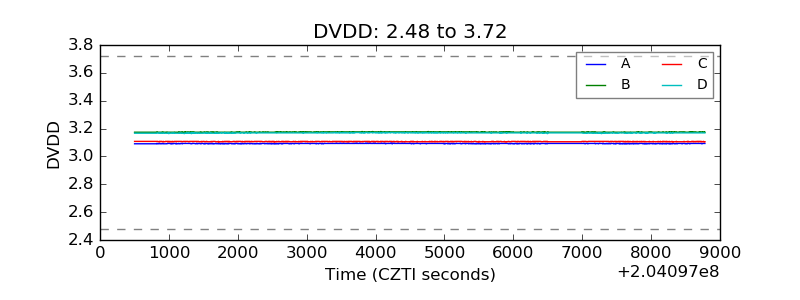 |
| Temperature 1 | 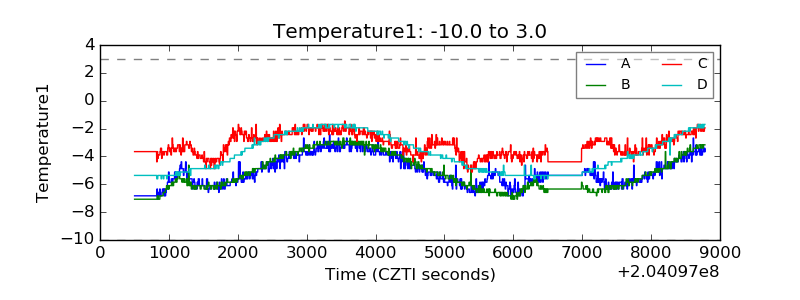 |
| Veto HV Monitor |  |
| Veto LLD | 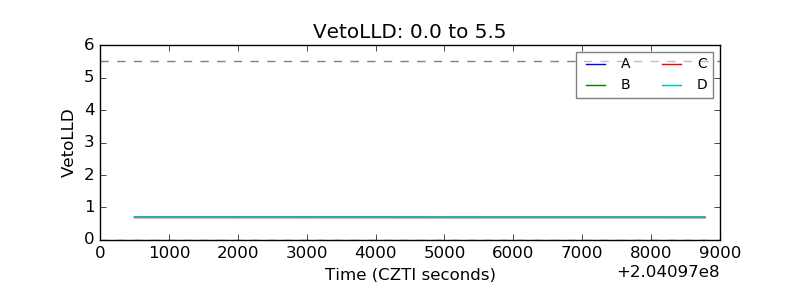 |
| Alpha Counter | 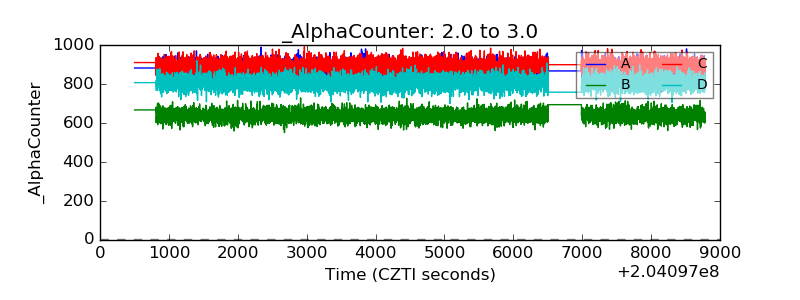 |
| _CPM_Rate | 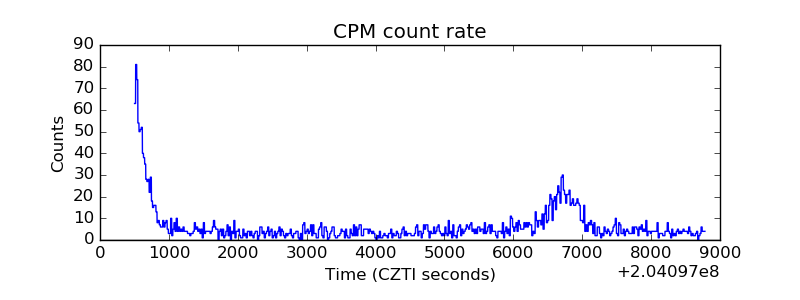 |
| CZT Counter |  |
| +2.5 Volts monitor |  |
| +5 Volts monitor |  |
| Veto Counter | 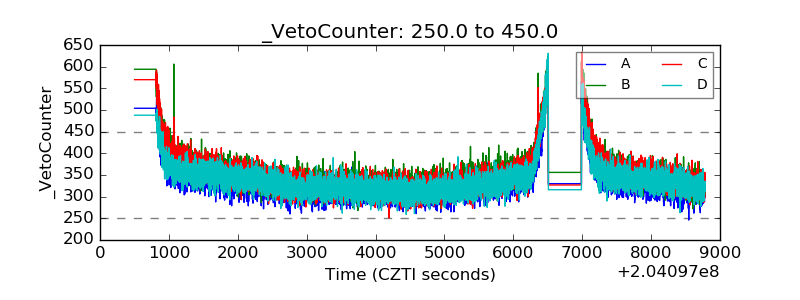 |