| Param | Original file | Final file |
|---|---|---|
| Filename | modeM0/AS1G05_172T01_9000000502_03942cztM0_level2.evt | modeM0/AS1G05_172T01_9000000502_03942cztM0_level2_quad_clean.evt |
| Size (bytes) | 492,969,600 | 86,970,240 |
| Size | 470.1 MB | 82.9 MB |
| Events in quadrant A | 3,649,440 | 532,230 |
| Events in quadrant B | 3,536,058 | 540,439 |
| Events in quadrant C | 3,251,904 | 535,432 |
| Events in quadrant D | 3,993,995 | 515,079 |
| Mode SS | |||
|---|---|---|---|
| Quadrant | BADHDUFLAG | Total packets | Discarded packets |
| A | 0 | 146 | 0 |
| B | 0 | 146 | 0 |
| C | 0 | 146 | 0 |
| D | 0 | 146 | 0 |
| Mode M0 | |||
|---|---|---|---|
| Quadrant | BADHDUFLAG | Total packets | Discarded packets |
| A | 0 | 15925 | 4 |
| B | 0 | 15360 | 1 |
| C | 0 | 15103 | 5 |
| D | 0 | 17169 | 5 |
| Quadrant | Total seconds | Saturated seconds | Saturation percentage |
|---|---|---|---|
| A | 7332 | 228 | 3.109656% |
| B | 7333 | 161 | 2.195554% |
| C | 7331 | 84 | 1.145819% |
| D | 7331 | 285 | 3.887601% |
Noise dominated data is calculated using 1-second bins in cleaned event files. If a bin has >2000 counts, and if more than 50% of those come from <1% of pixels, then it is considered to be noise-dominated and hence unusable.
| Quadrant | # 1 sec bins | Bins with >0 counts | Bins with >2000 counts | High rate bins dominated by noise | Noise dominated (total time) | Noise dominated (detector-on time) | Marked lightcurve |
|---|---|---|---|---|---|---|---|
| A | 7368 | 7334 | 24 | 24 | 0.33% | 0.33% | 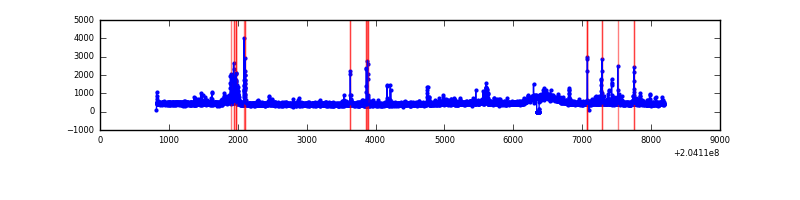 |
| B | 7368 | 7334 | 0 | 0 | 0.00% | 0.00% | 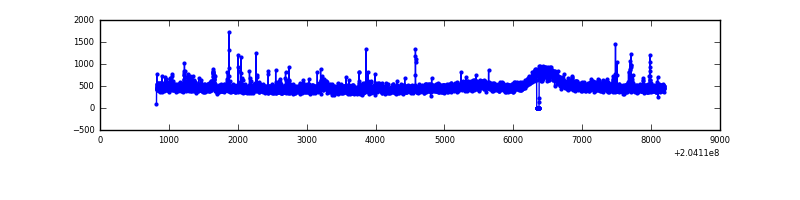 |
| C | 7368 | 7334 | 0 | 0 | 0.00% | 0.00% | 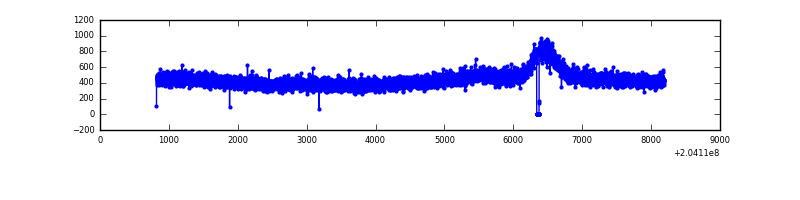 |
| D | 7368 | 7334 | 105 | 105 | 1.43% | 1.43% | 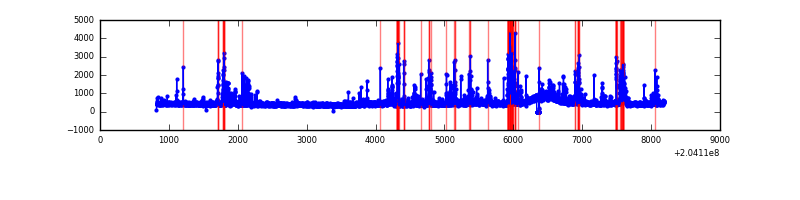 |
Top three noisy pixels from each quadrant. If the there are fewer than three noisy pixels in the level2.evt file, extra rows are filled as -1
| Pixel properties | Quadrant properties | ||||||
|---|---|---|---|---|---|---|---|
| Quadrant | DetID | PixID | Counts | Sigma | Mean | Median | Sigma |
| A | 0 | 118 | 200084 | 1126.99 | 852 | 830 | 176.8 |
| A | 0 | 199 | 77786 | 435.27 | 852 | 830 | 176.8 |
| A | 0 | 226 | 33774 | 186.33 | 852 | 830 | 176.8 |
| B | 15 | 204 | 64407 | 380.39 | 861 | 838 | 167.1 |
| B | 14 | 167 | 64251 | 379.46 | 861 | 838 | 167.1 |
| B | 4 | 81 | 26085 | 151.07 | 861 | 838 | 167.1 |
| C | 13 | 61 | 6926 | 31.21 | 829 | 830 | 195.3 |
| C | 8 | 128 | 6514 | 29.1 | 829 | 830 | 195.3 |
| C | 8 | 112 | 3226 | 12.27 | 829 | 830 | 195.3 |
| D | 2 | 232 | 345823 | 1715.48 | 824 | 796 | 201.1 |
| D | 13 | 248 | 193492 | 958.09 | 824 | 796 | 201.1 |
| D | 13 | 239 | 100196 | 494.22 | 824 | 796 | 201.1 |
Histogram calculated using DETX and DETY for each event in the final _common_clean file
| Quadrant A | 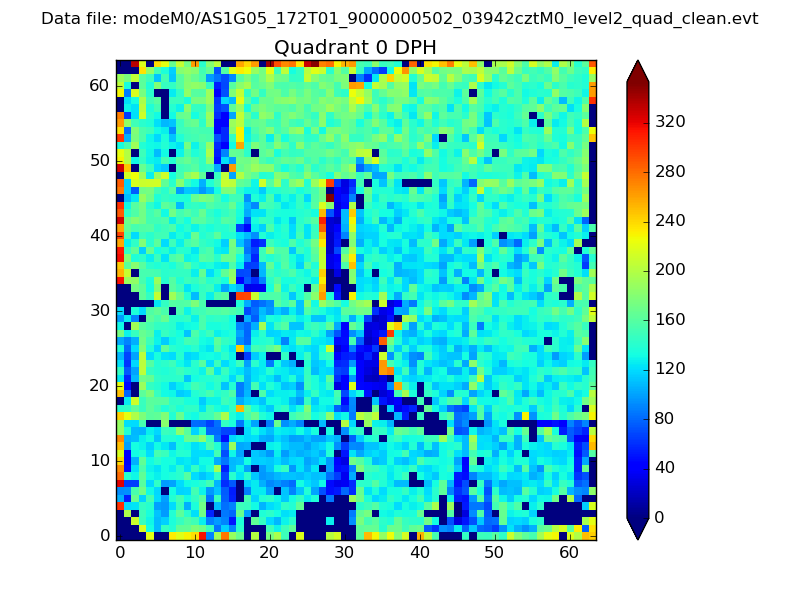 |
 |
Quadrant B |
|---|---|---|---|
| Quadrant D |  |
 |
Quadrant C |
| Plot type | Count rate plots | Images |
|---|---|---|
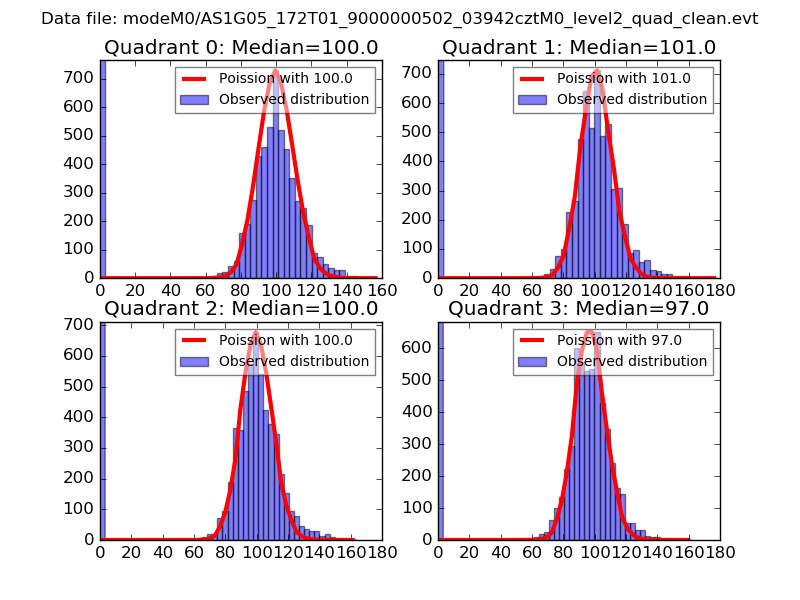
| Comparison with Poisson distribution Blue bars denote a histogram of data divided into 1 sec bins. Red curve is a Poisson curve with rate = median count rate of data. |
 |
 |
| Quadrant-wise count rates Data is divided into 100 sec bins |
 |
|
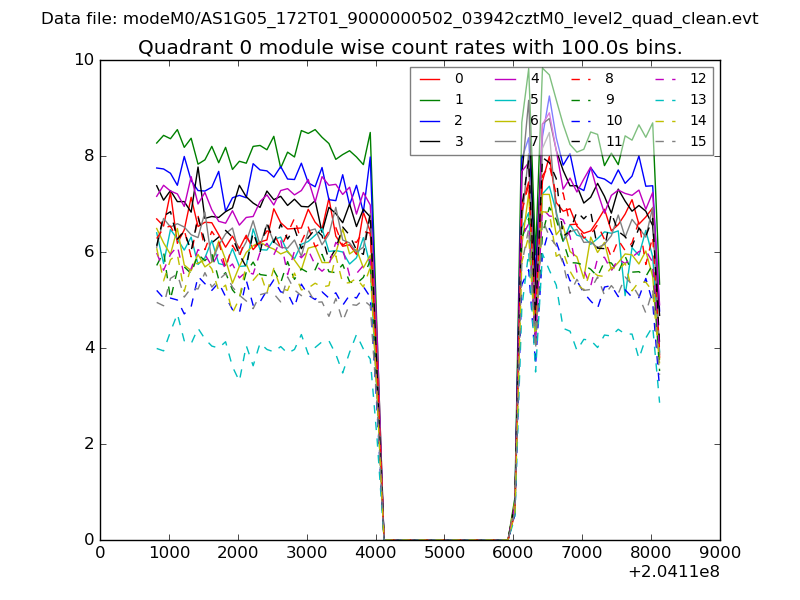
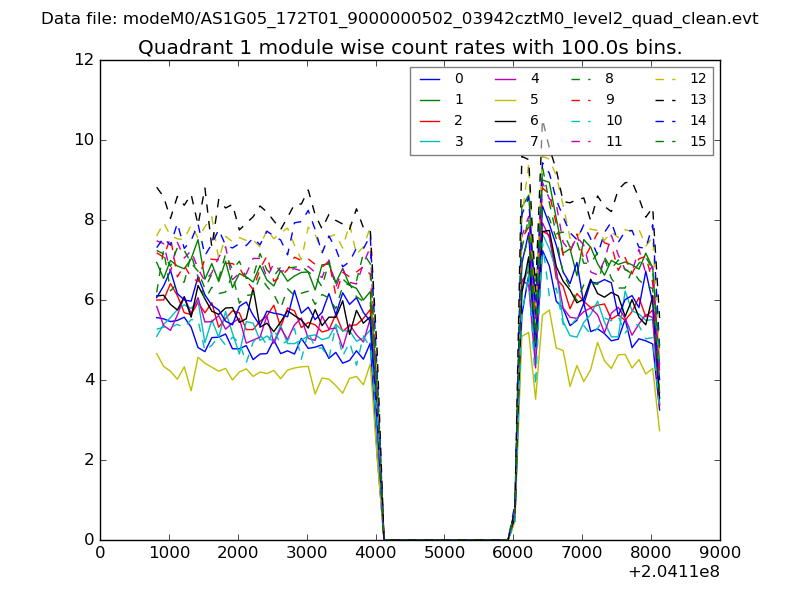
| Module-wise count rates for Quadrant A Data is divided into 100 sec bins |
 |
 |
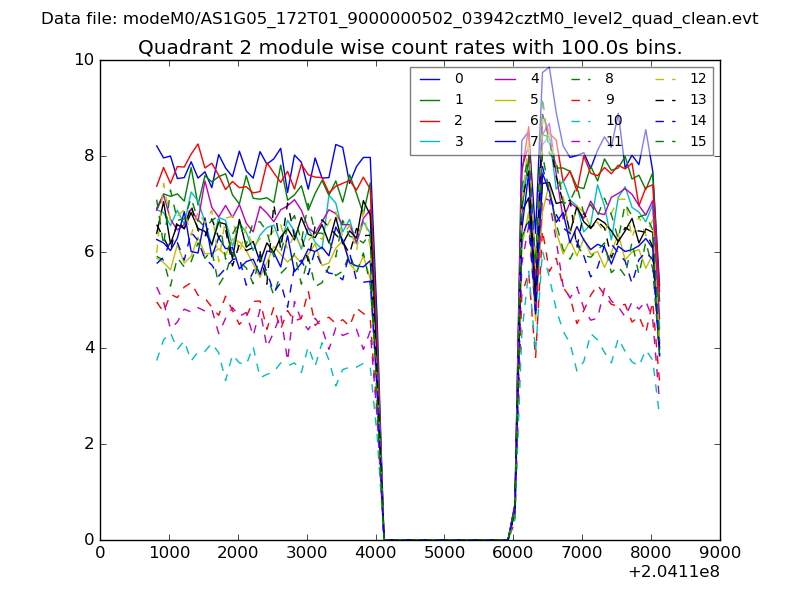
| Module-wise count rates for Quadrant B Data is divided into 100 sec bins |
 |
 |
| Module-wise count rates for Quadrant C Data is divided into 100 sec bins |
 |
 |
| Module-wise count rates for Quadrant D Data is divided into 100 sec bins |
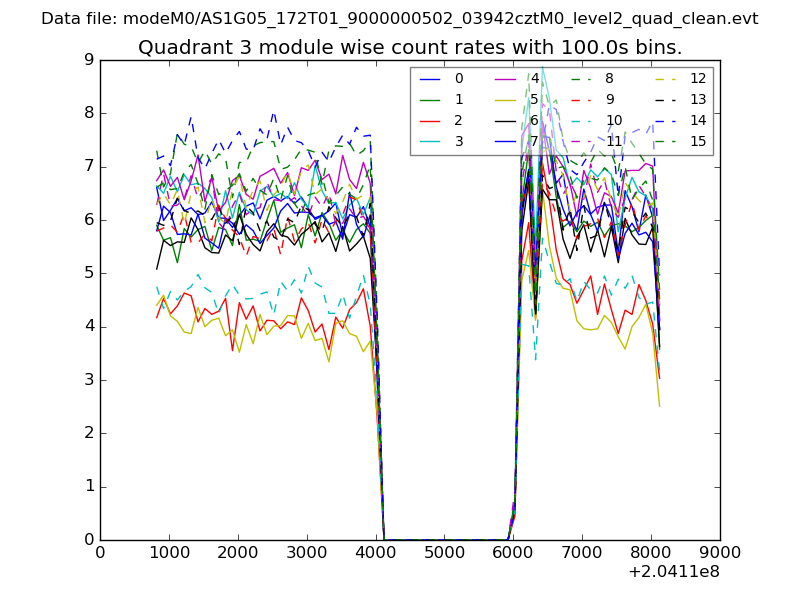 |
 |
| Parameter | Plot |
|---|---|
| CZT HV Monitor | 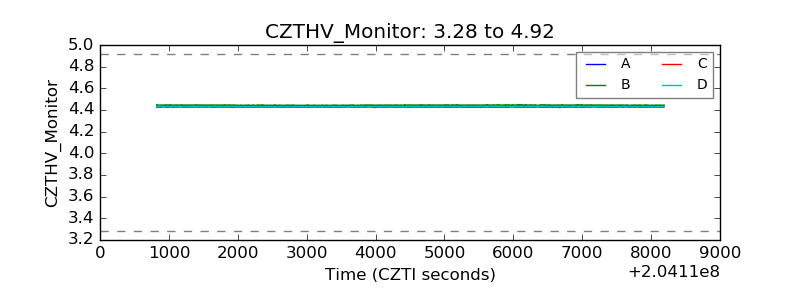 |
| D_VDD | 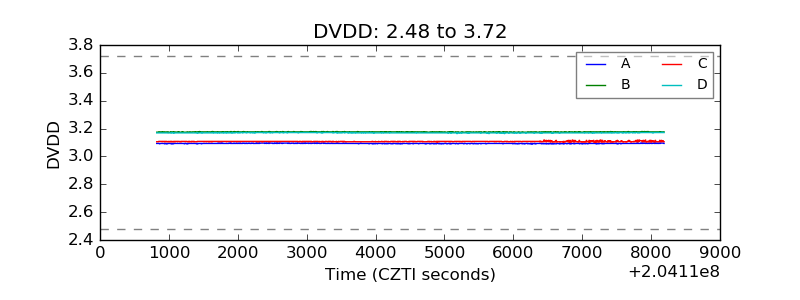 |
| Temperature 1 | 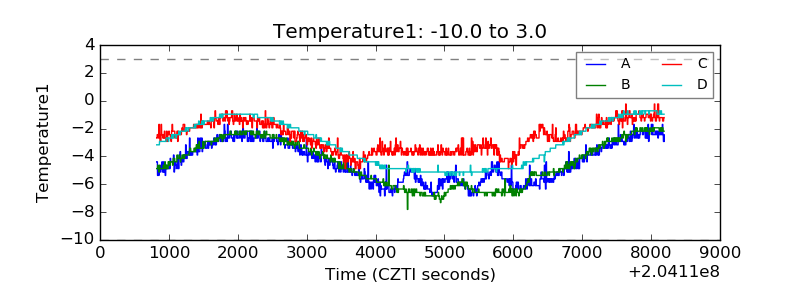 |
| Veto HV Monitor | 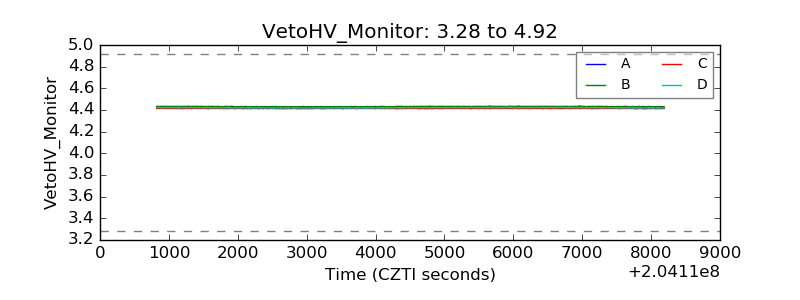 |
| Veto LLD | 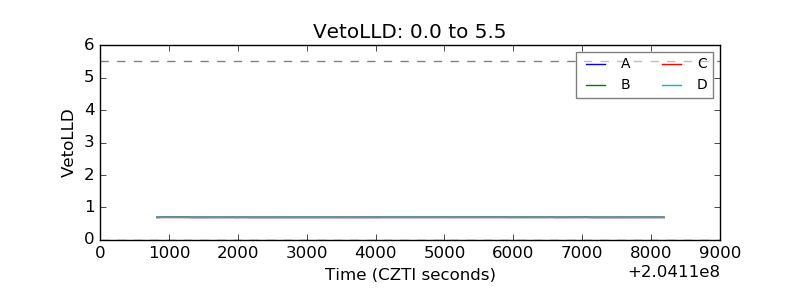 |
| Alpha Counter | 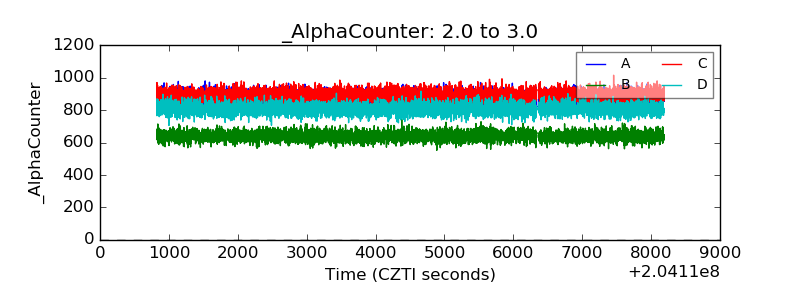 |
| _CPM_Rate | 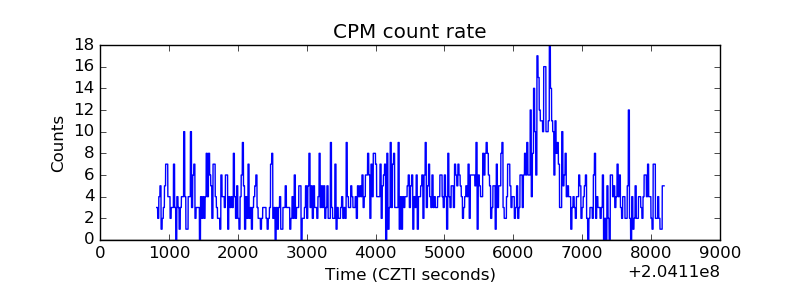 |
| CZT Counter | 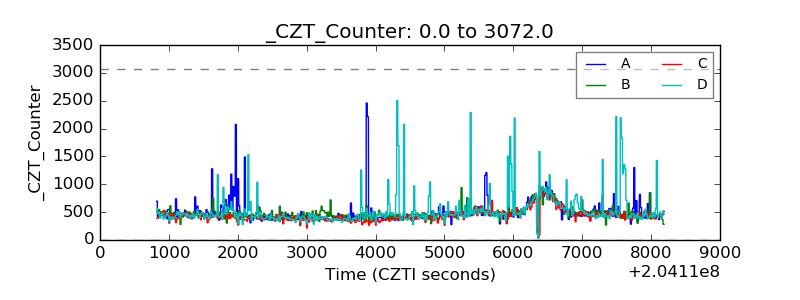 |
| +2.5 Volts monitor |  |
| +5 Volts monitor |  |
| Veto Counter | 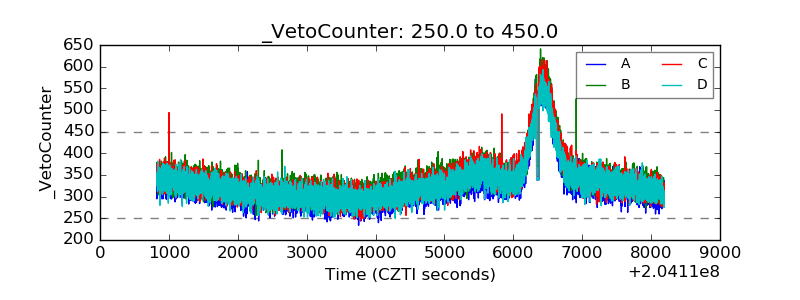 |