| Param | Original file | Final file |
|---|---|---|
| Filename | modeM0/AS1G05_172T01_9000000502_03945cztM0_level2.evt | modeM0/AS1G05_172T01_9000000502_03945cztM0_level2_quad_clean.evt |
| Size (bytes) | 1,245,499,200 | 206,300,160 |
| Size | 1.2 GB | 196.7 MB |
| Events in quadrant A | 9,614,518 | 1,249,515 |
| Events in quadrant B | 9,111,947 | 1,258,058 |
| Events in quadrant C | 8,008,822 | 1,252,457 |
| Events in quadrant D | 9,729,815 | 1,209,407 |
| Mode SS | |||
|---|---|---|---|
| Quadrant | BADHDUFLAG | Total packets | Discarded packets |
| A | 0 | 376 | 0 |
| B | 0 | 376 | 0 |
| C | 0 | 376 | 0 |
| D | 0 | 376 | 0 |
| Mode M9 | |||
|---|---|---|---|
| Quadrant | BADHDUFLAG | Total packets | Discarded packets |
| A | 0 | 17 | 0 |
| B | 0 | 17 | 0 |
| C | 0 | 17 | 0 |
| D | 0 | 17 | 0 |
| Mode M0 | |||
|---|---|---|---|
| Quadrant | BADHDUFLAG | Total packets | Discarded packets |
| A | 0 | 41470 | 34 |
| B | 0 | 39316 | 40 |
| C | 0 | 37590 | 39 |
| D | 0 | 42503 | 39 |
| Quadrant | Total seconds | Saturated seconds | Saturation percentage |
|---|---|---|---|
| A | 18557 | 388 | 2.090855% |
| B | 18554 | 138 | 0.743775% |
| C | 18552 | 43 | 0.231781% |
| D | 18554 | 346 | 1.864827% |
Noise dominated data is calculated using 1-second bins in cleaned event files. If a bin has >2000 counts, and if more than 50% of those come from <1% of pixels, then it is considered to be noise-dominated and hence unusable.
| Quadrant | # 1 sec bins | Bins with >0 counts | Bins with >2000 counts | High rate bins dominated by noise | Noise dominated (total time) | Noise dominated (detector-on time) | Marked lightcurve |
|---|---|---|---|---|---|---|---|
| A | 20262 | 18574 | 172 | 172 | 0.85% | 0.93% |  |
| B | 20262 | 18573 | 15 | 15 | 0.07% | 0.08% | 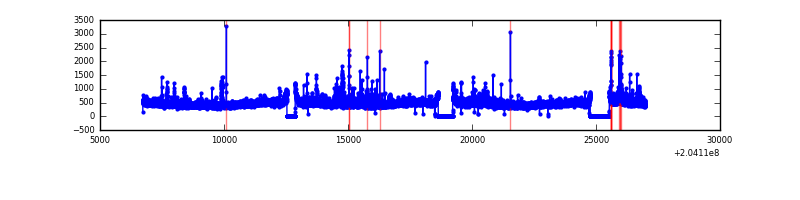 |
| C | 20262 | 18574 | 0 | 0 | 0.00% | 0.00% | 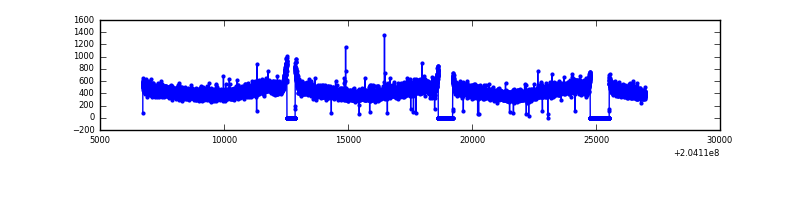 |
| D | 20261 | 18573 | 195 | 195 | 0.96% | 1.05% | 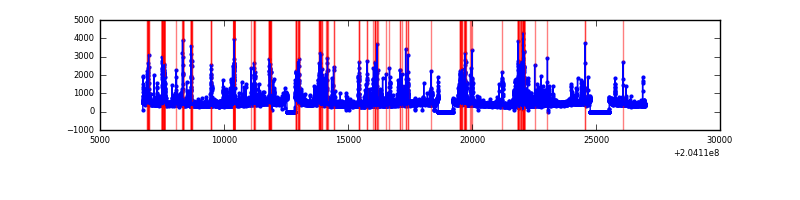 |
Top three noisy pixels from each quadrant. If the there are fewer than three noisy pixels in the level2.evt file, extra rows are filled as -1
| Pixel properties | Quadrant properties | ||||||
|---|---|---|---|---|---|---|---|
| Quadrant | DetID | PixID | Counts | Sigma | Mean | Median | Sigma |
| A | 0 | 118 | 845054 | 1975.35 | 2091 | 2044 | 426.8 |
| A | 0 | 50 | 284786 | 662.52 | 2091 | 2044 | 426.8 |
| A | 8 | 15 | 119107 | 274.3 | 2091 | 2044 | 426.8 |
| B | 15 | 204 | 488577 | 1189.93 | 2118 | 2064 | 408.9 |
| B | 3 | 0 | 135761 | 327.0 | 2118 | 2064 | 408.9 |
| B | 4 | 81 | 55979 | 131.87 | 2118 | 2064 | 408.9 |
| C | 8 | 128 | 34571 | 68.94 | 2025 | 2031 | 472.0 |
| C | 10 | 65 | 18452 | 34.79 | 2025 | 2031 | 472.0 |
| C | 13 | 61 | 17155 | 32.04 | 2025 | 2031 | 472.0 |
| D | 2 | 232 | 928935 | 1914.23 | 2014 | 1952 | 484.3 |
| D | 2 | 63 | 298502 | 612.38 | 2014 | 1952 | 484.3 |
| D | 13 | 223 | 255373 | 523.32 | 2014 | 1952 | 484.3 |
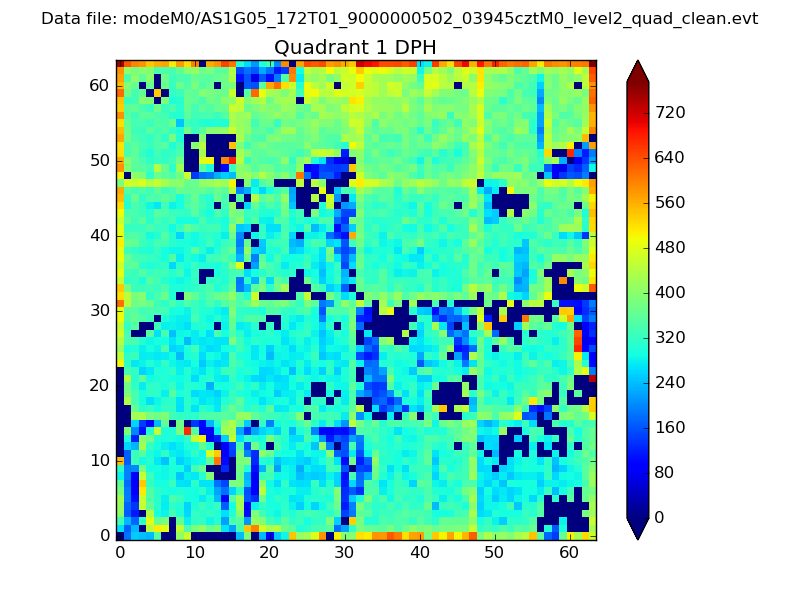
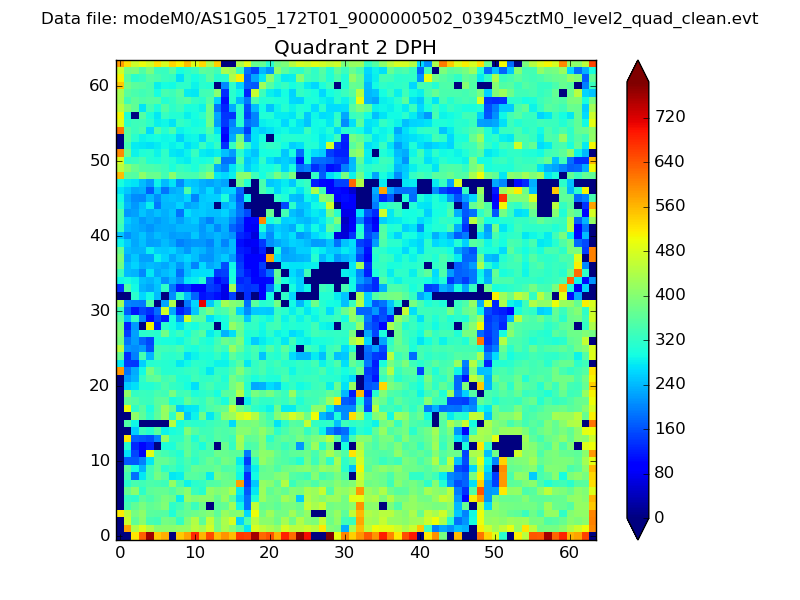
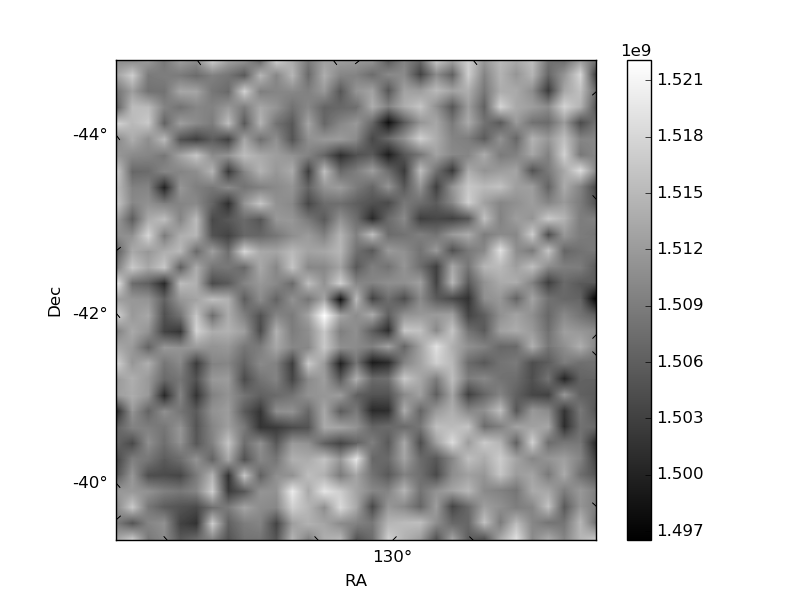
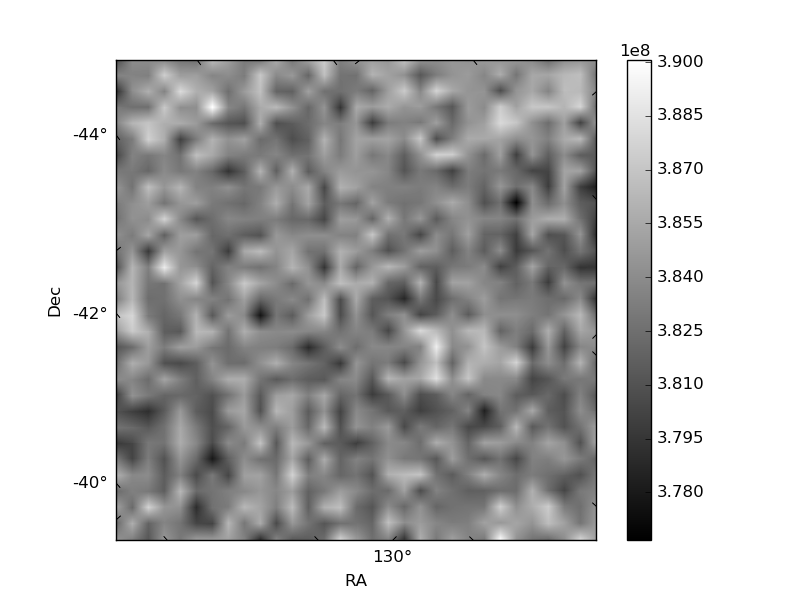
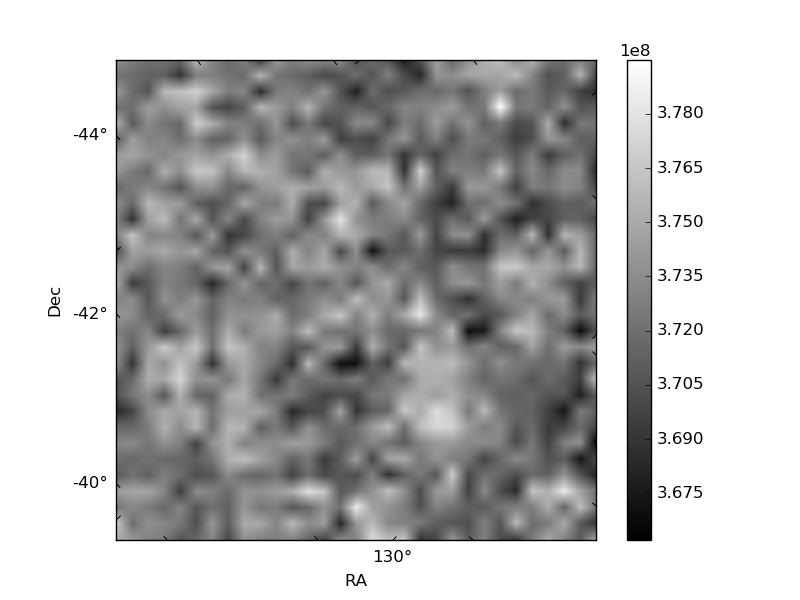
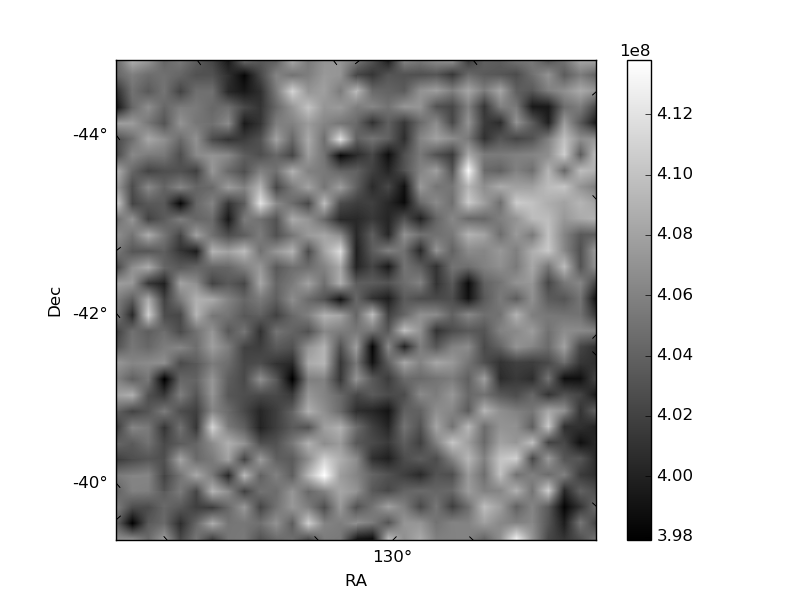
Histogram calculated using DETX and DETY for each event in the final _common_clean file
| Quadrant A | 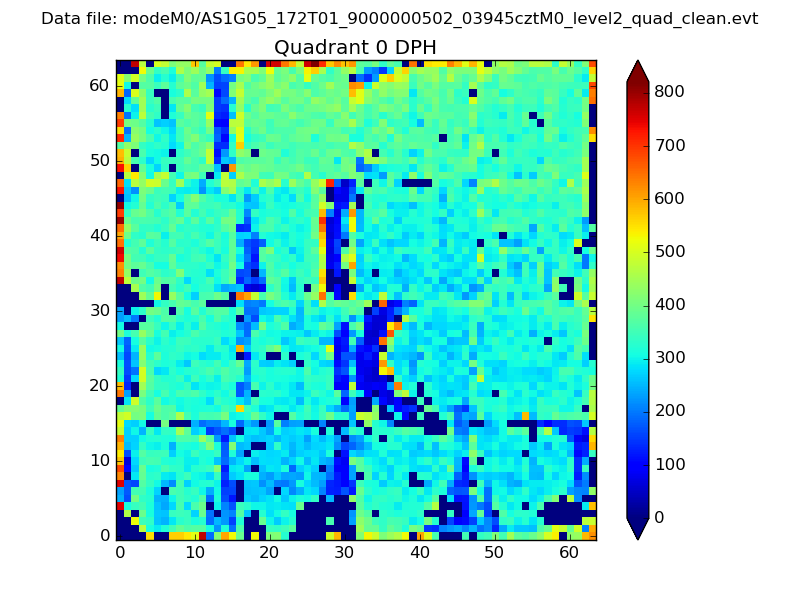 |
 |
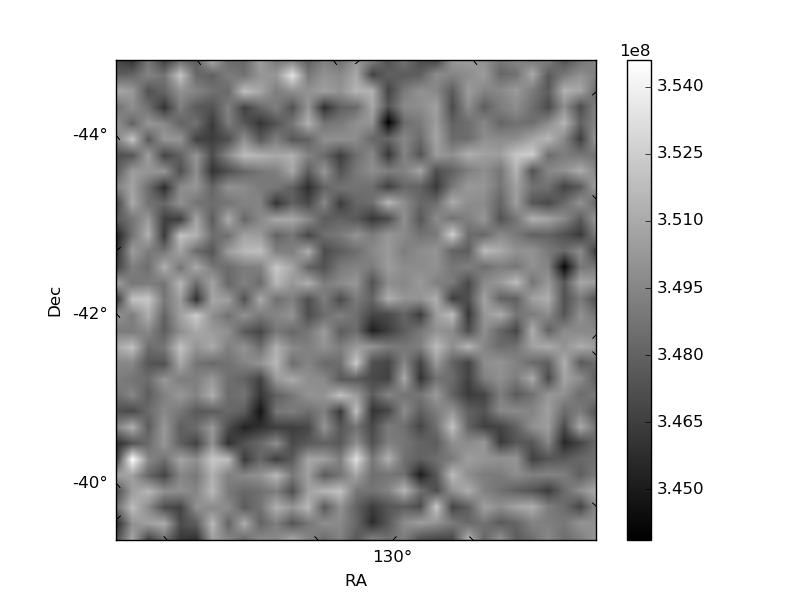
Quadrant B |
|---|---|---|---|
| Quadrant D | 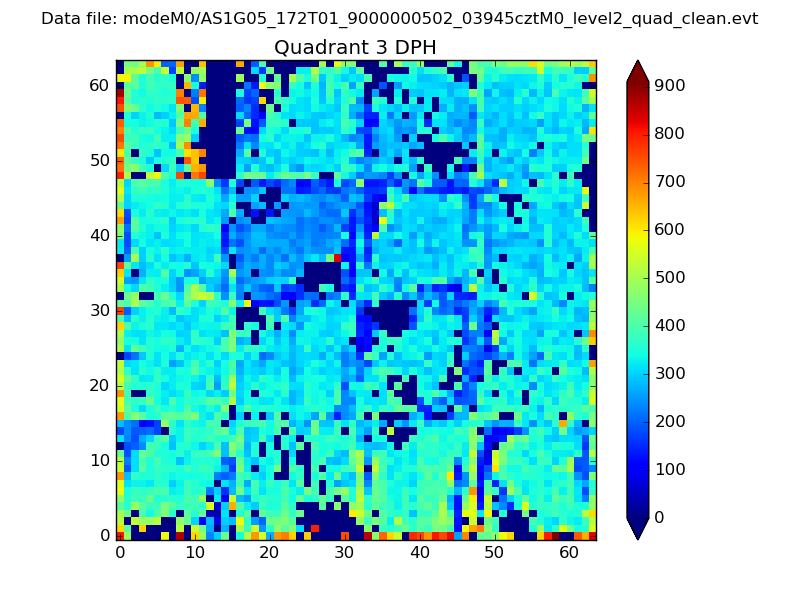 |
 |
Quadrant C |
| Plot type | Count rate plots | Images |
|---|---|---|
| Comparison with Poisson distribution Blue bars denote a histogram of data divided into 1 sec bins. Red curve is a Poisson curve with rate = median count rate of data. |
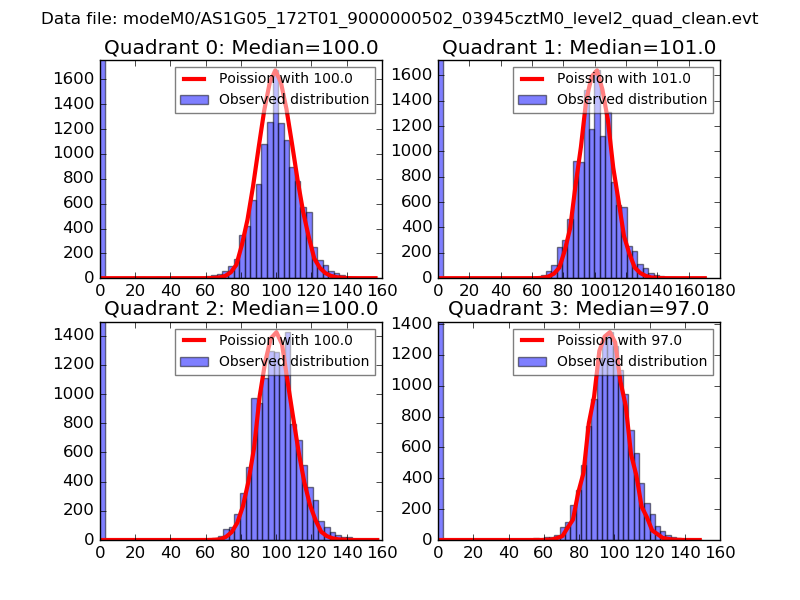 |
 |
| Quadrant-wise count rates Data is divided into 100 sec bins |
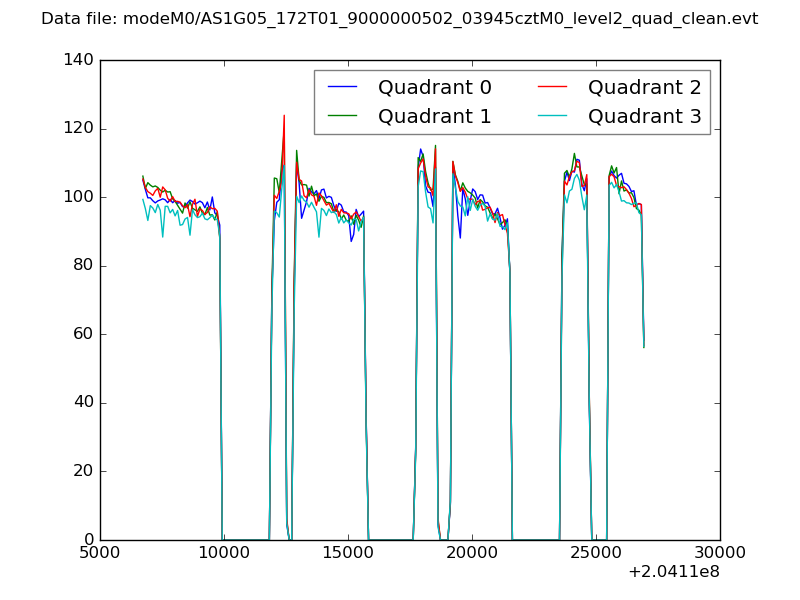 |
|
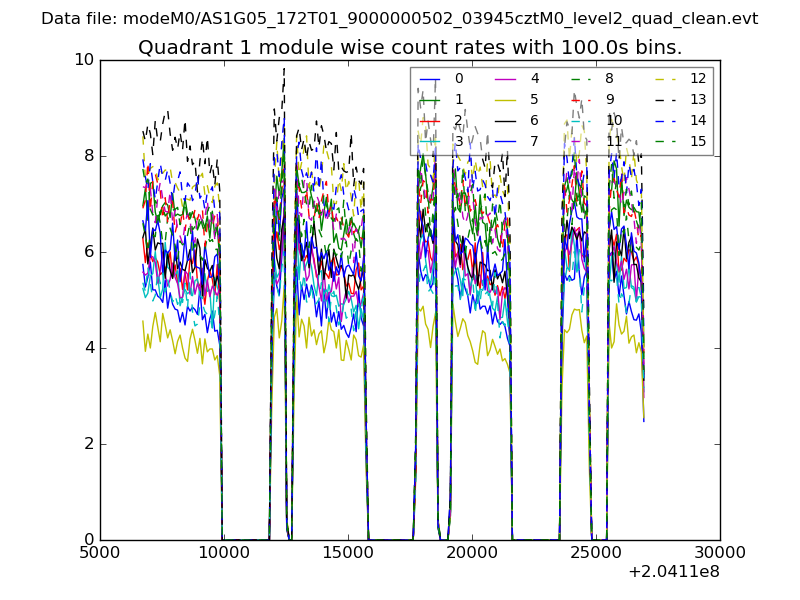
| Module-wise count rates for Quadrant A Data is divided into 100 sec bins |
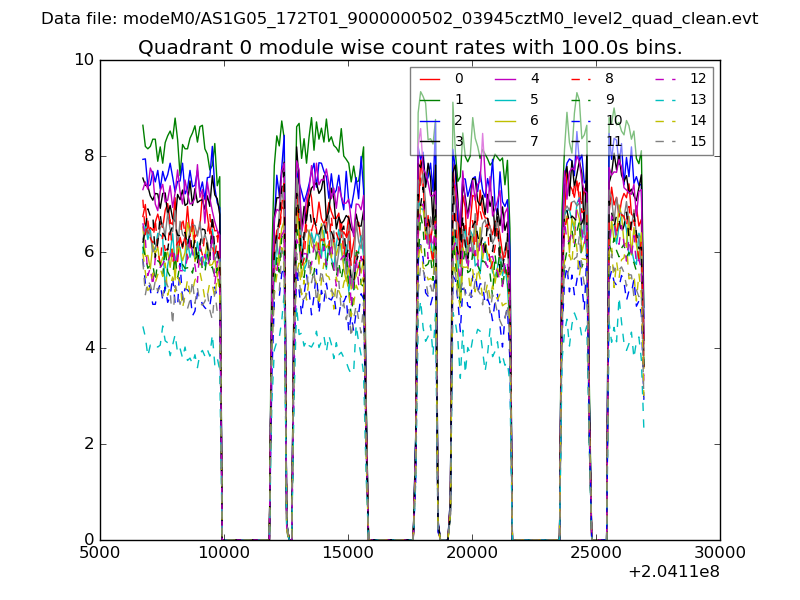 |
 |
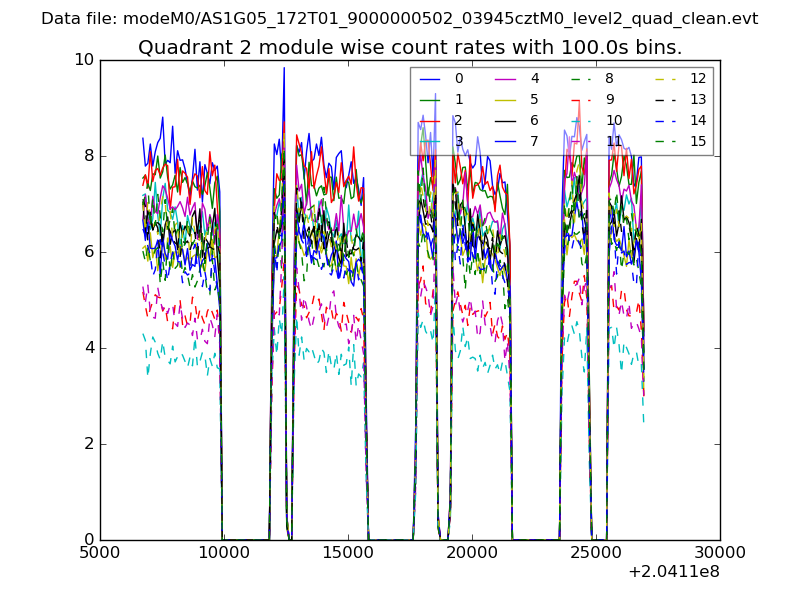
| Module-wise count rates for Quadrant B Data is divided into 100 sec bins |
 |
 |
| Module-wise count rates for Quadrant C Data is divided into 100 sec bins |
 |
 |
| Module-wise count rates for Quadrant D Data is divided into 100 sec bins |
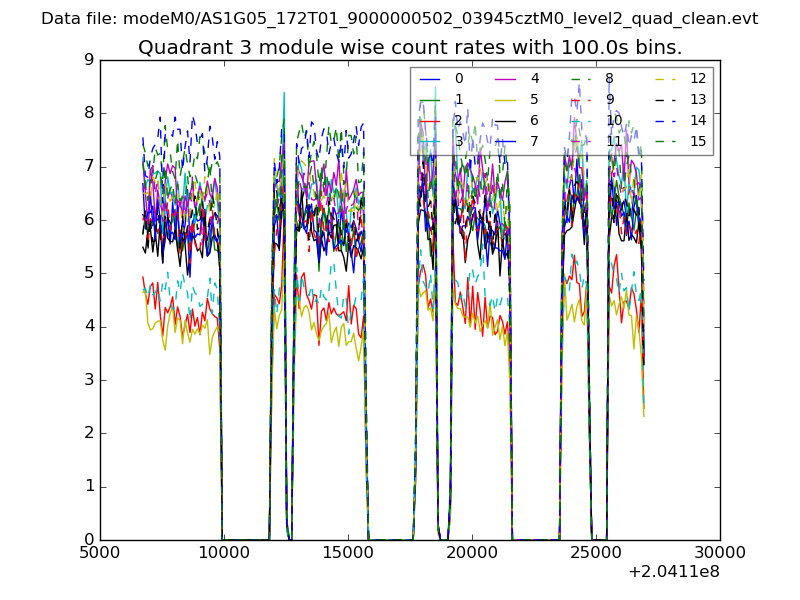 |
 |
| Parameter | Plot |
|---|---|
| CZT HV Monitor | 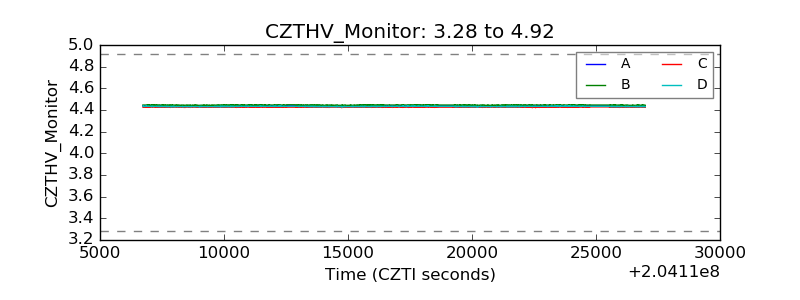 |
| D_VDD | 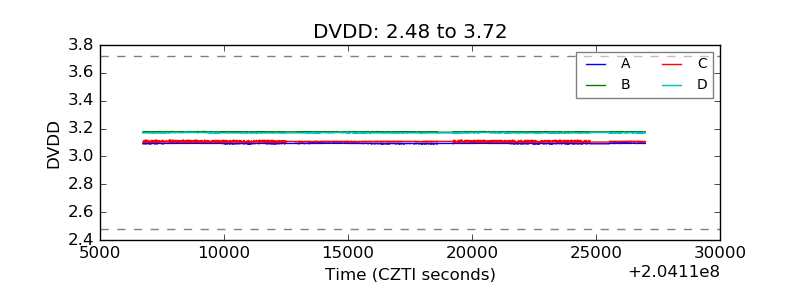 |
| Temperature 1 | 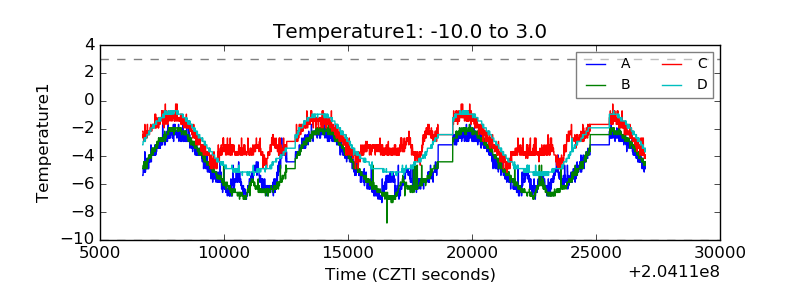 |
| Veto HV Monitor | 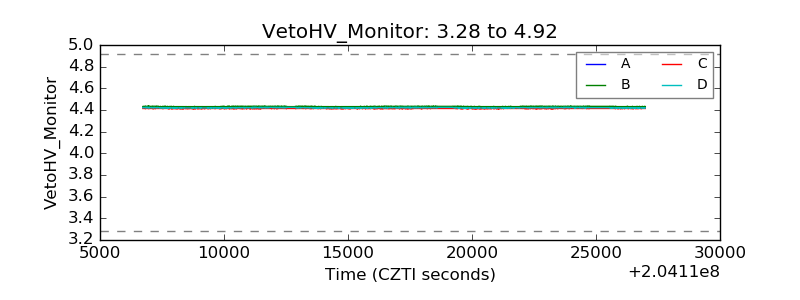 |
| Veto LLD |  |
| Alpha Counter | 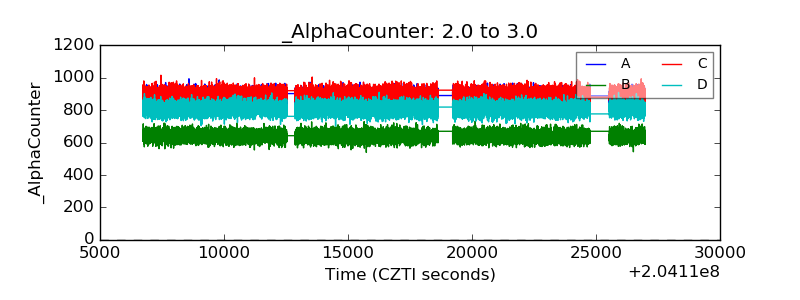 |
| _CPM_Rate | 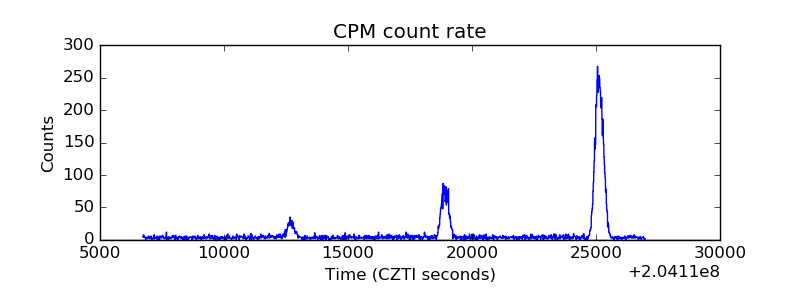 |
| CZT Counter | 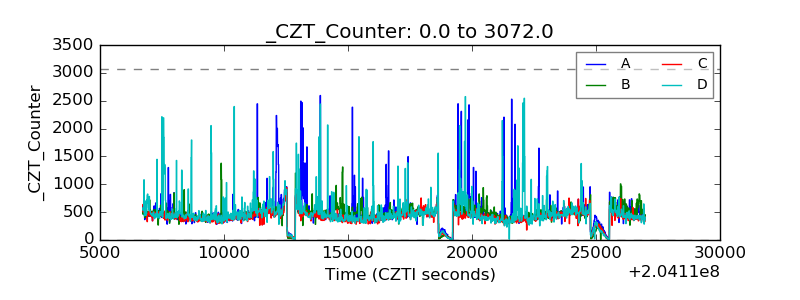 |
| +2.5 Volts monitor |  |
| +5 Volts monitor |  |
| Veto Counter | 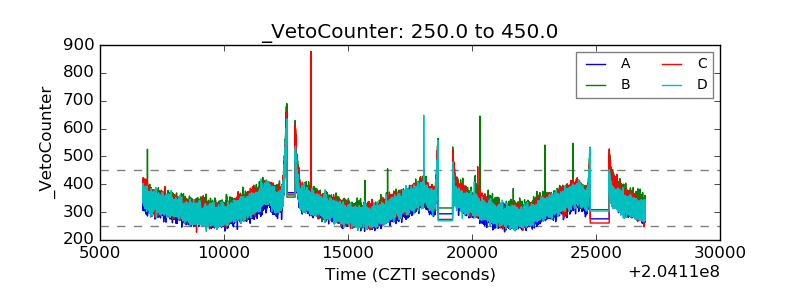 |