| Param | Original file | Final file |
|---|---|---|
| Filename | modeM0/AS1G05_172T01_9000000502_03946cztM0_level2.evt | modeM0/AS1G05_172T01_9000000502_03946cztM0_level2_quad_clean.evt |
| Size (bytes) | 2,311,490,880 | 373,317,120 |
| Size | 2.2 GB | 356.0 MB |
| Events in quadrant A | 17,661,387 | 2,249,219 |
| Events in quadrant B | 16,870,608 | 2,263,402 |
| Events in quadrant C | 15,024,978 | 2,250,071 |
| Events in quadrant D | 18,116,169 | 2,174,147 |
| Mode SS | |||
|---|---|---|---|
| Quadrant | BADHDUFLAG | Total packets | Discarded packets |
| A | 0 | 696 | 0 |
| B | 0 | 696 | 0 |
| C | 0 | 696 | 0 |
| D | 0 | 696 | 0 |
| Mode M9 | |||
|---|---|---|---|
| Quadrant | BADHDUFLAG | Total packets | Discarded packets |
| A | 0 | 20 | 0 |
| B | 0 | 20 | 0 |
| C | 0 | 20 | 0 |
| D | 0 | 20 | 0 |
| Mode M0 | |||
|---|---|---|---|
| Quadrant | BADHDUFLAG | Total packets | Discarded packets |
| A | 0 | 76424 | 7 |
| B | 0 | 72954 | 6 |
| C | 0 | 70536 | 6 |
| D | 0 | 79293 | 12 |
| Quadrant | Total seconds | Saturated seconds | Saturation percentage |
|---|---|---|---|
| A | 34497 | 878 | 2.545149% |
| B | 34497 | 437 | 1.266777% |
| C | 34497 | 258 | 0.747891% |
| D | 34495 | 807 | 2.339469% |
Noise dominated data is calculated using 1-second bins in cleaned event files. If a bin has >2000 counts, and if more than 50% of those come from <1% of pixels, then it is considered to be noise-dominated and hence unusable.
| Quadrant | # 1 sec bins | Bins with >0 counts | Bins with >2000 counts | High rate bins dominated by noise | Noise dominated (total time) | Noise dominated (detector-on time) | Marked lightcurve |
|---|---|---|---|---|---|---|---|
| A | 38030 | 34505 | 250 | 250 | 0.66% | 0.72% | 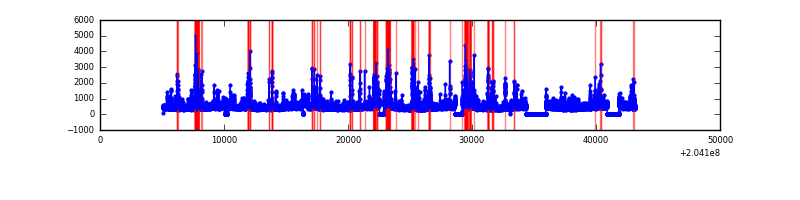 |
| B | 38030 | 34505 | 15 | 15 | 0.04% | 0.04% | 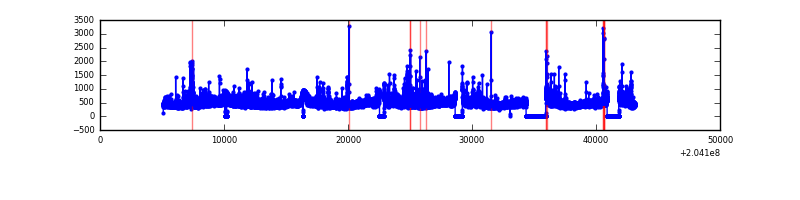 |
| C | 38030 | 34505 | 7 | 7 | 0.02% | 0.02% | 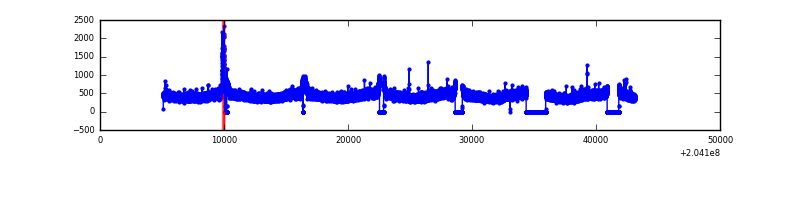 |
| D | 38030 | 34504 | 415 | 415 | 1.09% | 1.20% | 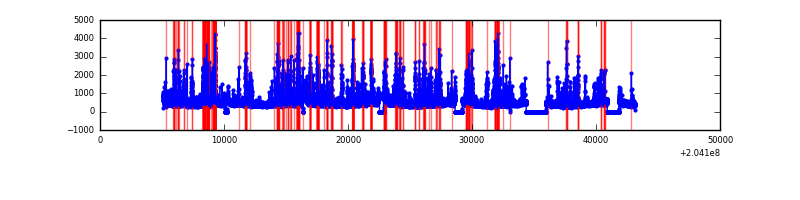 |
Top three noisy pixels from each quadrant. If the there are fewer than three noisy pixels in the level2.evt file, extra rows are filled as -1
| Pixel properties | Quadrant properties | ||||||
|---|---|---|---|---|---|---|---|
| Quadrant | DetID | PixID | Counts | Sigma | Mean | Median | Sigma |
| A | 0 | 118 | 1216979 | 1523.41 | 3914 | 3821 | 796.3 |
| A | 0 | 50 | 523526 | 652.61 | 3914 | 3821 | 796.3 |
| A | 8 | 15 | 294424 | 364.92 | 3914 | 3821 | 796.3 |
| B | 15 | 204 | 700996 | 913.91 | 3965 | 3870 | 762.8 |
| B | 14 | 167 | 214136 | 275.65 | 3965 | 3870 | 762.8 |
| B | 3 | 0 | 174811 | 224.1 | 3965 | 3870 | 762.8 |
| C | 14 | 234 | 87360 | 94.69 | 3788 | 3800 | 882.5 |
| C | 10 | 65 | 44404 | 46.01 | 3788 | 3800 | 882.5 |
| C | 8 | 128 | 42448 | 43.8 | 3788 | 3800 | 882.5 |
| D | 2 | 232 | 1528718 | 1693.53 | 3760 | 3646 | 900.5 |
| D | 12 | 227 | 389571 | 428.55 | 3760 | 3646 | 900.5 |
| D | 13 | 239 | 364292 | 400.48 | 3760 | 3646 | 900.5 |
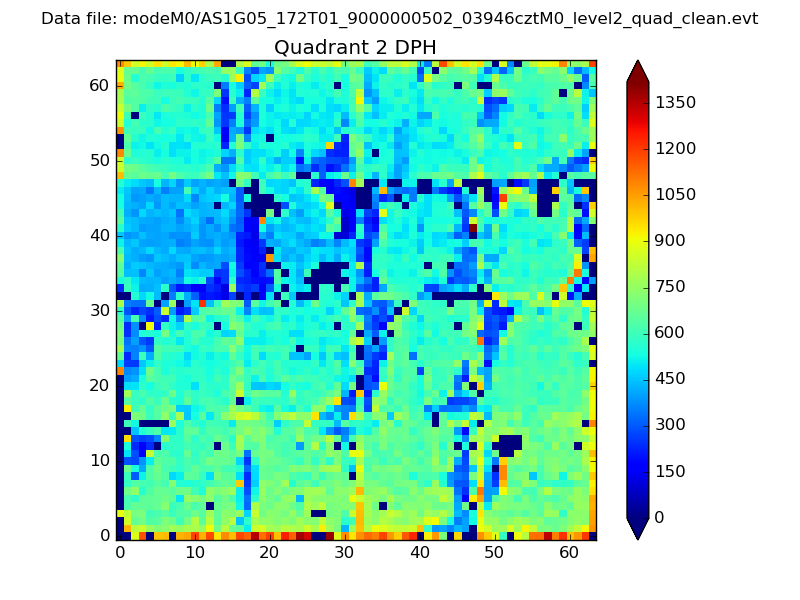
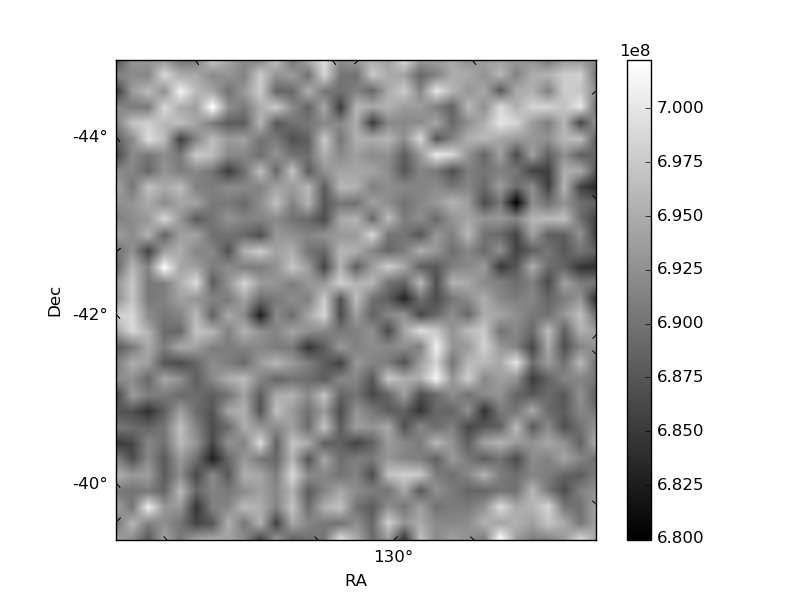
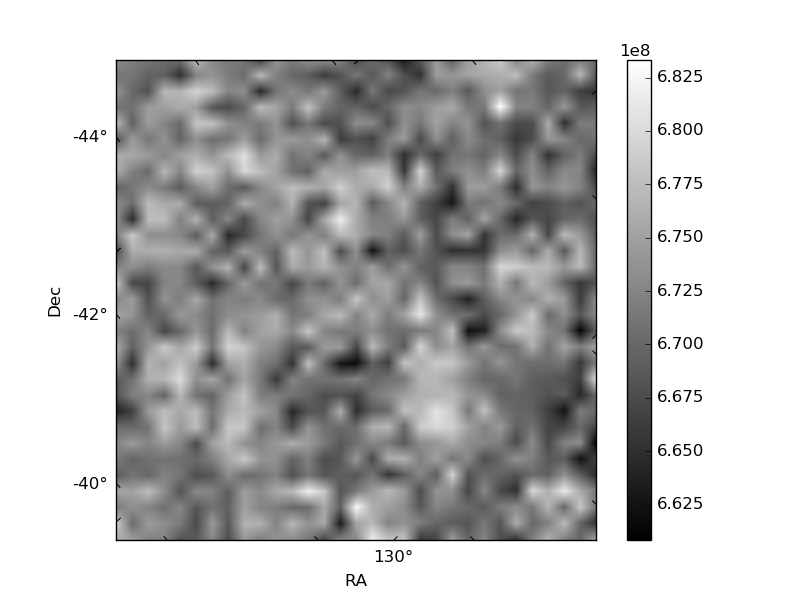
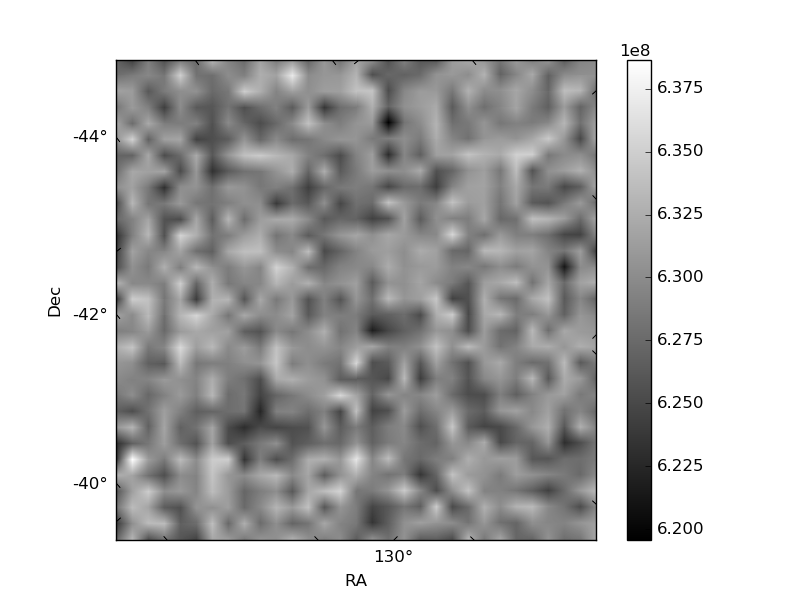
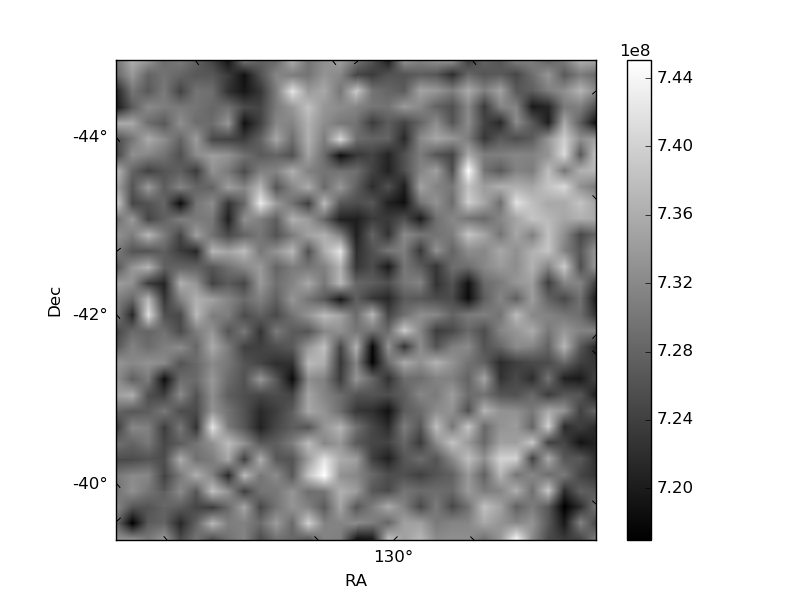
Histogram calculated using DETX and DETY for each event in the final _common_clean file
| Quadrant A | 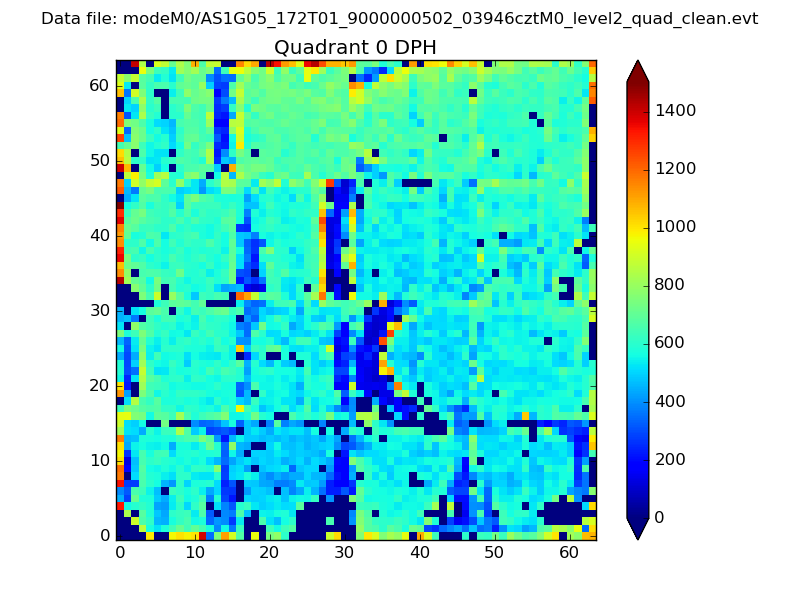 |
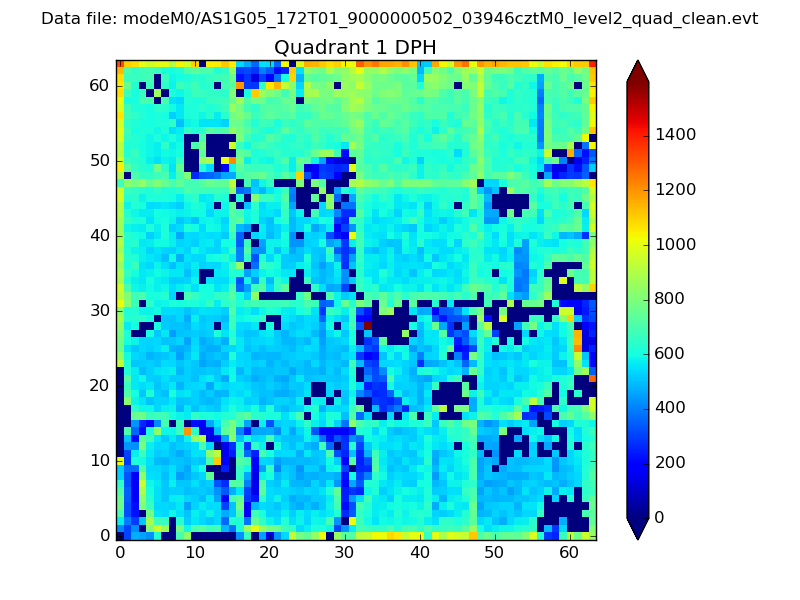 |
Quadrant B |
|---|---|---|---|
| Quadrant D | 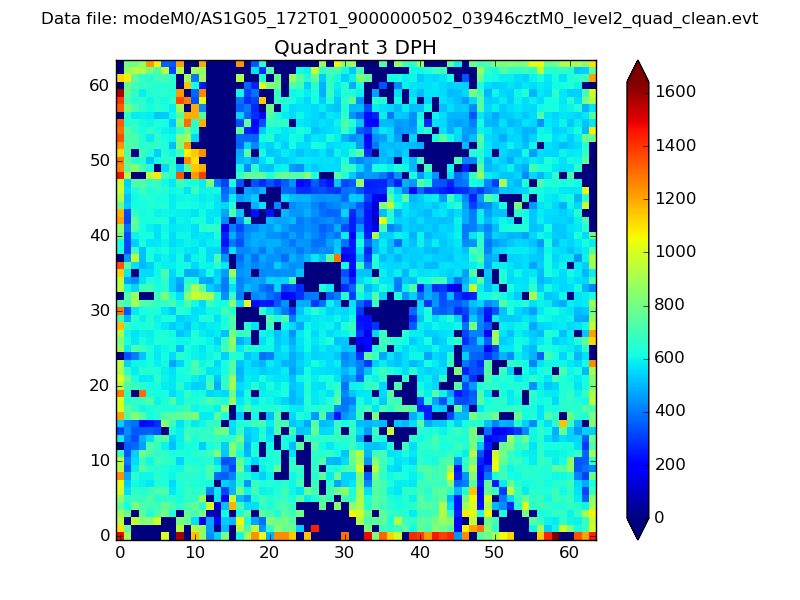 |
 |
Quadrant C |
| Plot type | Count rate plots | Images |
|---|---|---|
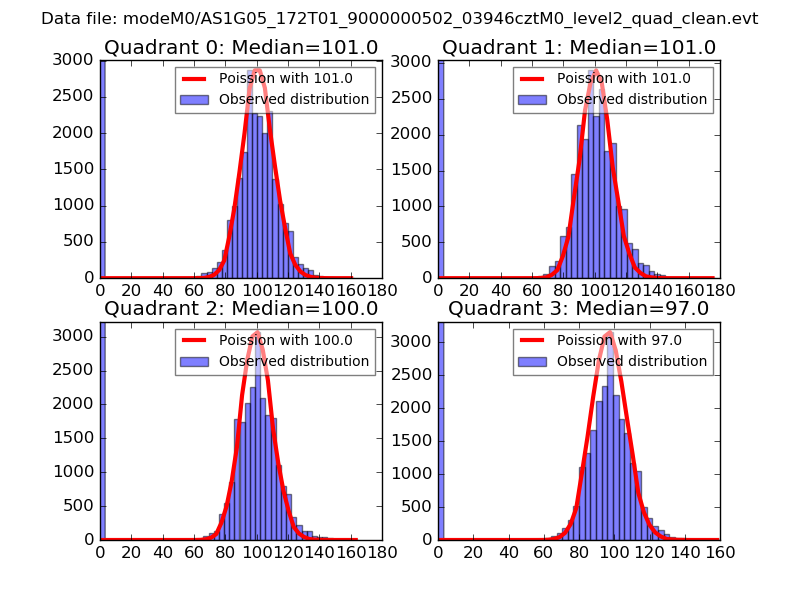
| Comparison with Poisson distribution Blue bars denote a histogram of data divided into 1 sec bins. Red curve is a Poisson curve with rate = median count rate of data. |
 |
 |
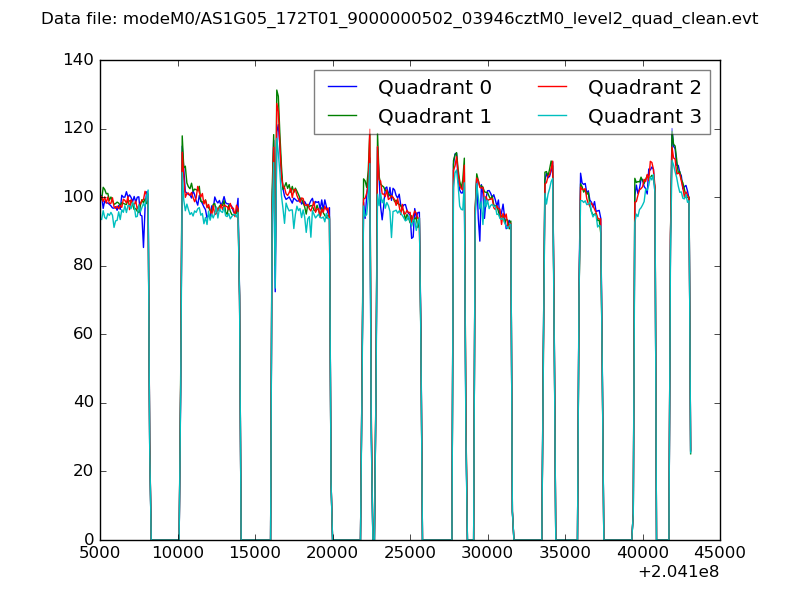
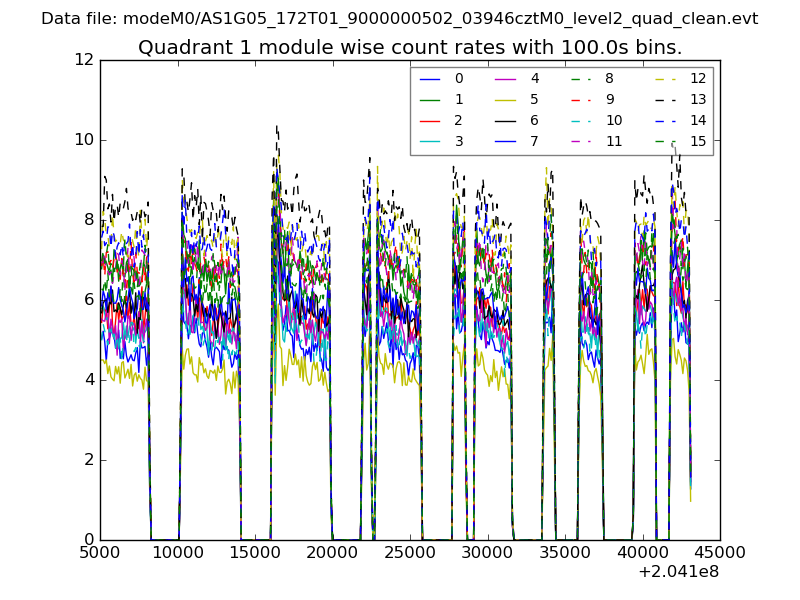
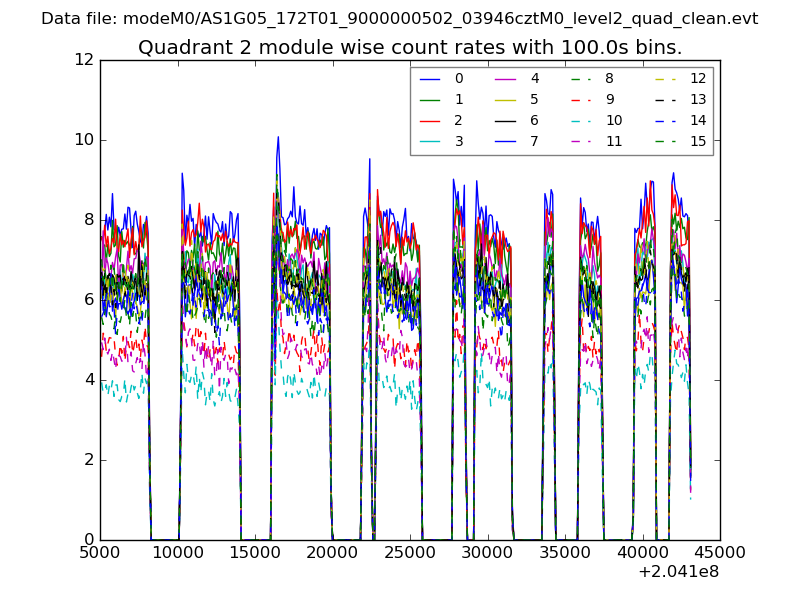
| Quadrant-wise count rates Data is divided into 100 sec bins |
 |
|
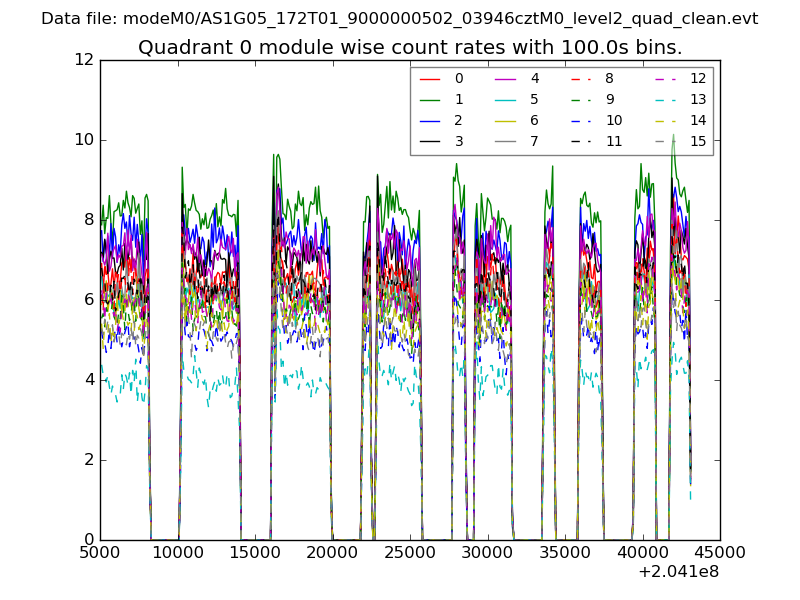
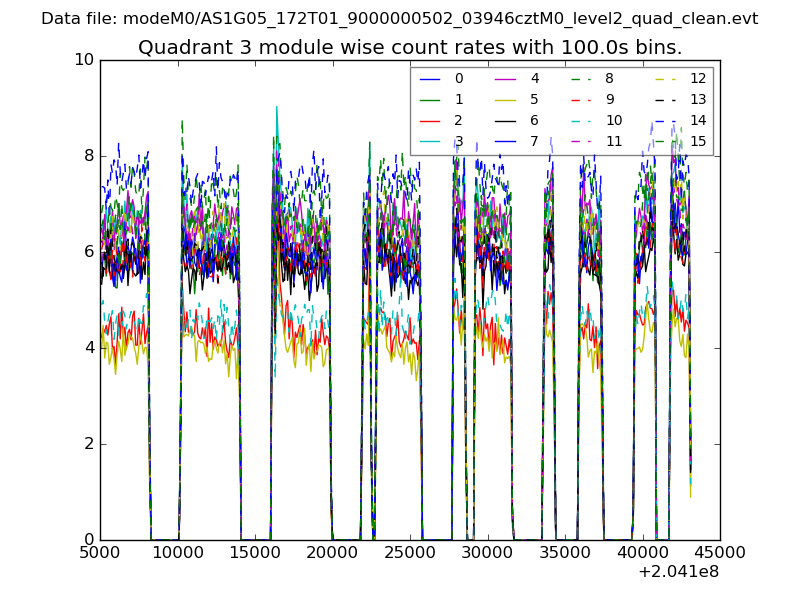
| Module-wise count rates for Quadrant A Data is divided into 100 sec bins |
 |
 |
| Module-wise count rates for Quadrant B Data is divided into 100 sec bins |
 |
 |
| Module-wise count rates for Quadrant C Data is divided into 100 sec bins |
 |
 |
| Module-wise count rates for Quadrant D Data is divided into 100 sec bins |
 |
 |
| Parameter | Plot |
|---|---|
| CZT HV Monitor | 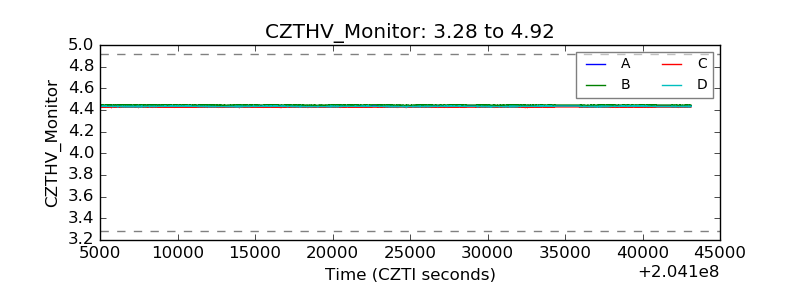 |
| D_VDD | 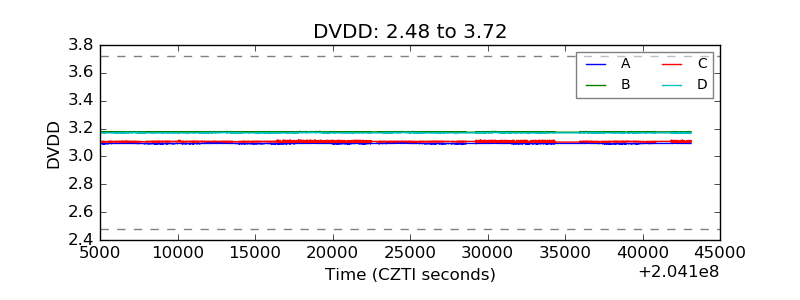 |
| Temperature 1 | 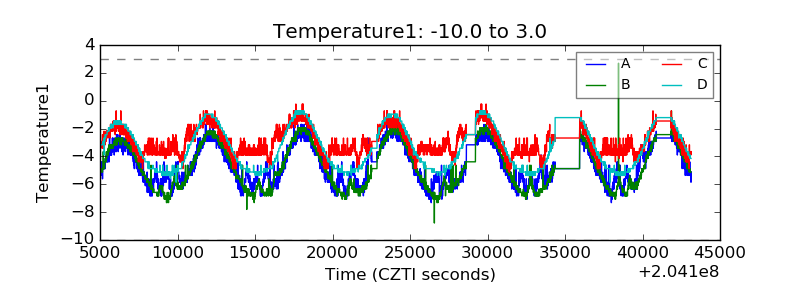 |
| Veto HV Monitor | 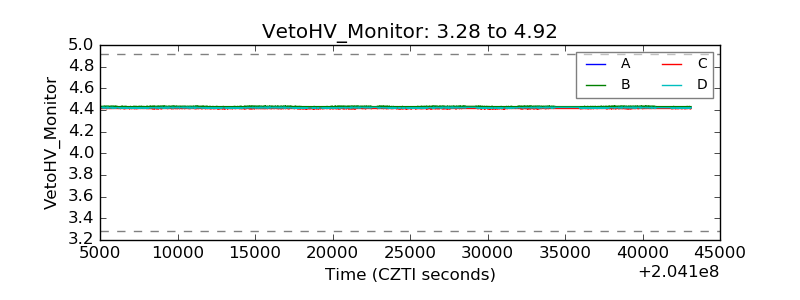 |
| Veto LLD | 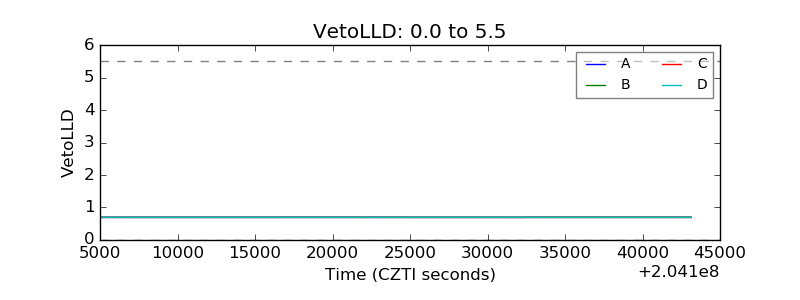 |
| Alpha Counter | 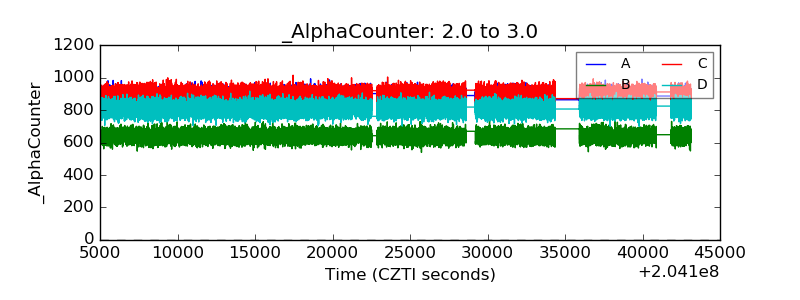 |
| _CPM_Rate | 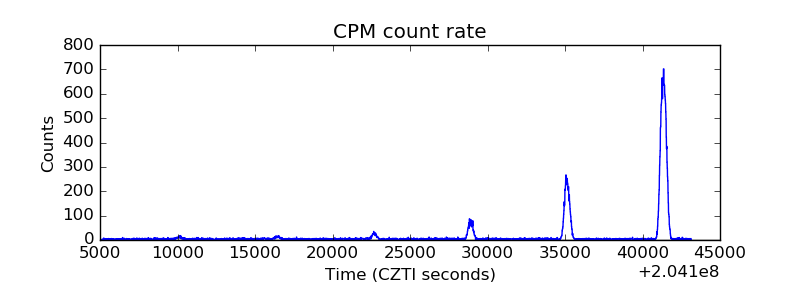 |
| CZT Counter | 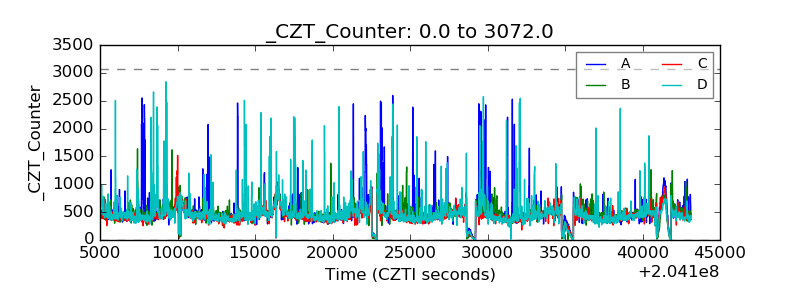 |
| +2.5 Volts monitor |  |
| +5 Volts monitor |  |
| Veto Counter | 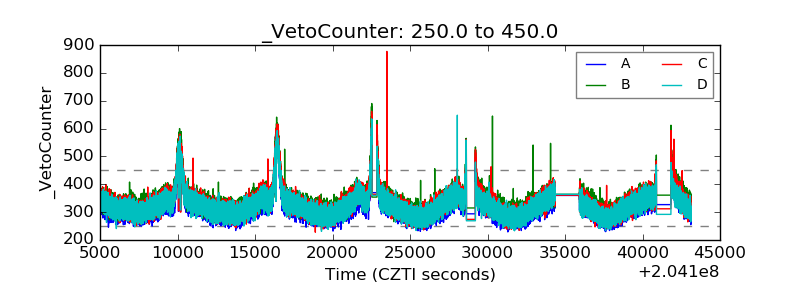 |