| Param | Original file | Final file |
|---|---|---|
| Filename | modeM0/AS1G05_172T01_9000000502_03948cztM0_level2.evt | modeM0/AS1G05_172T01_9000000502_03948cztM0_level2_quad_clean.evt |
| Size (bytes) | 425,064,960 | 64,710,720 |
| Size | 405.4 MB | 61.7 MB |
| Events in quadrant A | 3,319,324 | 398,191 |
| Events in quadrant B | 2,800,756 | 399,823 |
| Events in quadrant C | 2,764,397 | 394,458 |
| Events in quadrant D | 3,599,568 | 366,729 |
| Mode SS | |||
|---|---|---|---|
| Quadrant | BADHDUFLAG | Total packets | Discarded packets |
| A | 0 | 116 | 0 |
| B | 0 | 116 | 0 |
| C | 0 | 116 | 0 |
| D | 0 | 116 | 0 |
| Mode M9 | |||
|---|---|---|---|
| Quadrant | BADHDUFLAG | Total packets | Discarded packets |
| A | 0 | 11 | 0 |
| B | 0 | 11 | 0 |
| C | 0 | 11 | 0 |
| D | 0 | 11 | 0 |
| Mode M0 | |||
|---|---|---|---|
| Quadrant | BADHDUFLAG | Total packets | Discarded packets |
| A | 0 | 13612 | 1 |
| B | 0 | 12165 | 1 |
| C | 0 | 12219 | 1 |
| D | 0 | 14957 | 1 |
| Quadrant | Total seconds | Saturated seconds | Saturation percentage |
|---|---|---|---|
| A | 5721 | 162 | 2.831673% |
| B | 5721 | 28 | 0.489425% |
| C | 5721 | 46 | 0.804055% |
| D | 5721 | 350 | 6.117812% |
Noise dominated data is calculated using 1-second bins in cleaned event files. If a bin has >2000 counts, and if more than 50% of those come from <1% of pixels, then it is considered to be noise-dominated and hence unusable.
| Quadrant | # 1 sec bins | Bins with >0 counts | Bins with >2000 counts | High rate bins dominated by noise | Noise dominated (total time) | Noise dominated (detector-on time) | Marked lightcurve |
|---|---|---|---|---|---|---|---|
| A | 6806 | 5722 | 95 | 95 | 1.40% | 1.66% |  |
| B | 6806 | 5722 | 2 | 2 | 0.03% | 0.03% | 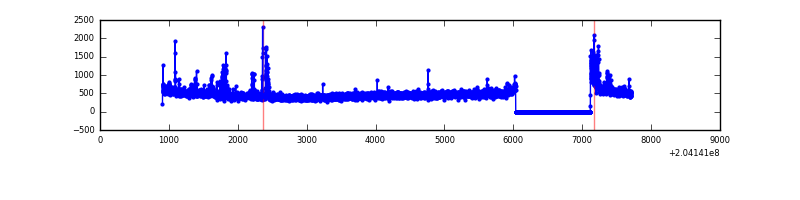 |
| C | 6806 | 5722 | 33 | 33 | 0.48% | 0.58% | 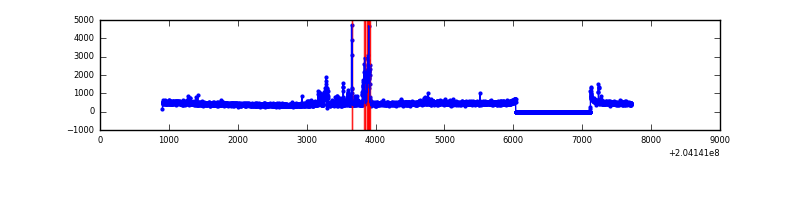 |
| D | 6806 | 5722 | 351 | 351 | 5.16% | 6.13% | 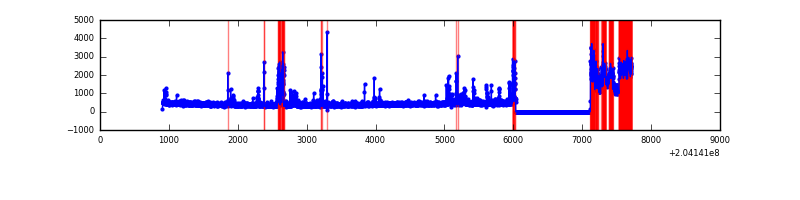 |
Top three noisy pixels from each quadrant. If the there are fewer than three noisy pixels in the level2.evt file, extra rows are filled as -1
| Pixel properties | Quadrant properties | ||||||
|---|---|---|---|---|---|---|---|
| Quadrant | DetID | PixID | Counts | Sigma | Mean | Median | Sigma |
| A | 0 | 118 | 464957 | 3448.39 | 647 | 633 | 134.6 |
| A | 8 | 15 | 210271 | 1556.92 | 647 | 633 | 134.6 |
| A | 0 | 199 | 51218 | 375.68 | 647 | 633 | 134.6 |
| B | 10 | 16 | 74322 | 580.15 | 662 | 647 | 127.0 |
| B | 3 | 0 | 48122 | 373.84 | 662 | 647 | 127.0 |
| B | 15 | 204 | 40033 | 310.14 | 662 | 647 | 127.0 |
| C | 8 | 208 | 130053 | 886.56 | 624 | 627 | 146.0 |
| C | 10 | 65 | 126207 | 860.22 | 624 | 627 | 146.0 |
| C | 1 | 16 | 30200 | 202.57 | 624 | 627 | 146.0 |
| D | 9 | 82 | 925177 | 6182.89 | 610 | 591 | 149.5 |
| D | 2 | 232 | 226721 | 1512.18 | 610 | 591 | 149.5 |
| D | 13 | 223 | 38578 | 254.03 | 610 | 591 | 149.5 |
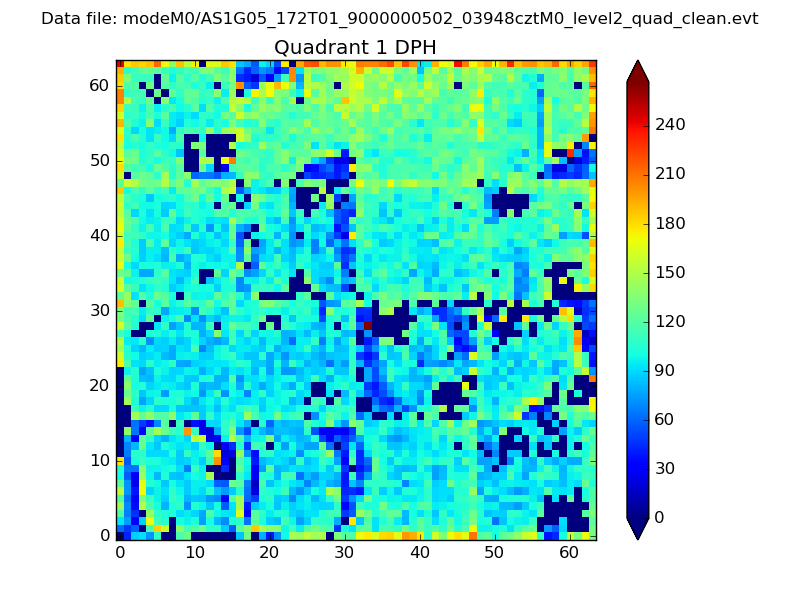
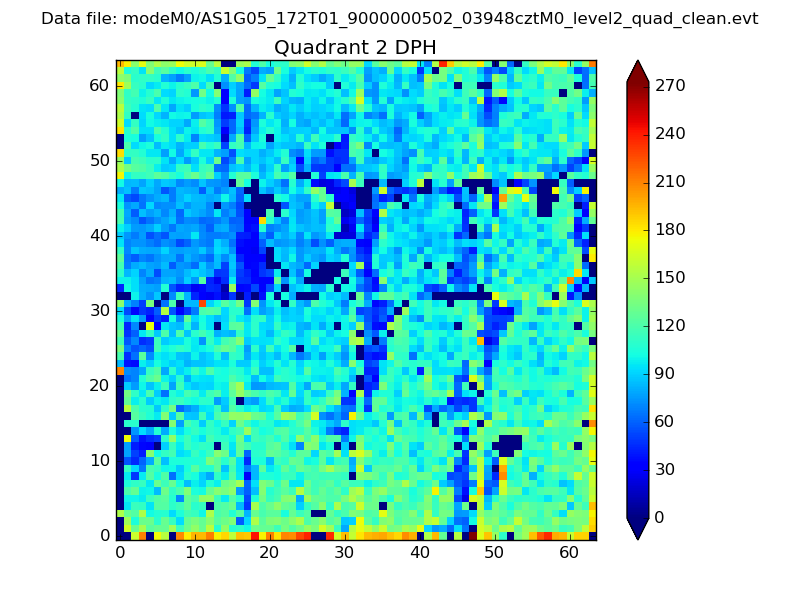
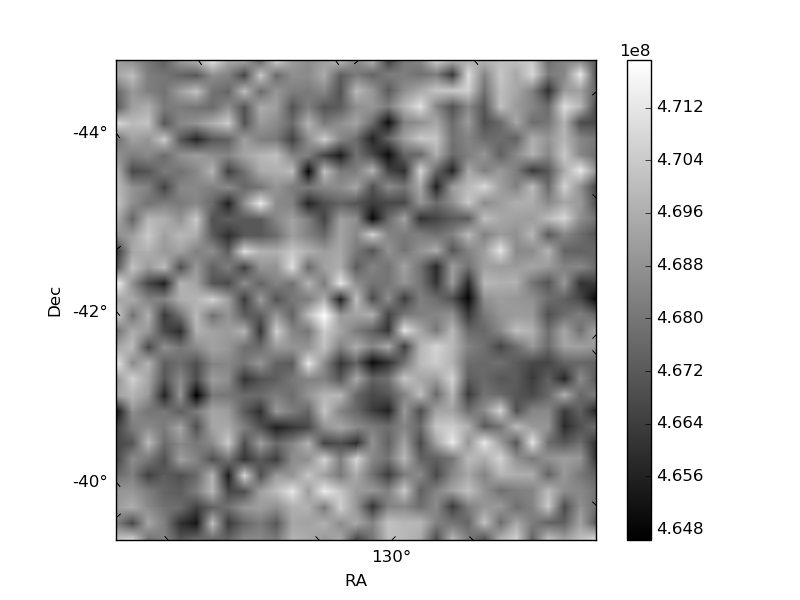
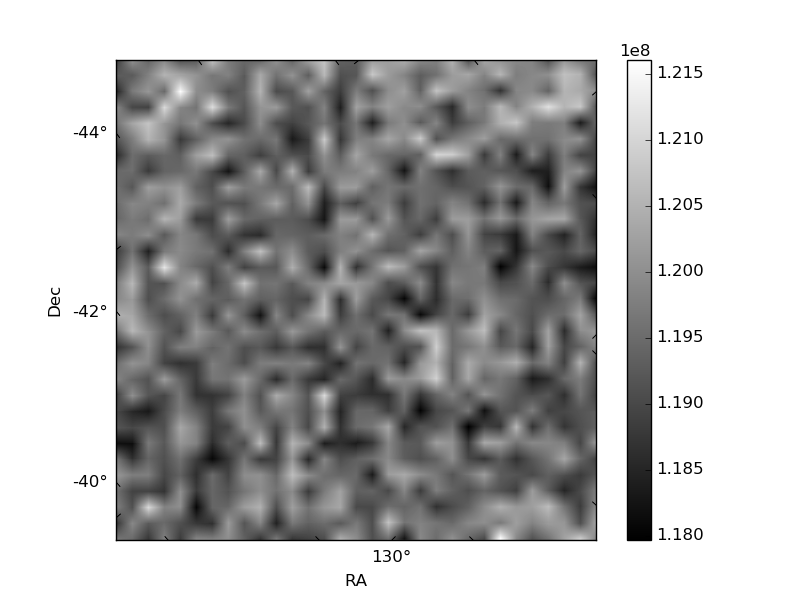
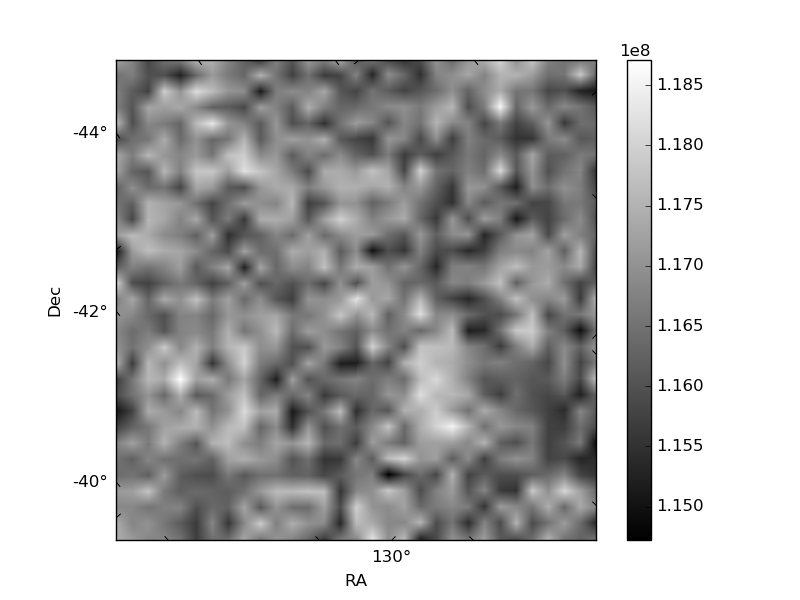
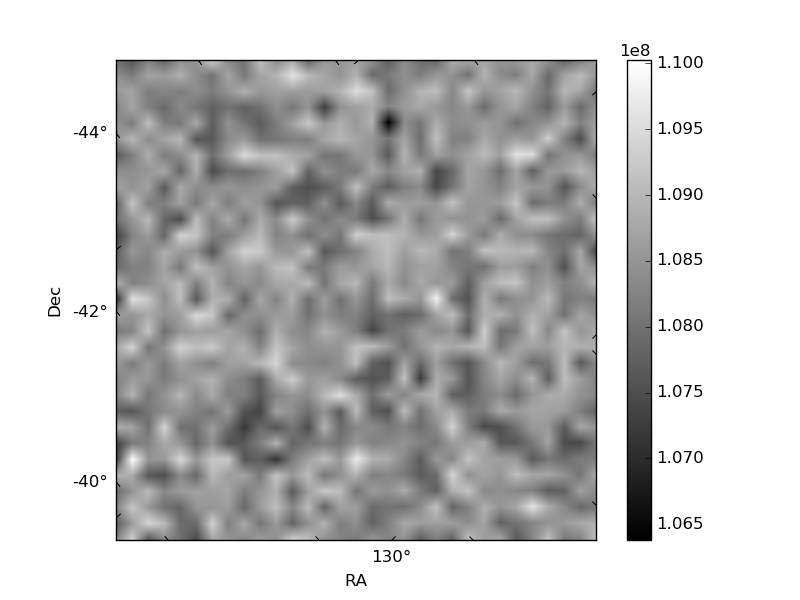
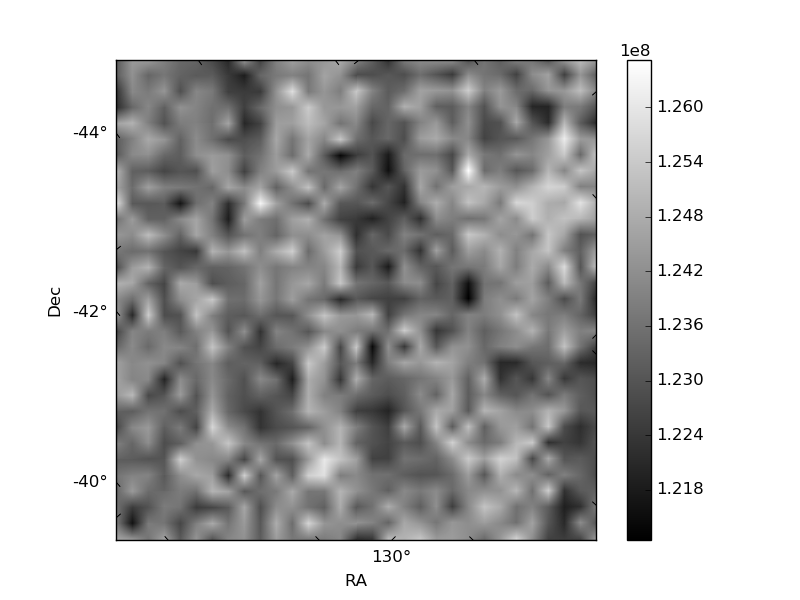
Histogram calculated using DETX and DETY for each event in the final _common_clean file
| Quadrant A | 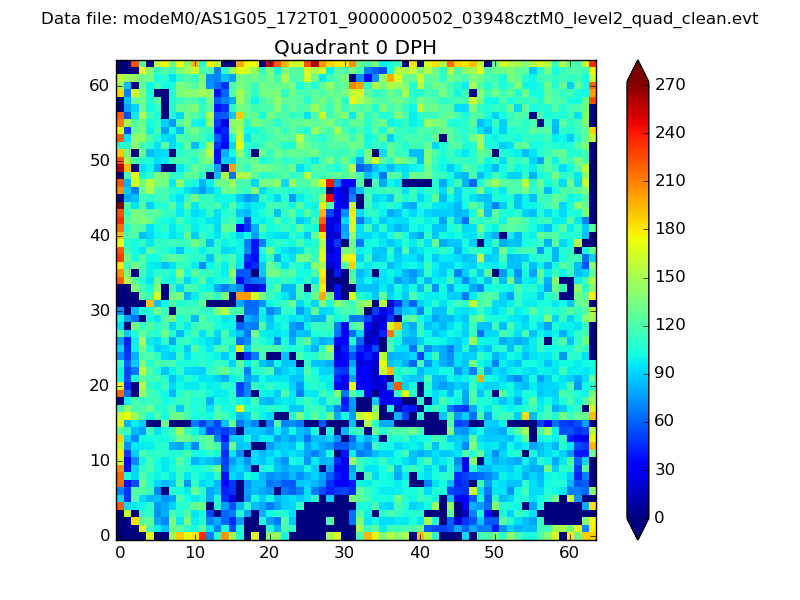 |
 |
Quadrant B |
|---|---|---|---|
| Quadrant D | 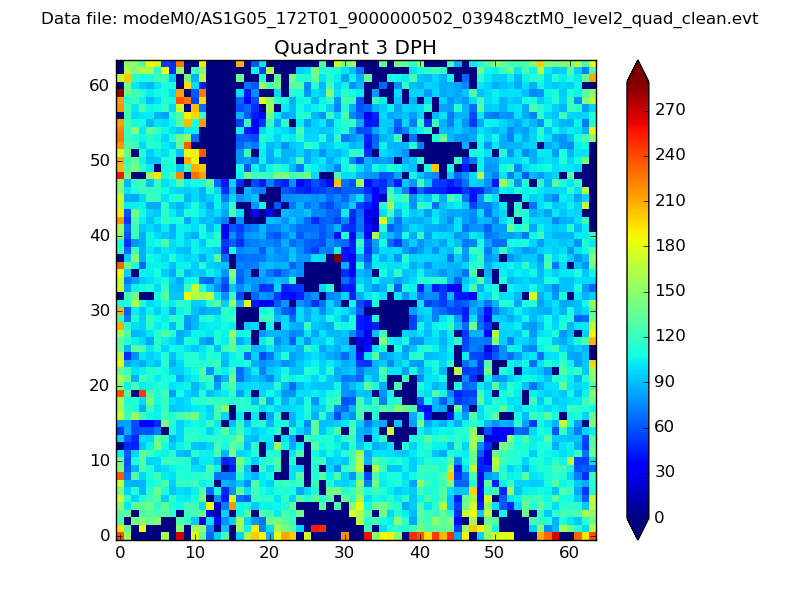 |
 |
Quadrant C |
| Plot type | Count rate plots | Images |
|---|---|---|
| Comparison with Poisson distribution Blue bars denote a histogram of data divided into 1 sec bins. Red curve is a Poisson curve with rate = median count rate of data. |
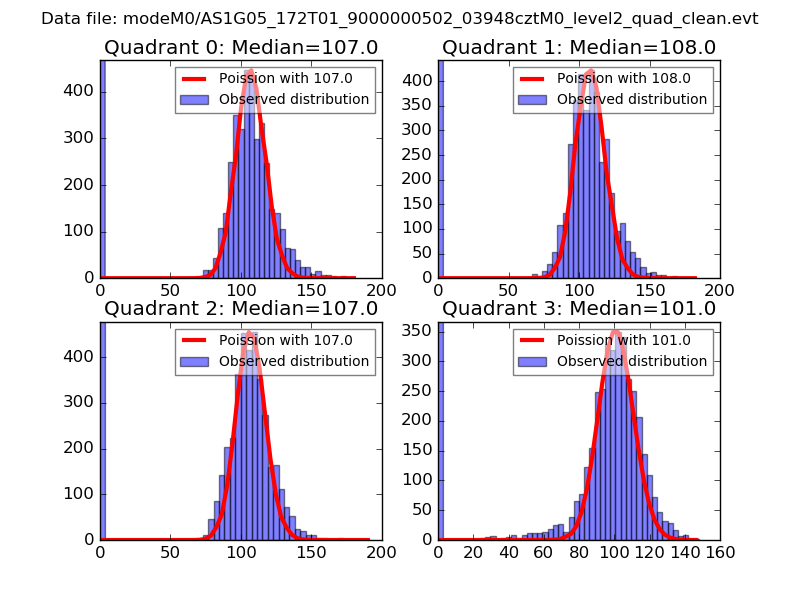 |
 |
| Quadrant-wise count rates Data is divided into 100 sec bins |
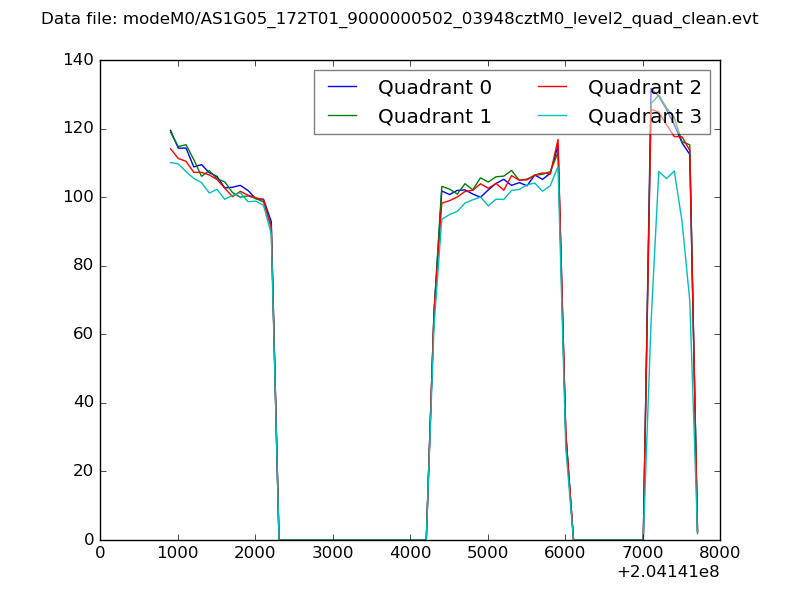 |
|
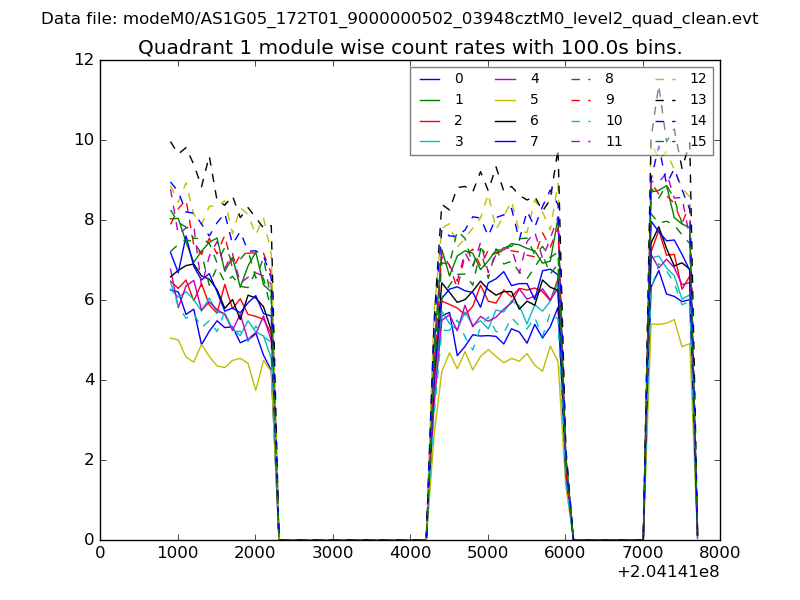
| Module-wise count rates for Quadrant A Data is divided into 100 sec bins |
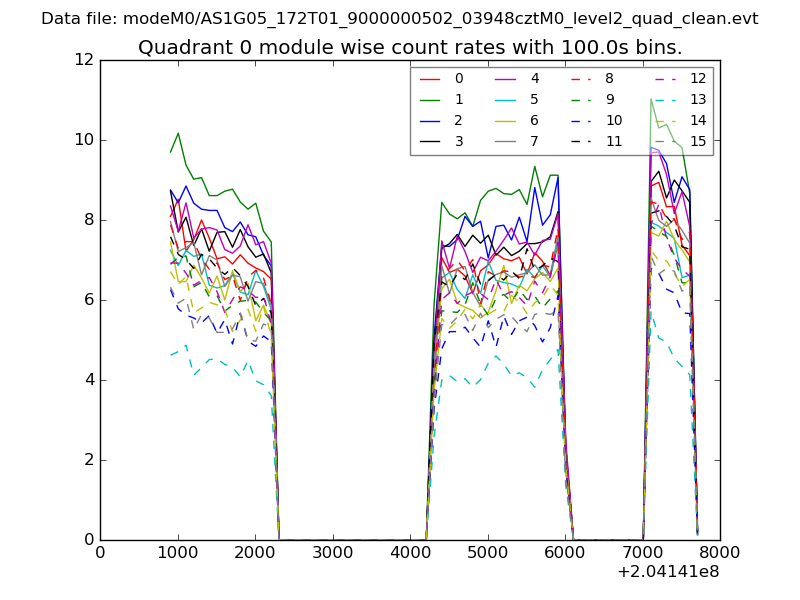 |
 |
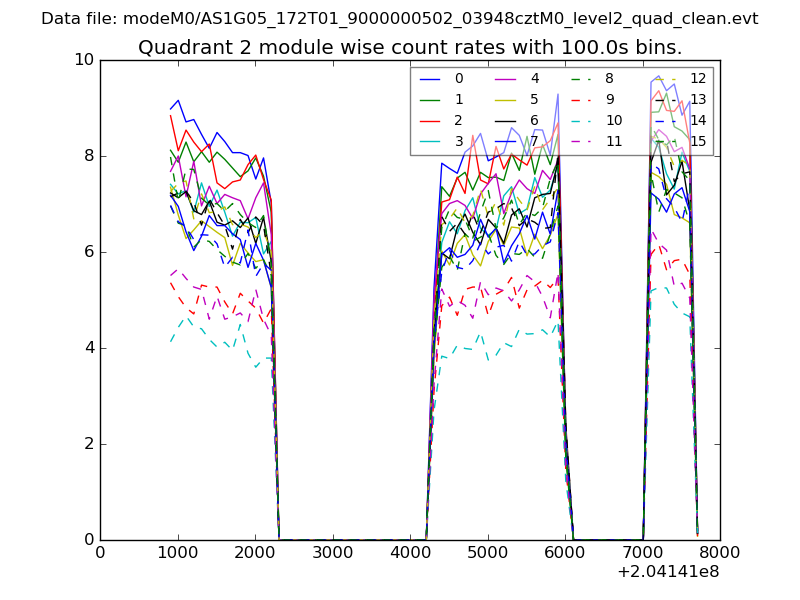
| Module-wise count rates for Quadrant B Data is divided into 100 sec bins |
 |
 |
| Module-wise count rates for Quadrant C Data is divided into 100 sec bins |
 |
 |
| Module-wise count rates for Quadrant D Data is divided into 100 sec bins |
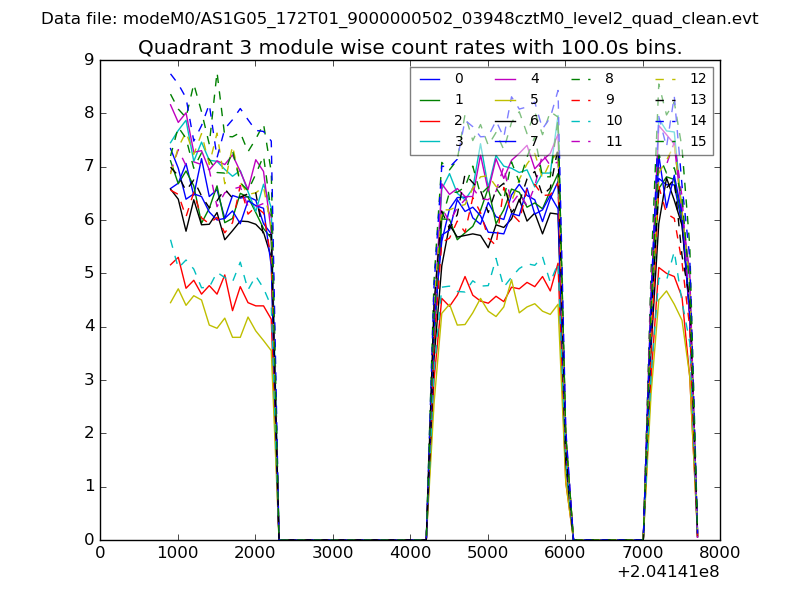 |
 |
| Parameter | Plot |
|---|---|
| CZT HV Monitor | 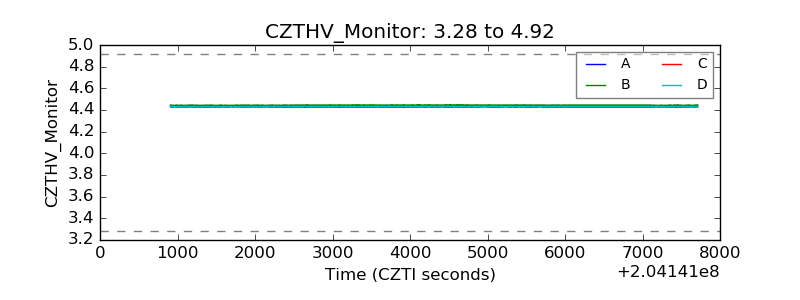 |
| D_VDD | 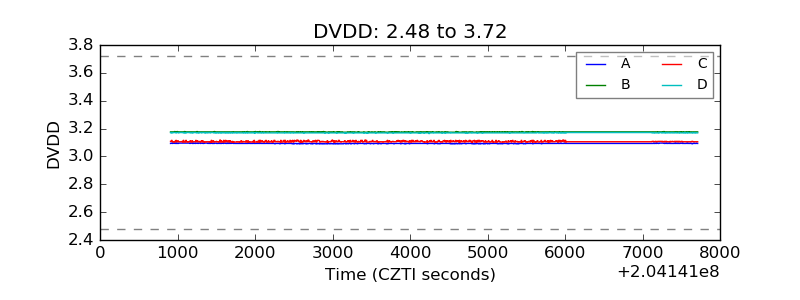 |
| Temperature 1 | 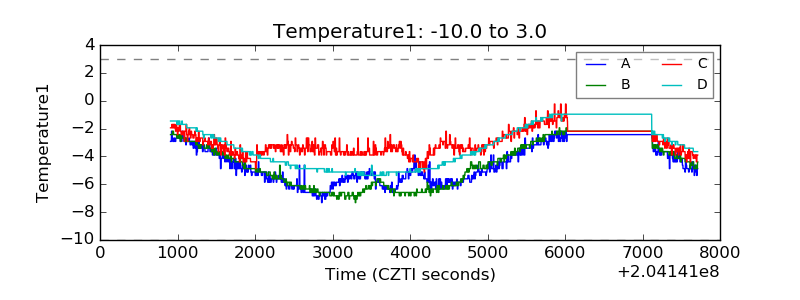 |
| Veto HV Monitor | 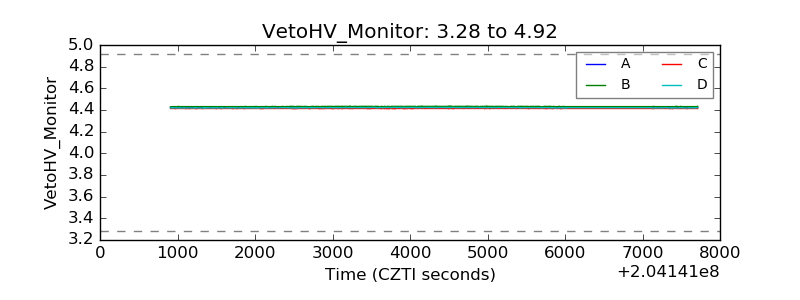 |
| Veto LLD | 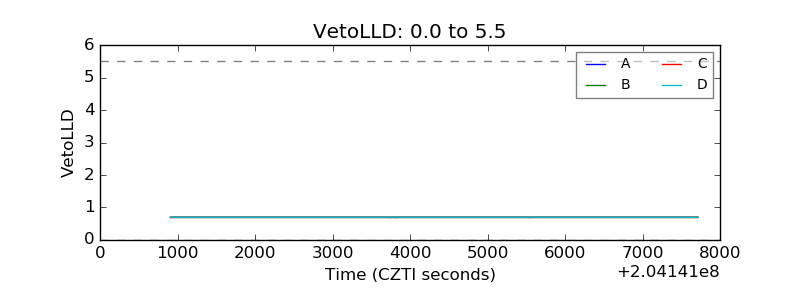 |
| Alpha Counter | 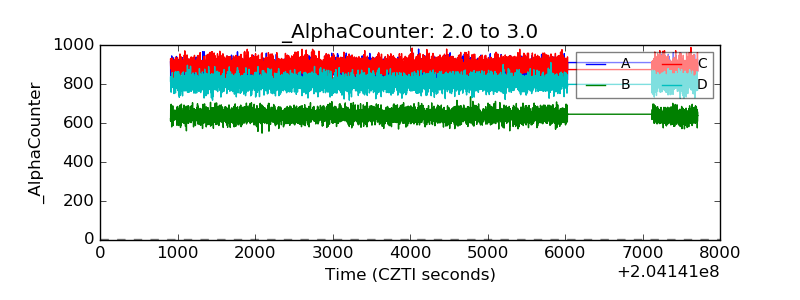 |
| _CPM_Rate | 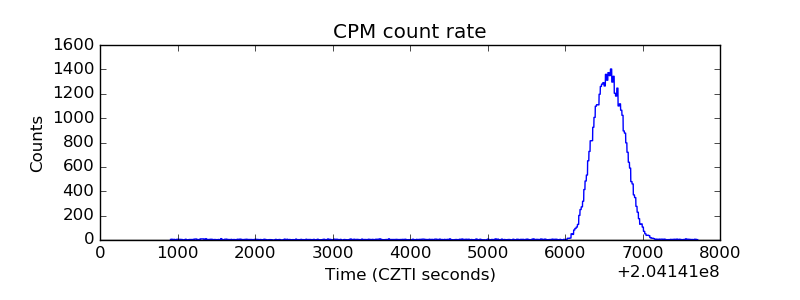 |
| CZT Counter | 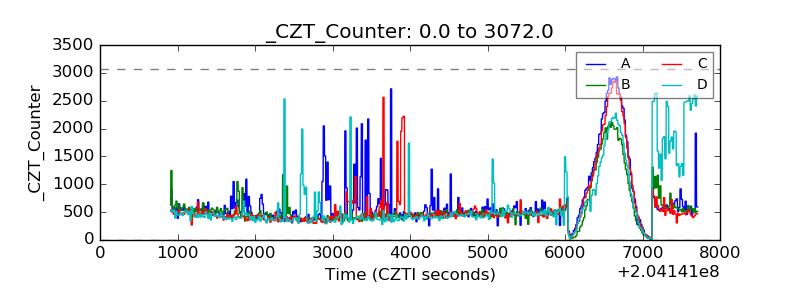 |
| +2.5 Volts monitor |  |
| +5 Volts monitor |  |
| Veto Counter | 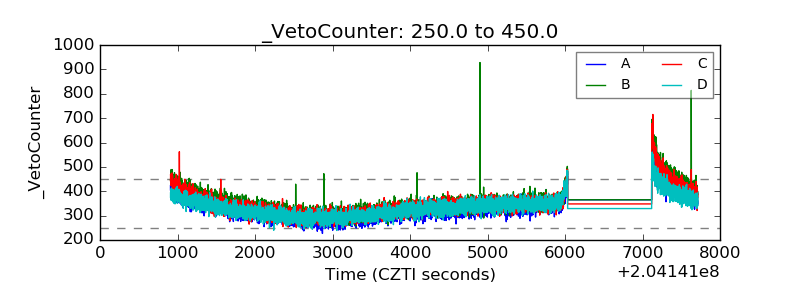 |