| Param | Original file | Final file |
|---|---|---|
| Filename | modeM0/AS1G05_172T01_9000000502_03949cztM0_level2.evt | modeM0/AS1G05_172T01_9000000502_03949cztM0_level2_quad_clean.evt |
| Size (bytes) | 75,412,800 | 10,751,040 |
| Size | 71.9 MB | 10.3 MB |
| Events in quadrant A | 367,483 | 73,914 |
| Events in quadrant B | 392,114 | 74,194 |
| Events in quadrant C | 303,677 | 72,447 |
| Events in quadrant D | 1,177,090 | 54,905 |
| Mode SS | |||
|---|---|---|---|
| Quadrant | BADHDUFLAG | Total packets | Discarded packets |
| A | 0 | 12 | 0 |
| B | 0 | 12 | 0 |
| C | 0 | 12 | 0 |
| D | 0 | 12 | 0 |
| Mode M9 | |||
|---|---|---|---|
| Quadrant | BADHDUFLAG | Total packets | Discarded packets |
| A | 0 | 5 | 0 |
| B | 0 | 5 | 0 |
| C | 0 | 5 | 0 |
| D | 0 | 6 | 0 |
| Mode M0 | |||
|---|---|---|---|
| Quadrant | BADHDUFLAG | Total packets | Discarded packets |
| A | 0 | 1464 | 1 |
| B | 0 | 1544 | 1 |
| C | 0 | 1278 | 1 |
| D | 0 | 3892 | 1 |
| Quadrant | Total seconds | Saturated seconds | Saturation percentage |
|---|---|---|---|
| A | 595 | 12 | 2.016807% |
| B | 595 | 17 | 2.857143% |
| C | 595 | 3 | 0.504202% |
| D | 595 | 296 | 49.747899% |
Noise dominated data is calculated using 1-second bins in cleaned event files. If a bin has >2000 counts, and if more than 50% of those come from <1% of pixels, then it is considered to be noise-dominated and hence unusable.
| Quadrant | # 1 sec bins | Bins with >0 counts | Bins with >2000 counts | High rate bins dominated by noise | Noise dominated (total time) | Noise dominated (detector-on time) | Marked lightcurve |
|---|---|---|---|---|---|---|---|
| A | 595 | 595 | 4 | 4 | 0.67% | 0.67% |  |
| B | 595 | 595 | 1 | 1 | 0.17% | 0.17% | 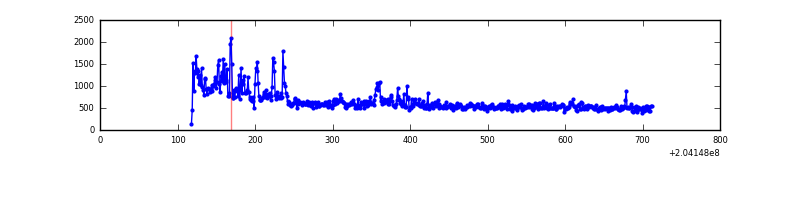 |
| C | 595 | 595 | 0 | 0 | 0.00% | 0.00% | 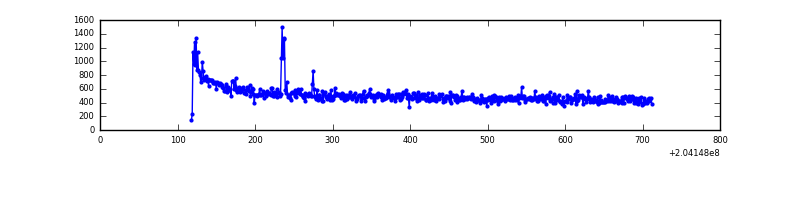 |
| D | 595 | 595 | 306 | 306 | 51.43% | 51.43% | 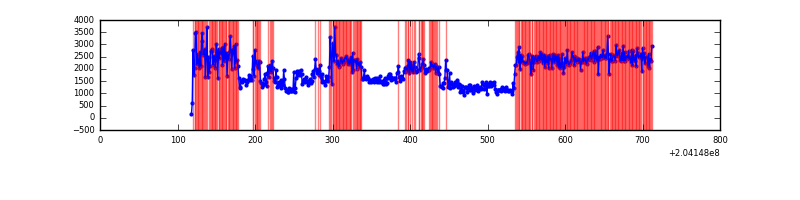 |
Top three noisy pixels from each quadrant. If the there are fewer than three noisy pixels in the level2.evt file, extra rows are filled as -1
| Pixel properties | Quadrant properties | ||||||
|---|---|---|---|---|---|---|---|
| Quadrant | DetID | PixID | Counts | Sigma | Mean | Median | Sigma |
| A | 0 | 199 | 17466 | 924.26 | 80 | 78 | 18.8 |
| A | 0 | 118 | 11296 | 596.29 | 80 | 78 | 18.8 |
| A | 0 | 50 | 10255 | 540.96 | 80 | 78 | 18.8 |
| B | 10 | 16 | 44211 | 2477.87 | 80 | 79 | 17.8 |
| B | 4 | 48 | 10978 | 611.94 | 80 | 79 | 17.8 |
| B | 15 | 204 | 9068 | 504.7 | 80 | 79 | 17.8 |
| C | 12 | 4 | 6935 | 354.24 | 74 | 75 | 19.4 |
| C | 1 | 16 | 2507 | 125.59 | 74 | 75 | 19.4 |
| C | 13 | 61 | 725 | 33.57 | 74 | 75 | 19.4 |
| D | 9 | 82 | 921345 | 53935.26 | 61 | 59 | 17.1 |
| D | 2 | 232 | 8839 | 514.01 | 61 | 59 | 17.1 |
| D | 13 | 248 | 5268 | 304.95 | 61 | 59 | 17.1 |
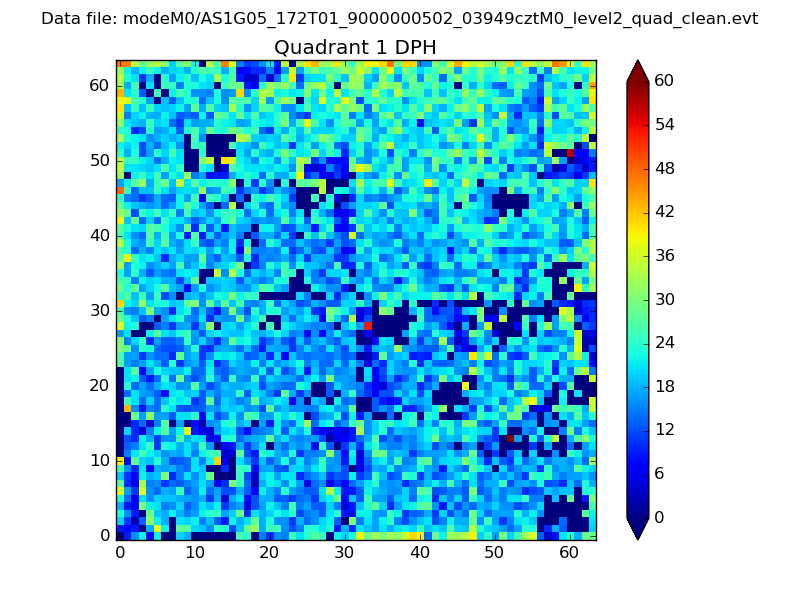
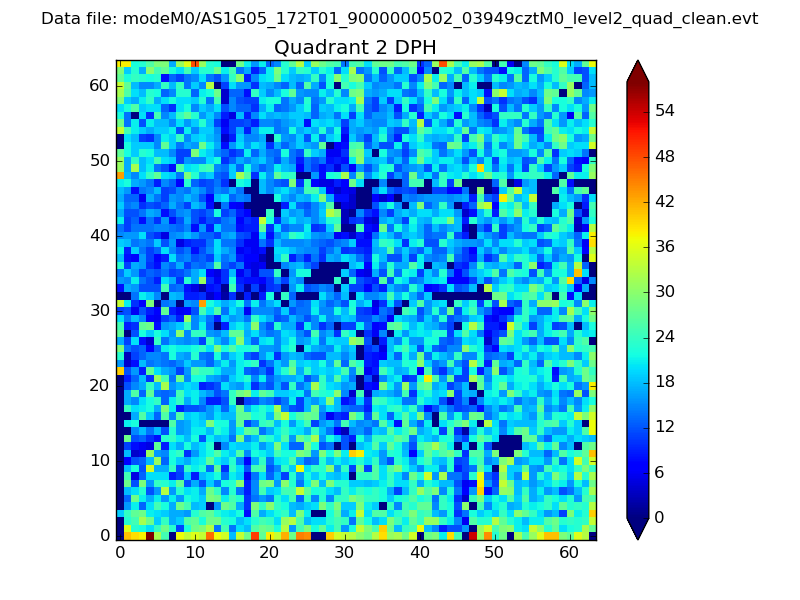
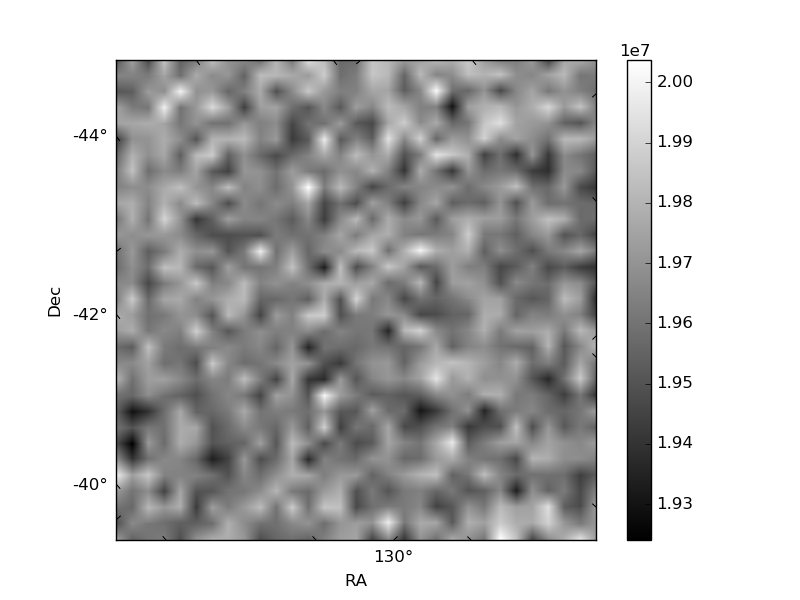
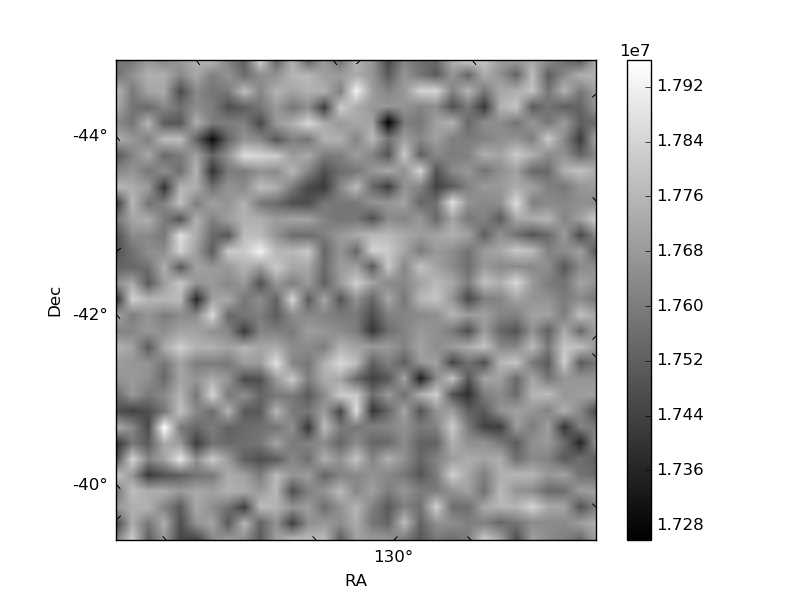
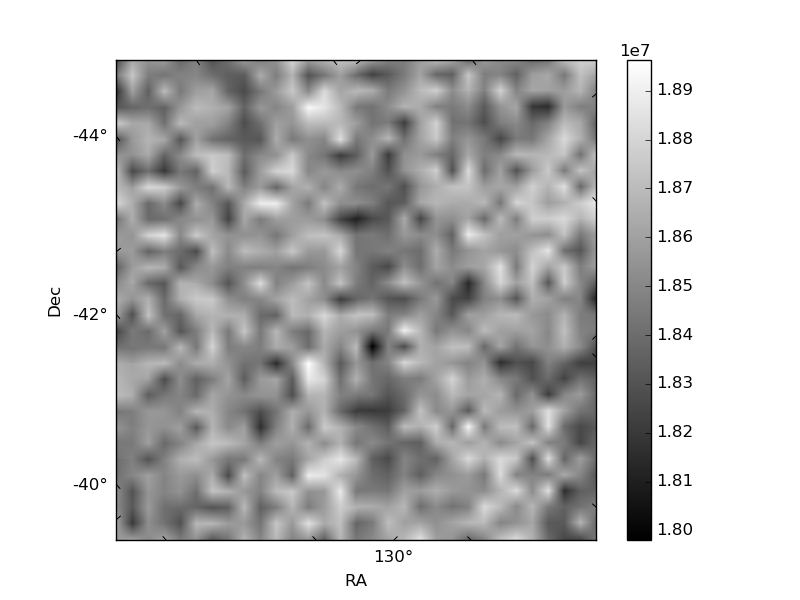
Histogram calculated using DETX and DETY for each event in the final _common_clean file
| Quadrant A | 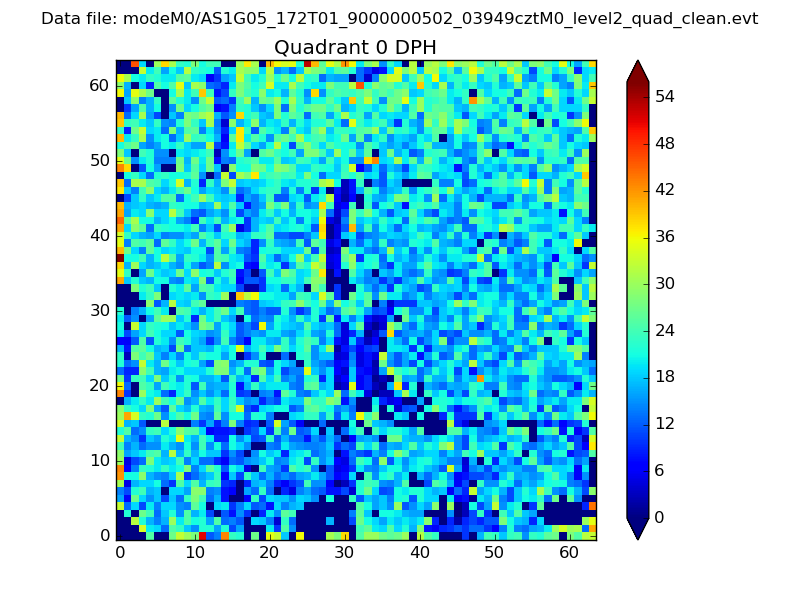 |
 |
Quadrant B |
|---|---|---|---|
| Quadrant D |  |
 |
Quadrant C |
| Plot type | Count rate plots | Images |
|---|---|---|
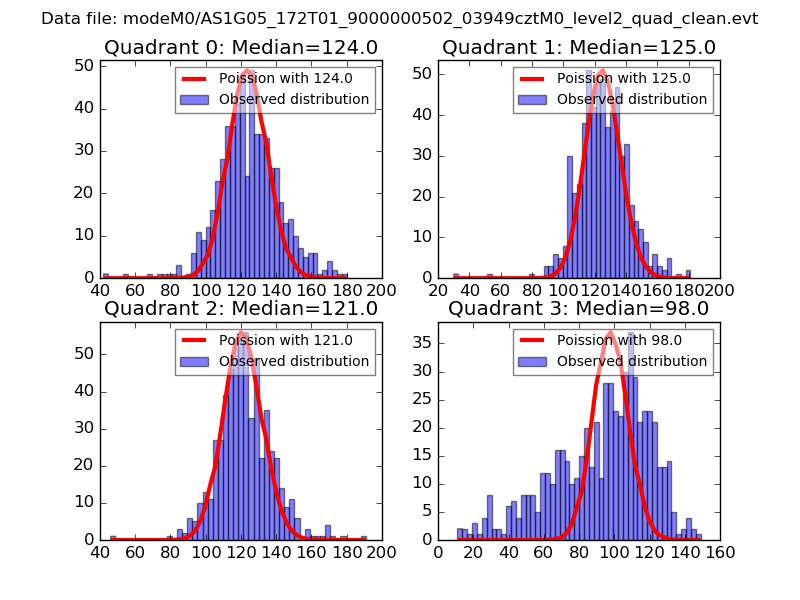
| Comparison with Poisson distribution Blue bars denote a histogram of data divided into 1 sec bins. Red curve is a Poisson curve with rate = median count rate of data. |
 |
 |
| Quadrant-wise count rates Data is divided into 100 sec bins |
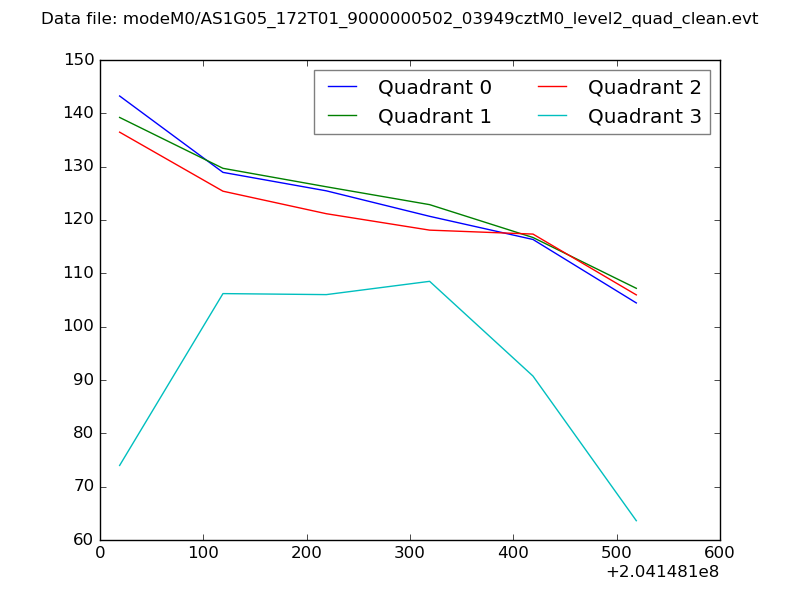 |
|
| Module-wise count rates for Quadrant A Data is divided into 100 sec bins |
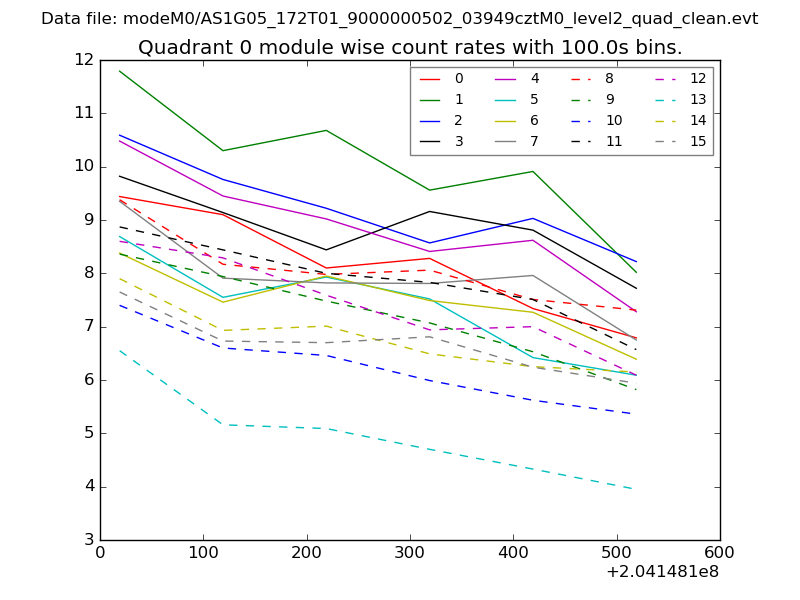 |
 |
| Module-wise count rates for Quadrant B Data is divided into 100 sec bins |
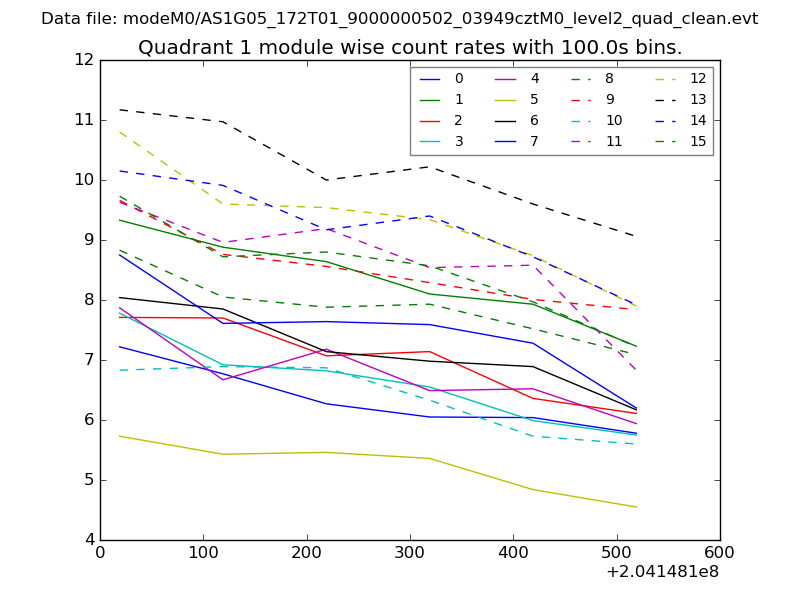 |
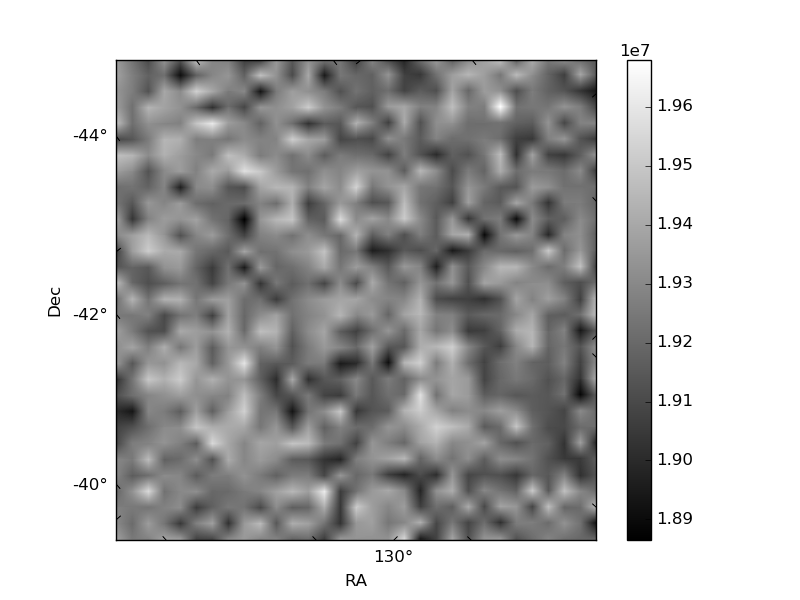 |
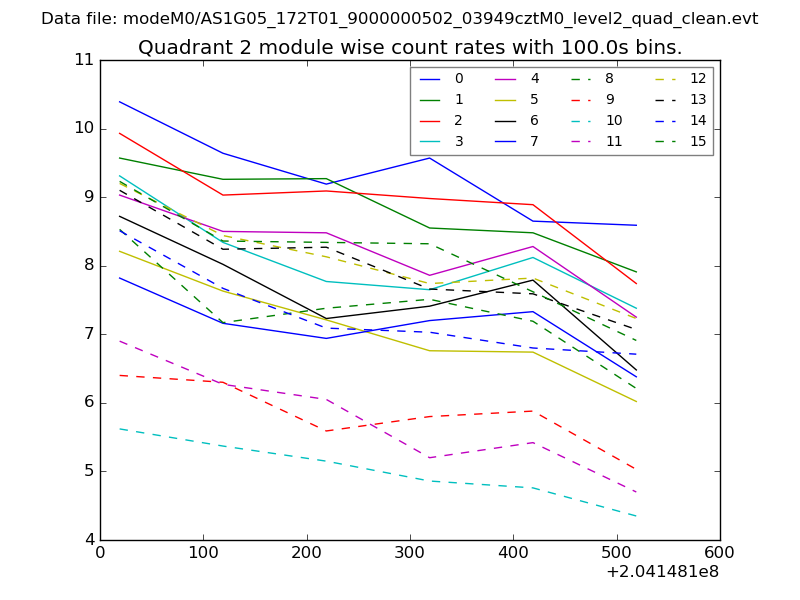
| Module-wise count rates for Quadrant C Data is divided into 100 sec bins |
 |
 |
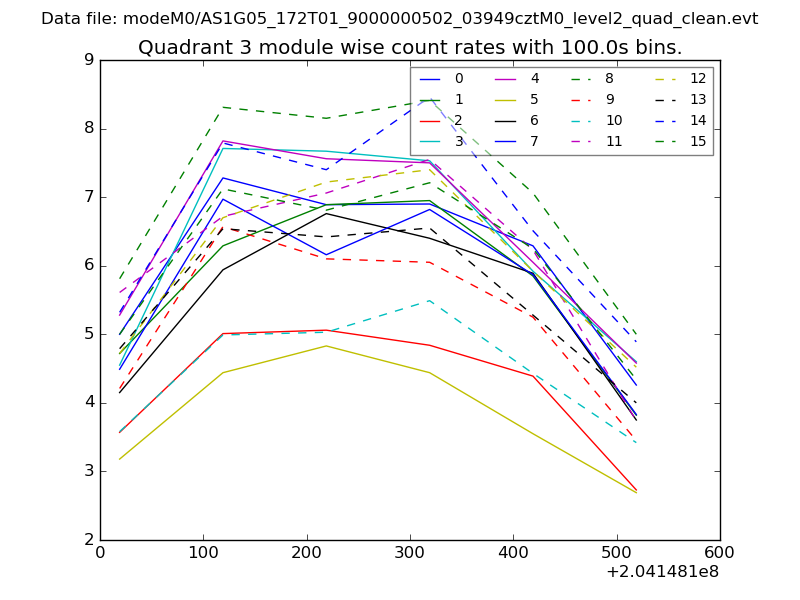
| Module-wise count rates for Quadrant D Data is divided into 100 sec bins |
 |
 |
| Parameter | Plot |
|---|---|
| CZT HV Monitor | 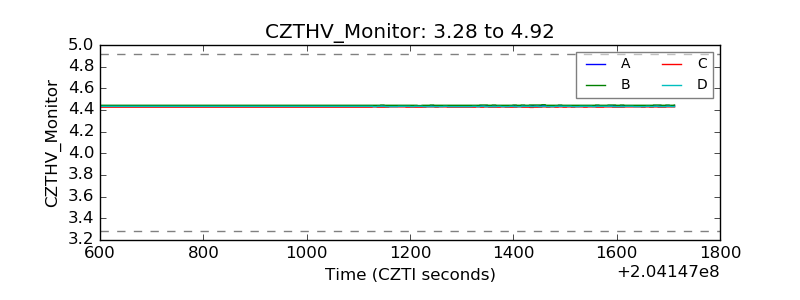 |
| D_VDD | 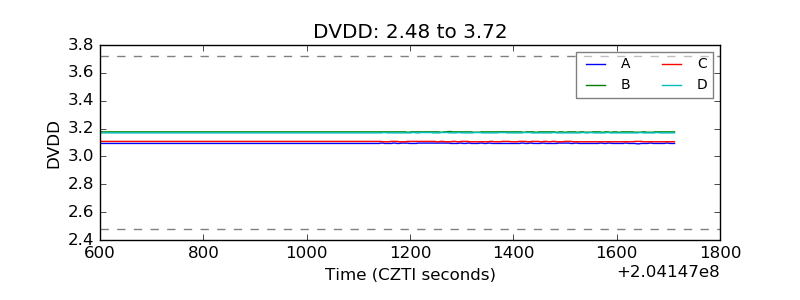 |
| Temperature 1 |  |
| Veto HV Monitor | 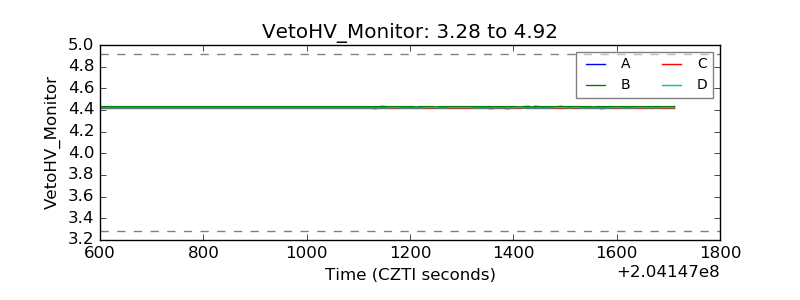 |
| Veto LLD |  |
| Alpha Counter | 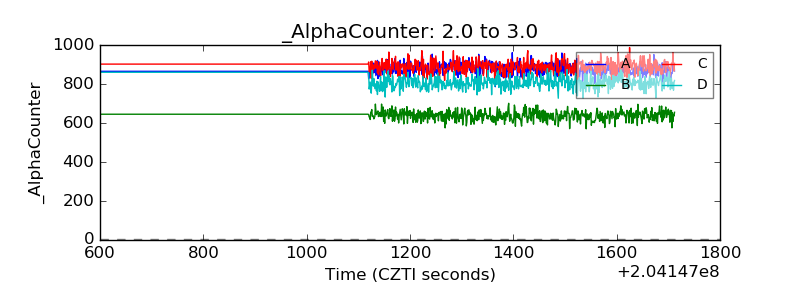 |
| _CPM_Rate | 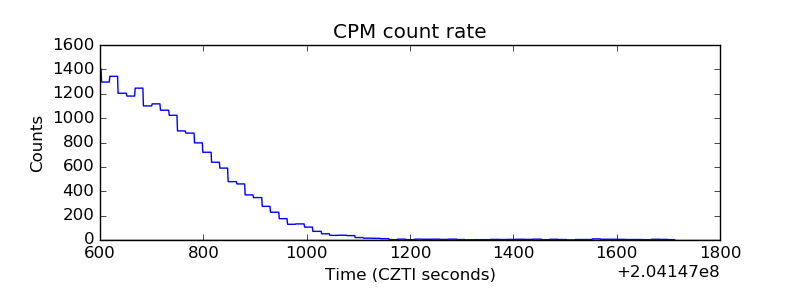 |
| CZT Counter | 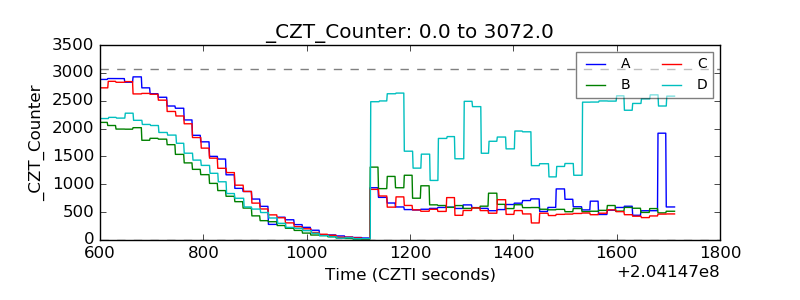 |
| +2.5 Volts monitor |  |
| +5 Volts monitor |  |
| Veto Counter | 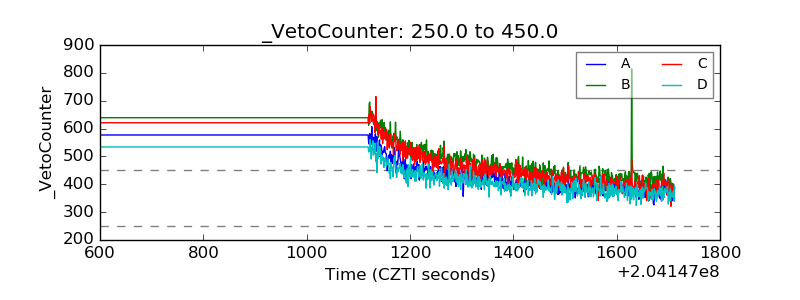 |