| Param | Original file | Final file |
|---|---|---|
| Filename | modeM0/AS1G05_246T02_9000000504cztM0_level2.fits | modeM0/AS1G05_246T02_9000000504cztM0_level2_quad_clean.evt |
| Size (bytes) | 563,486,400 | 549,178,560 |
| Size | 537.4 MB | 523.7 MB |
| Events in quadrant A | 3,041,104 | 3,142,077 |
| Events in quadrant B | 2,977,966 | 3,161,820 |
| Events in quadrant C | 3,057,500 | 3,033,533 |
| Events in quadrant D | 4,071,802 | 3,378,772 |
| Mode M0 | |||
|---|---|---|---|
| Quadrant | BADHDUFLAG | Total packets | Discarded packets |
| A | 0 | 149773 | 0 |
| B | 0 | 123818 | 0 |
| C | 0 | 117171 | 0 |
| D | 0 | 138125 | 0 |
| Mode M9 | |||
|---|---|---|---|
| Quadrant | BADHDUFLAG | Total packets | Discarded packets |
| A | 0 | 70 | 0 |
| B | 0 | 70 | 0 |
| C | 0 | 70 | 0 |
| D | 0 | 71 | 0 |
| Mode SS | |||
|---|---|---|---|
| Quadrant | BADHDUFLAG | Total packets | Discarded packets |
| A | 0 | 1158 | 0 |
| B | 0 | 1158 | 0 |
| C | 0 | 1158 | 0 |
| D | 0 | 1158 | 0 |
| Quadrant | Total seconds | Saturated seconds | Saturation percentage |
|---|---|---|---|
| A | 57094 | 1676 | 2.935510% |
| B | 57092 | 986 | 1.727037% |
| C | 57091 | 625 | 1.094743% |
| D | 57090 | 2060 | 3.608338% |
Noise dominated data is calculated using 1-second bins in cleaned event files. If a bin has >2000 counts, and if more than 50% of those come from <1% of pixels, then it is considered to be noise-dominated and hence unusable.
| Quadrant | # 1 sec bins | Bins with >0 counts | Bins with >2000 counts | High rate bins dominated by noise | Noise dominated (total time) | Noise dominated (detector-on time) | Marked lightcurve |
|---|---|---|---|---|---|---|---|
| A | 74235 | 57096 | 0 | 0 | 0.00% | 0.00% | 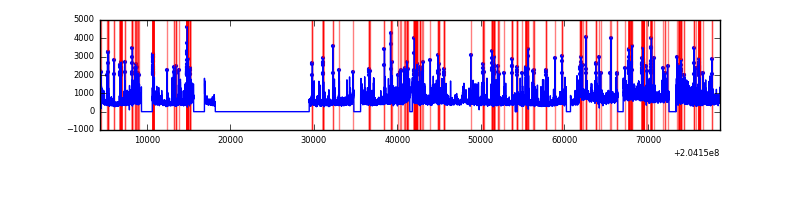 |
| B | 74235 | 57086 | 0 | 0 | 0.00% | 0.00% | 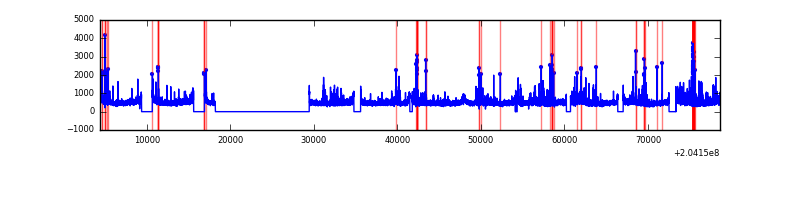 |
| C | 74235 | 57096 | 0 | 0 | 0.00% | 0.00% |  |
| D | 74235 | 57070 | 0 | 0 | 0.00% | 0.00% |  |
Top three noisy pixels from each quadrant. If the there are fewer than three noisy pixels in the level2.evt file, extra rows are filled as -1
| Pixel properties | Quadrant properties | ||||||
|---|---|---|---|---|---|---|---|
| Quadrant | DetID | PixID | Counts | Sigma | Mean | Median | Sigma |
| A | 0 | 29 | 2940 | 10.59 | 790 | 733 | 208.5 |
| A | 7 | 110 | 2603 | 8.97 | 790 | 733 | 208.5 |
| A | 9 | 19 | 2279 | 7.42 | 790 | 733 | 208.5 |
| B | 2 | 9 | 2616 | 11.71 | 786 | 745 | 159.8 |
| B | 12 | 226 | 2166 | 8.89 | 786 | 745 | 159.8 |
| B | 14 | 254 | 2088 | 8.4 | 786 | 745 | 159.8 |
| C | 1 | 81 | 2218 | 6.81 | 806 | 741 | 217.0 |
| C | 1 | 80 | 2175 | 6.61 | 806 | 741 | 217.0 |
| C | 12 | 241 | 2142 | 6.46 | 806 | 741 | 217.0 |
| D | 6 | 231 | 2436 | 5.05 | 1177 | 1111 | 262.6 |
| D | -1 | -1 | -1 | -1.0 | 1177 | 1111 | 262.6 |
| D | -1 | -1 | -1 | -1.0 | 1177 | 1111 | 262.6 |
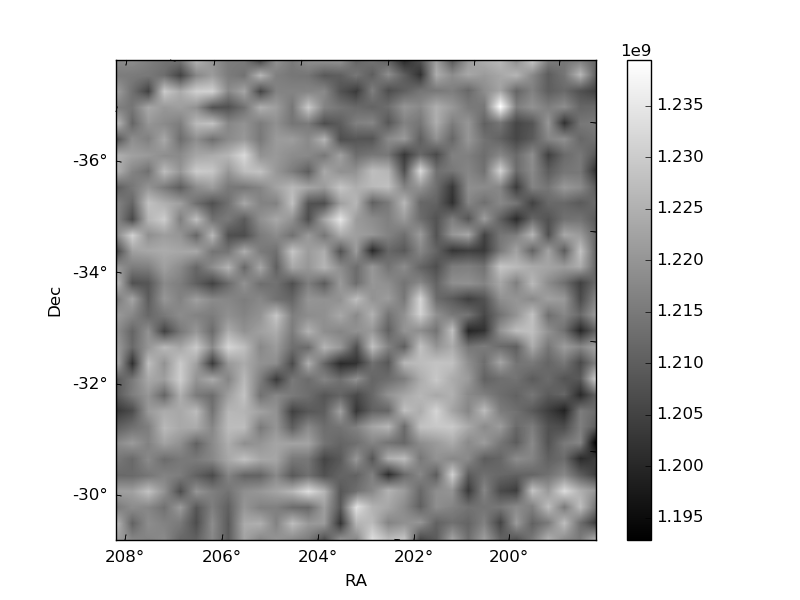
Histogram calculated using DETX and DETY for each event in the final _common_clean file
| Quadrant A |  |
 |
Quadrant B |
|---|---|---|---|
| Quadrant D | 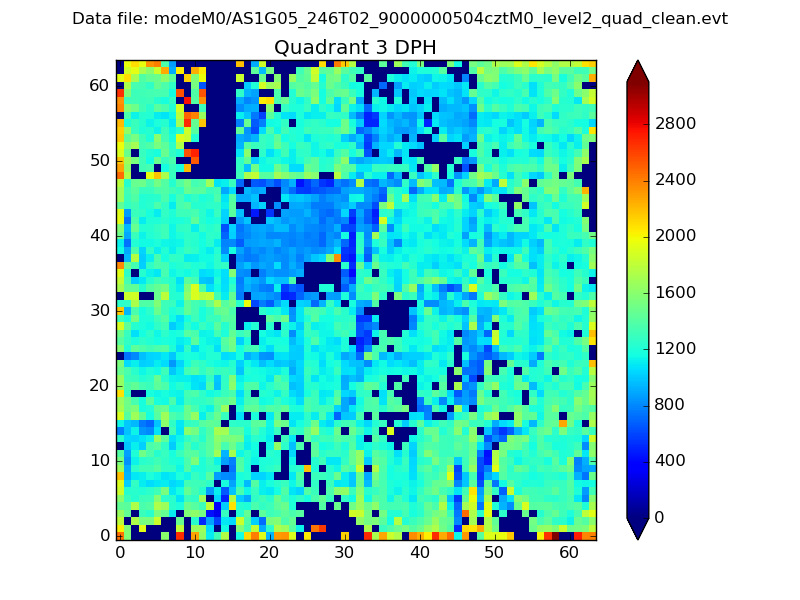 |
 |
Quadrant C |
| Plot type | Count rate plots | Images |
|---|---|---|
| Comparison with Poisson distribution Blue bars denote a histogram of data divided into 1 sec bins. Red curve is a Poisson curve with rate = median count rate of data. |
 |
 |
| Quadrant-wise count rates Data is divided into 100 sec bins |
 |
|
| Module-wise count rates for Quadrant A Data is divided into 100 sec bins |
 |
 |
| Module-wise count rates for Quadrant B Data is divided into 100 sec bins |
 |
 |
| Module-wise count rates for Quadrant C Data is divided into 100 sec bins |
 |
 |
| Module-wise count rates for Quadrant D Data is divided into 100 sec bins |
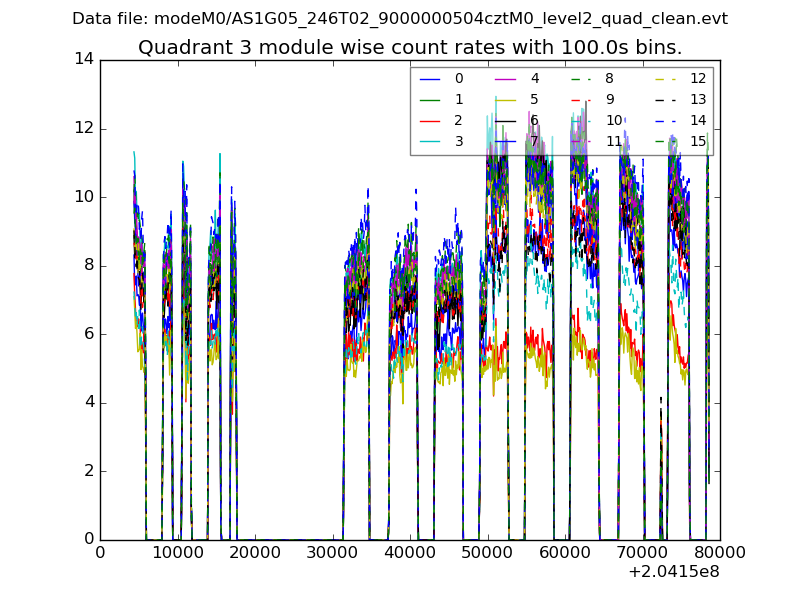 |
 |
| Parameter | Plot |
|---|---|
| CZT HV Monitor |  |
| D_VDD |  |
| Temperature 1 |  |
| Veto HV Monitor |  |
| Veto LLD |  |
| Alpha Counter |  |
| _CPM_Rate | 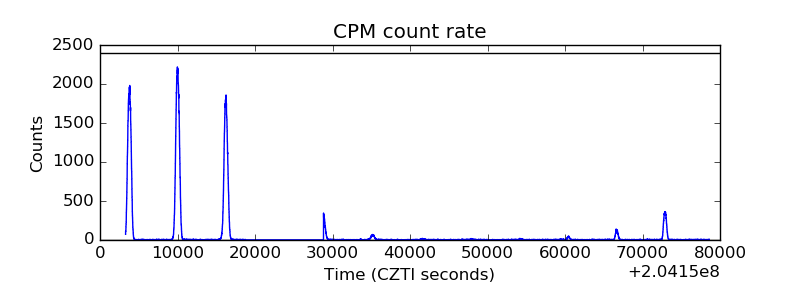 |
| CZT Counter | 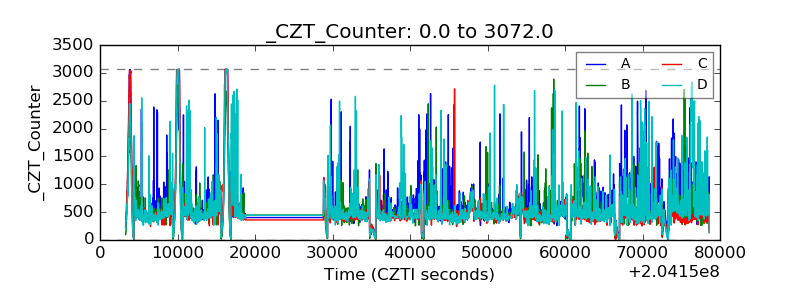 |
| +2.5 Volts monitor |  |
| +5 Volts monitor |  |
| _ROLL_ROT |  |
| _Roll_DEC |  |
| _Roll_RA | 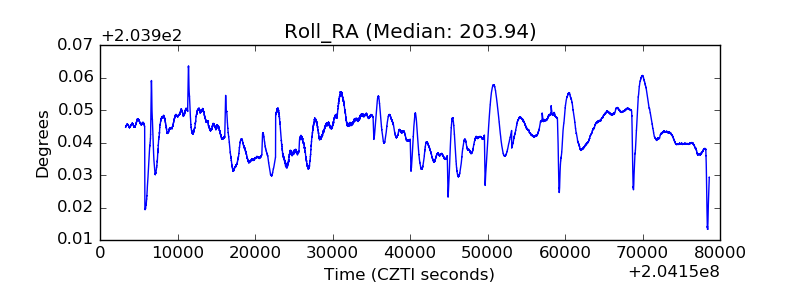 |
| Veto Counter |  |