| Param | Original file | Final file |
|---|---|---|
| Filename | modeM0/AS1G05_246T02_9000000504_03950cztM0_level2.evt | modeM0/AS1G05_246T02_9000000504_03950cztM0_level2_quad_clean.evt |
| Size (bytes) | 462,715,200 | 74,871,360 |
| Size | 441.3 MB | 71.4 MB |
| Events in quadrant A | 3,701,125 | 465,106 |
| Events in quadrant B | 3,455,442 | 472,462 |
| Events in quadrant C | 2,850,409 | 461,267 |
| Events in quadrant D | 3,579,452 | 429,476 |
| Mode M0 | |||
|---|---|---|---|
| Quadrant | BADHDUFLAG | Total packets | Discarded packets |
| A | 0 | 15178 | 5 |
| B | 0 | 14212 | 4 |
| C | 0 | 12774 | 10 |
| D | 0 | 15151 | 5 |
| Mode M9 | |||
|---|---|---|---|
| Quadrant | BADHDUFLAG | Total packets | Discarded packets |
| A | 0 | 23 | 0 |
| B | 0 | 23 | 0 |
| C | 0 | 23 | 0 |
| D | 0 | 24 | 0 |
| Mode SS | |||
|---|---|---|---|
| Quadrant | BADHDUFLAG | Total packets | Discarded packets |
| A | 0 | 128 | 0 |
| B | 0 | 128 | 0 |
| C | 0 | 128 | 0 |
| D | 0 | 128 | 0 |
| Quadrant | Total seconds | Saturated seconds | Saturation percentage |
|---|---|---|---|
| A | 6284 | 121 | 1.925525% |
| B | 6284 | 46 | 0.732018% |
| C | 6281 | 6 | 0.095526% |
| D | 6284 | 199 | 3.166773% |
Noise dominated data is calculated using 1-second bins in cleaned event files. If a bin has >2000 counts, and if more than 50% of those come from <1% of pixels, then it is considered to be noise-dominated and hence unusable.
| Quadrant | # 1 sec bins | Bins with >0 counts | Bins with >2000 counts | High rate bins dominated by noise | Noise dominated (total time) | Noise dominated (detector-on time) | Marked lightcurve |
|---|---|---|---|---|---|---|---|
| A | 7575 | 6286 | 72 | 72 | 0.95% | 1.15% | 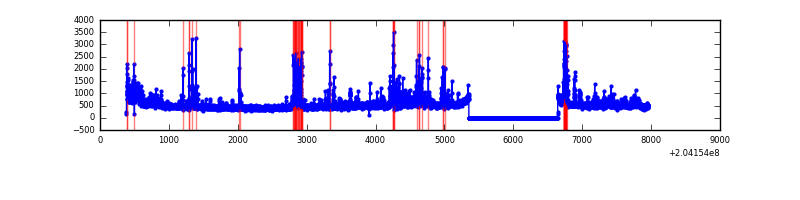 |
| B | 7575 | 6286 | 12 | 12 | 0.16% | 0.19% | 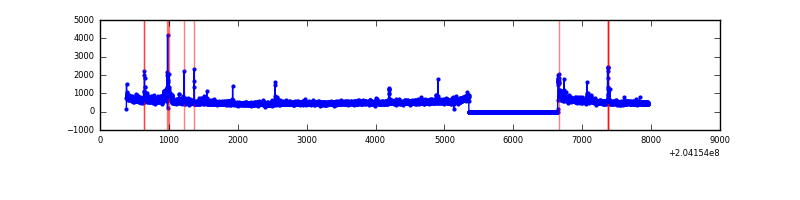 |
| C | 7575 | 6286 | 1 | 1 | 0.01% | 0.02% | 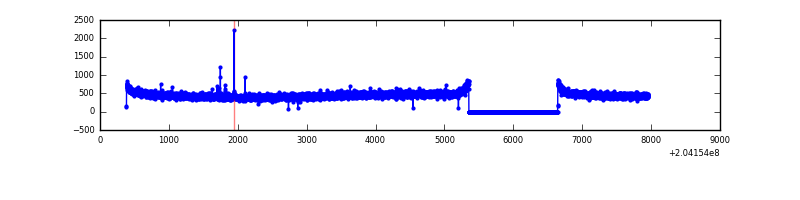 |
| D | 7575 | 6286 | 154 | 154 | 2.03% | 2.45% | 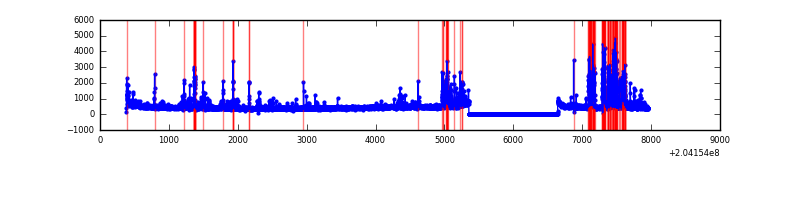 |
Top three noisy pixels from each quadrant. If the there are fewer than three noisy pixels in the level2.evt file, extra rows are filled as -1
| Pixel properties | Quadrant properties | ||||||
|---|---|---|---|---|---|---|---|
| Quadrant | DetID | PixID | Counts | Sigma | Mean | Median | Sigma |
| A | 0 | 199 | 442025 | 2917.09 | 748 | 736 | 151.3 |
| A | 8 | 15 | 142133 | 934.69 | 748 | 736 | 151.3 |
| A | 0 | 118 | 119310 | 783.82 | 748 | 736 | 151.3 |
| B | 3 | 0 | 242326 | 1654.62 | 765 | 747 | 146.0 |
| B | 15 | 204 | 118943 | 809.55 | 765 | 747 | 146.0 |
| B | 10 | 16 | 38104 | 255.87 | 765 | 747 | 146.0 |
| C | 1 | 16 | 8875 | 48.19 | 724 | 728 | 169.0 |
| C | 10 | 65 | 6876 | 36.37 | 724 | 728 | 169.0 |
| C | 13 | 61 | 6241 | 32.61 | 724 | 728 | 169.0 |
| D | 2 | 232 | 631037 | 3704.51 | 704 | 684 | 170.2 |
| D | 12 | 233 | 121970 | 712.78 | 704 | 684 | 170.2 |
| D | 13 | 239 | 57114 | 331.63 | 704 | 684 | 170.2 |
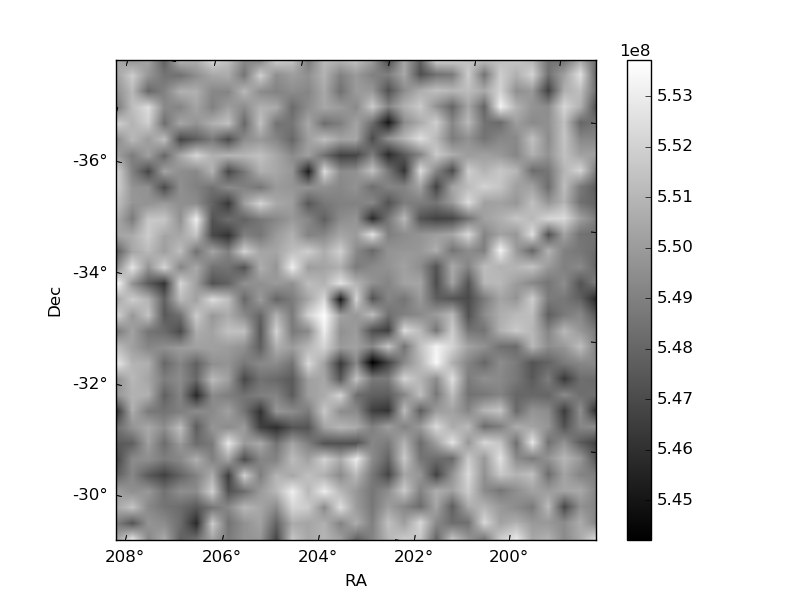
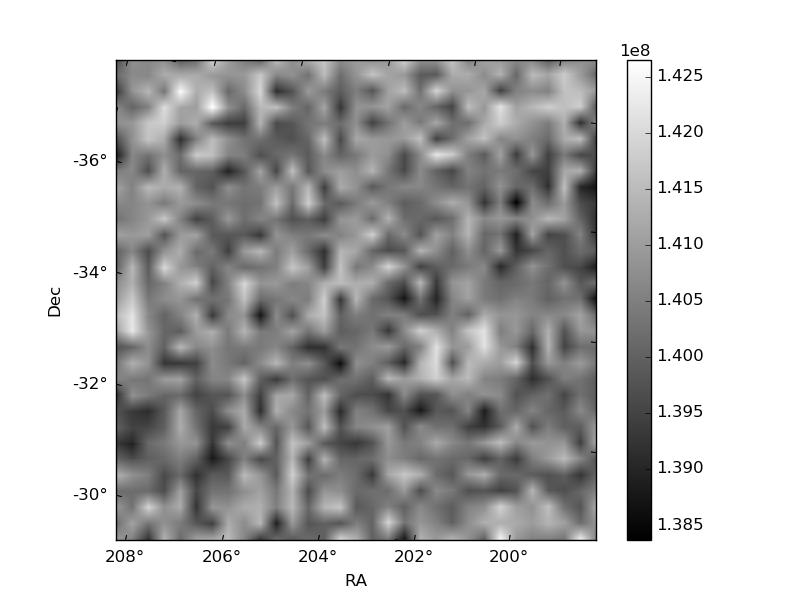
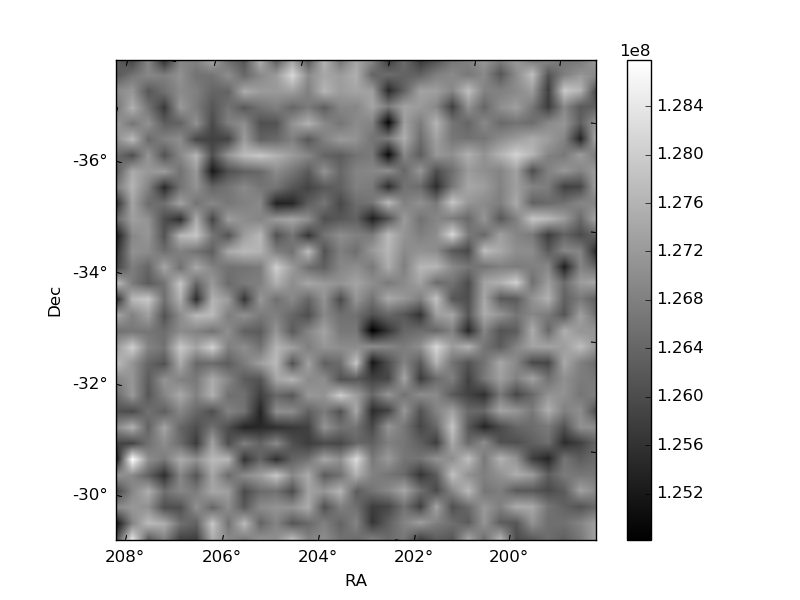
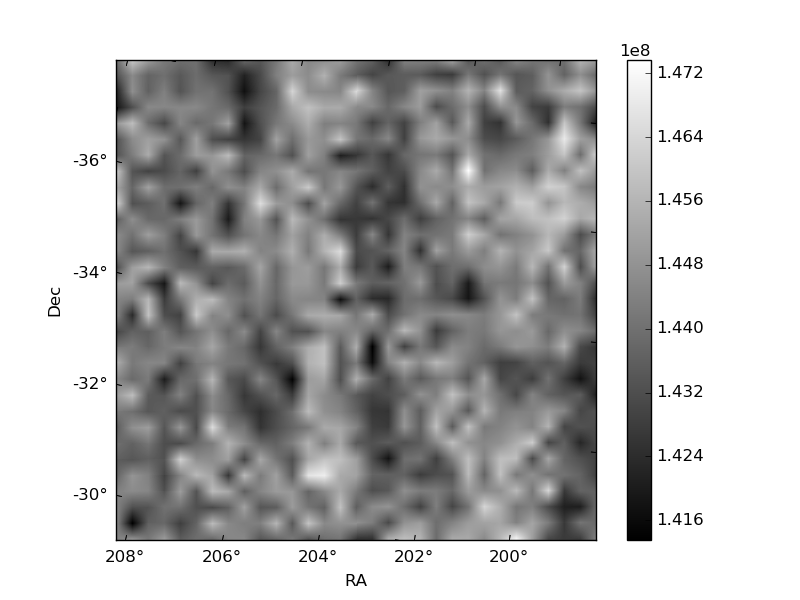
Histogram calculated using DETX and DETY for each event in the final _common_clean file
| Quadrant A | 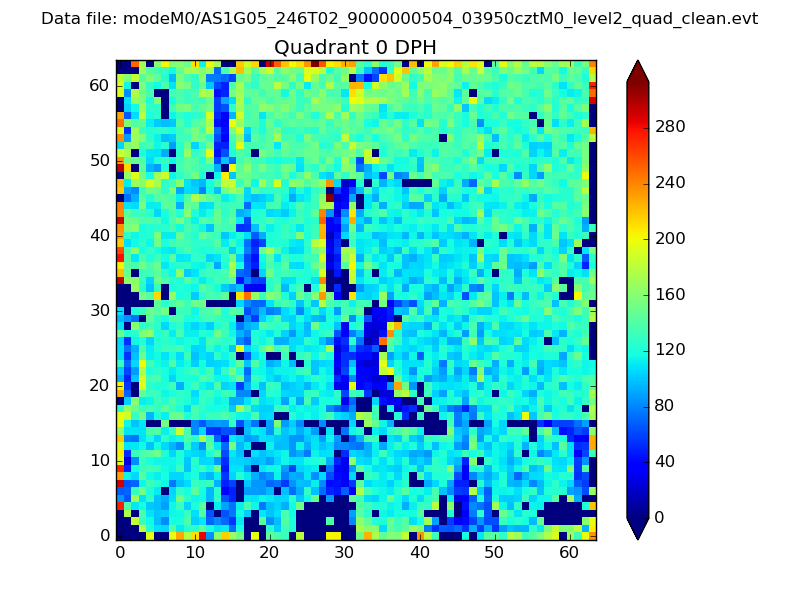 |
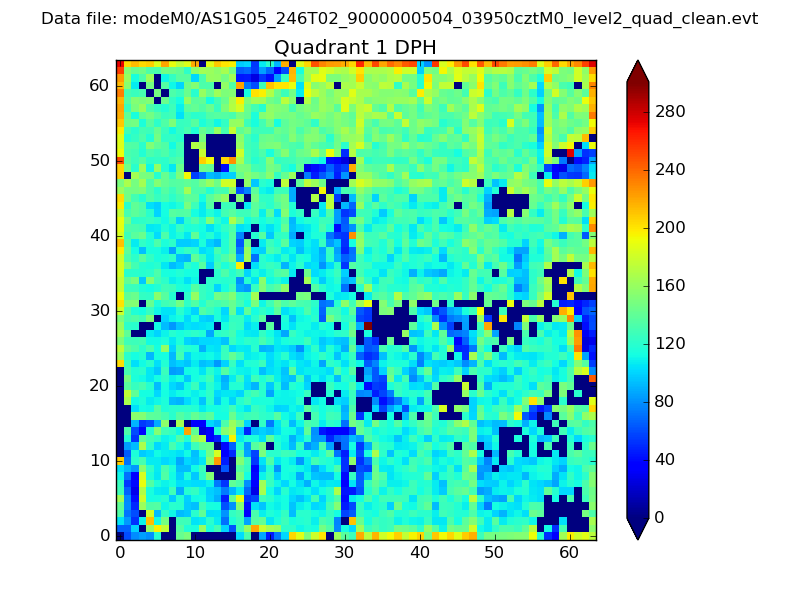 |
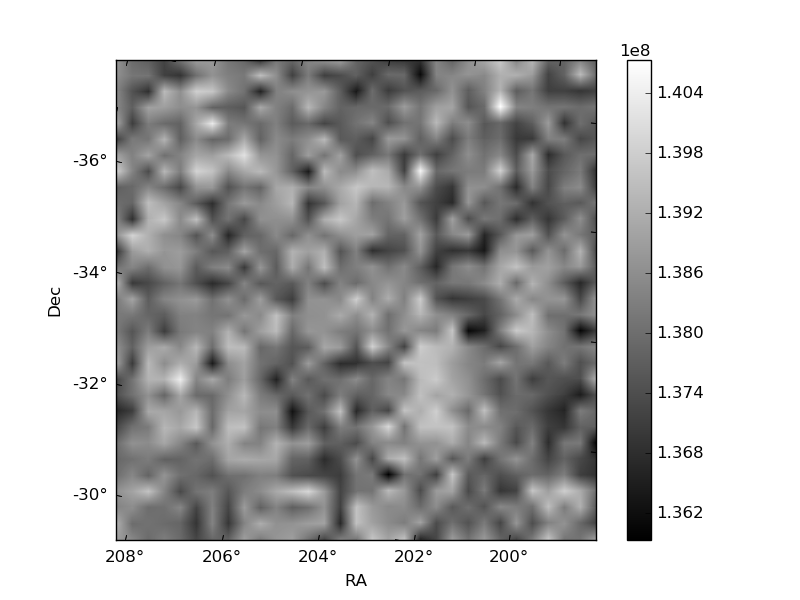
Quadrant B |
|---|---|---|---|
| Quadrant D | 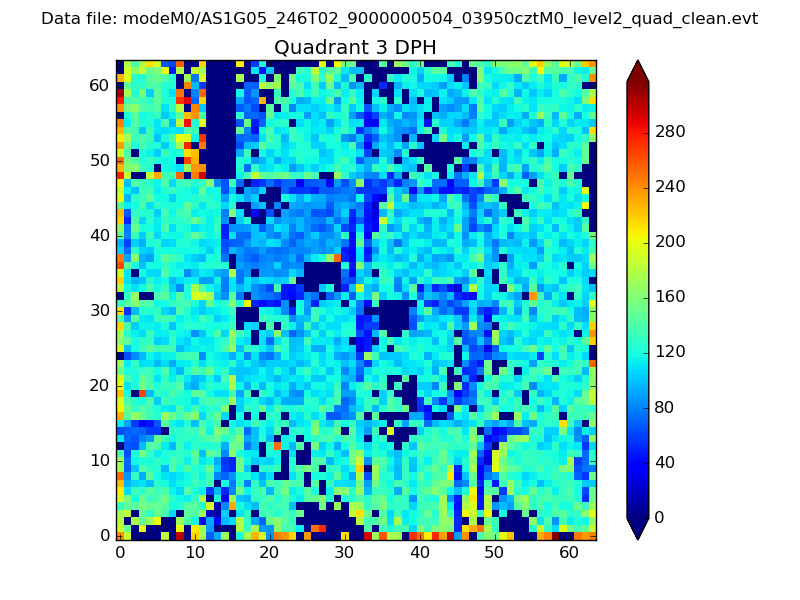 |
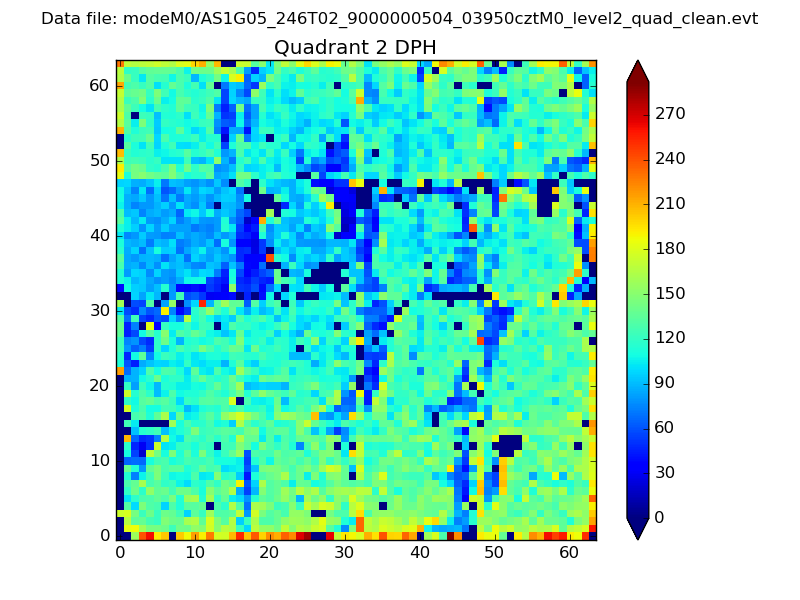 |
Quadrant C |
| Plot type | Count rate plots | Images |
|---|---|---|
| Comparison with Poisson distribution Blue bars denote a histogram of data divided into 1 sec bins. Red curve is a Poisson curve with rate = median count rate of data. |
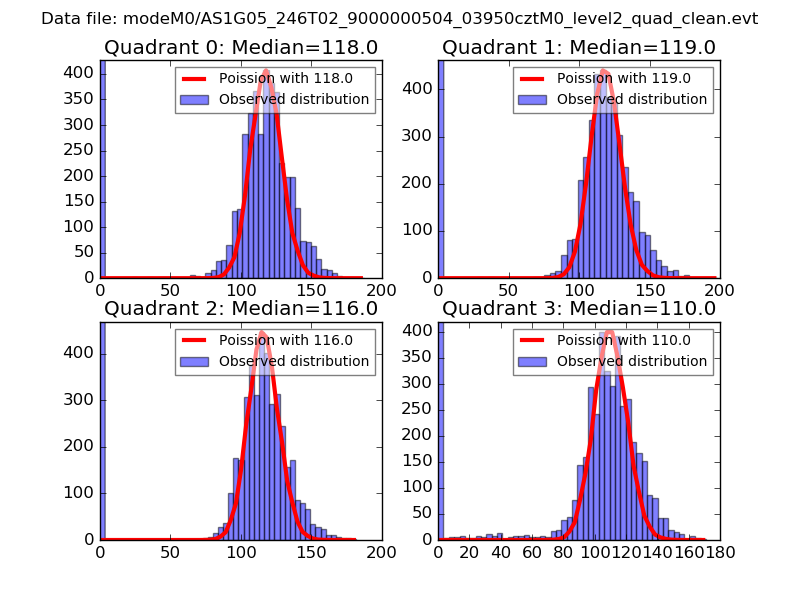 |
 |
| Quadrant-wise count rates Data is divided into 100 sec bins |
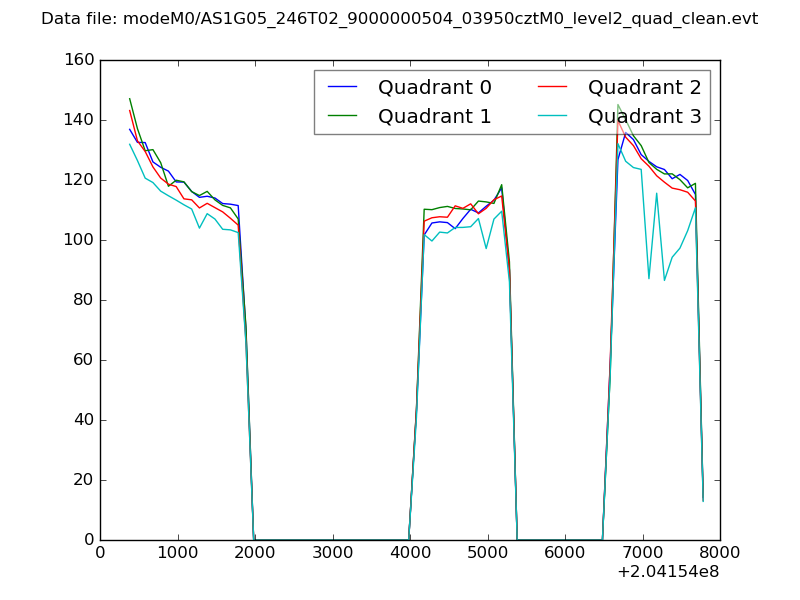 |
|
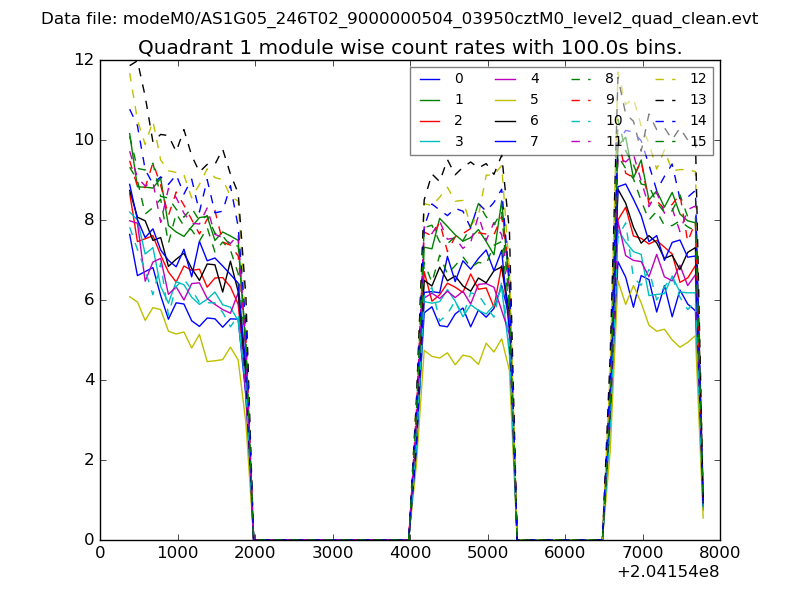
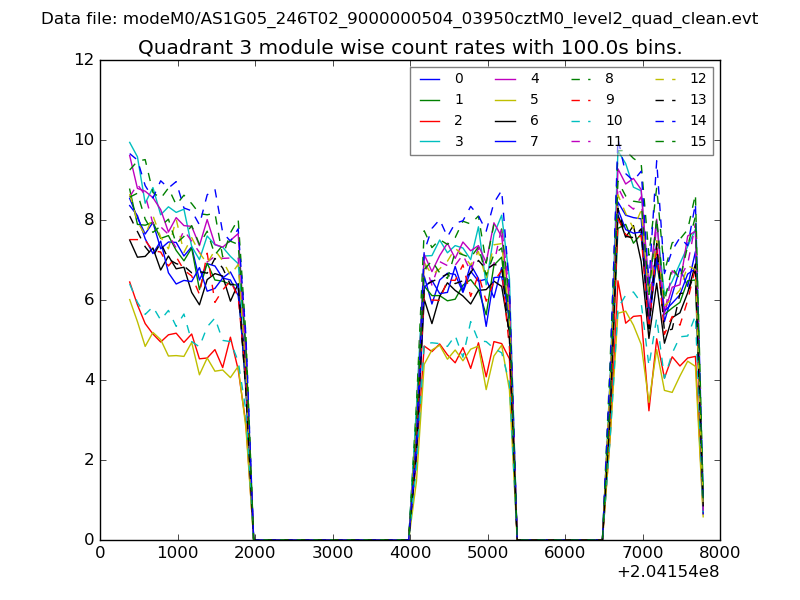
| Module-wise count rates for Quadrant A Data is divided into 100 sec bins |
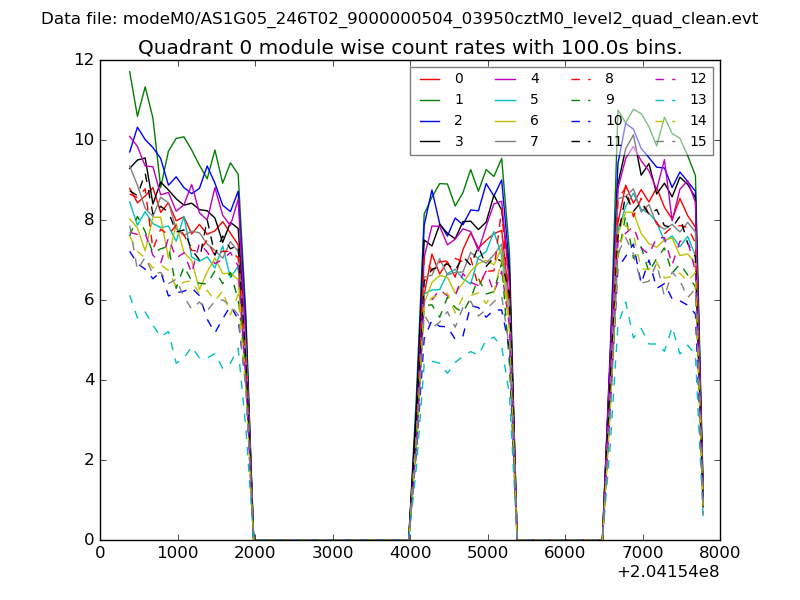 |
 |
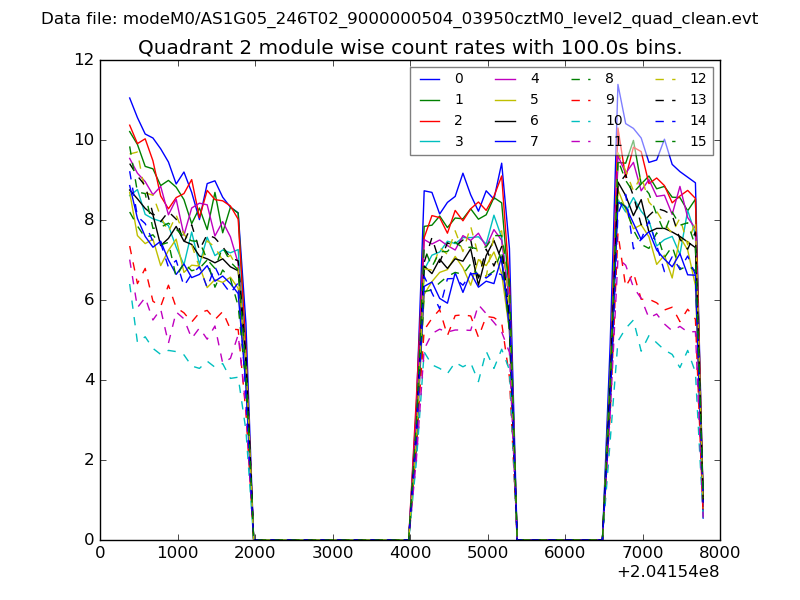
| Module-wise count rates for Quadrant B Data is divided into 100 sec bins |
 |
 |
| Module-wise count rates for Quadrant C Data is divided into 100 sec bins |
 |
 |
| Module-wise count rates for Quadrant D Data is divided into 100 sec bins |
 |
 |
| Parameter | Plot |
|---|---|
| CZT HV Monitor | 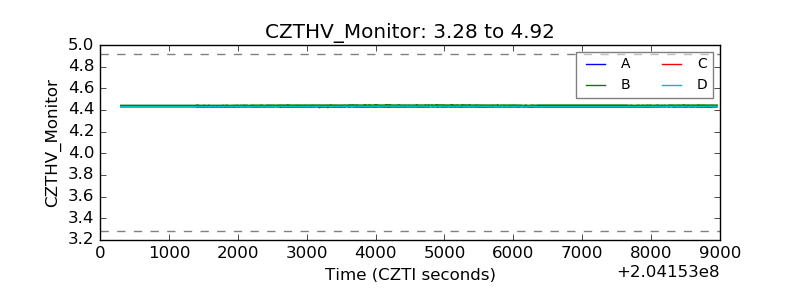 |
| D_VDD | 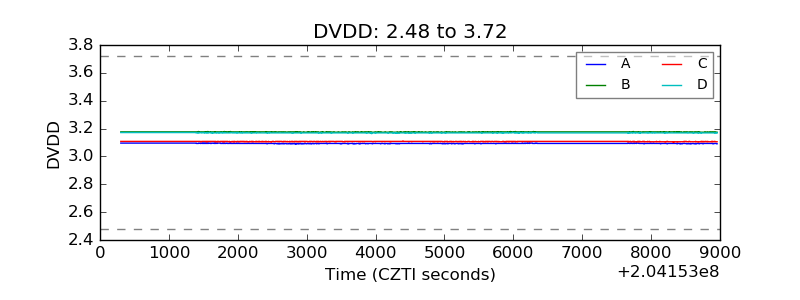 |
| Temperature 1 | 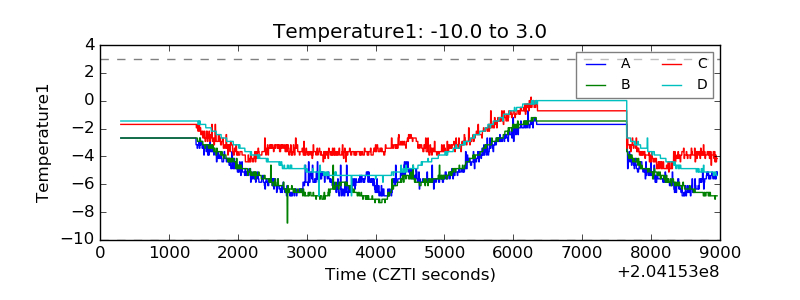 |
| Veto HV Monitor | 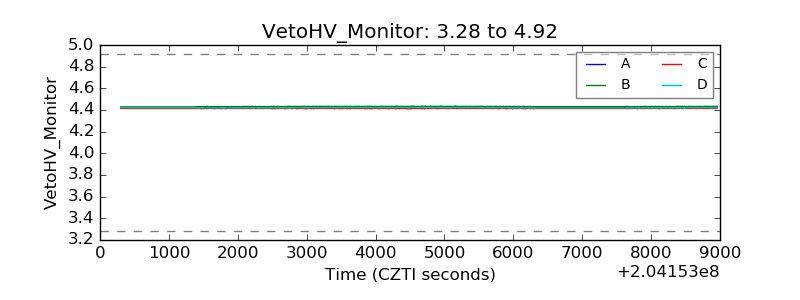 |
| Veto LLD | 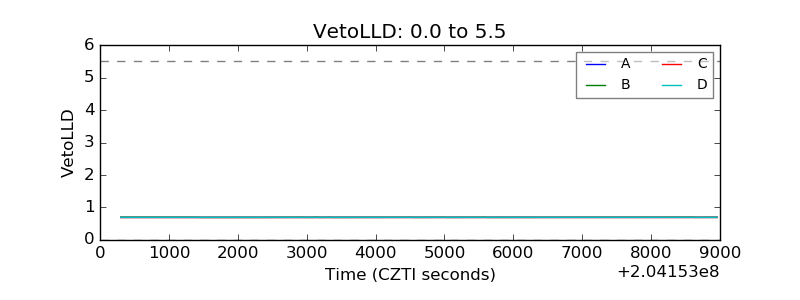 |
| Alpha Counter | 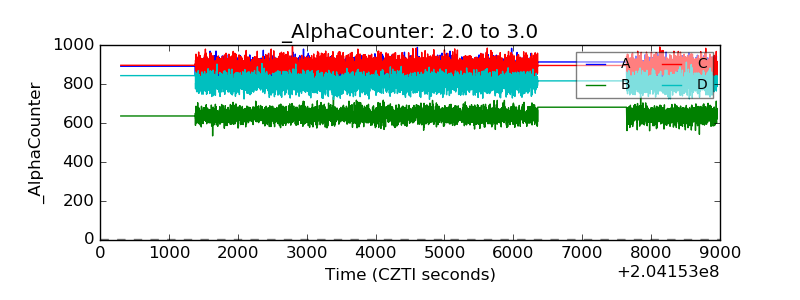 |
| _CPM_Rate | 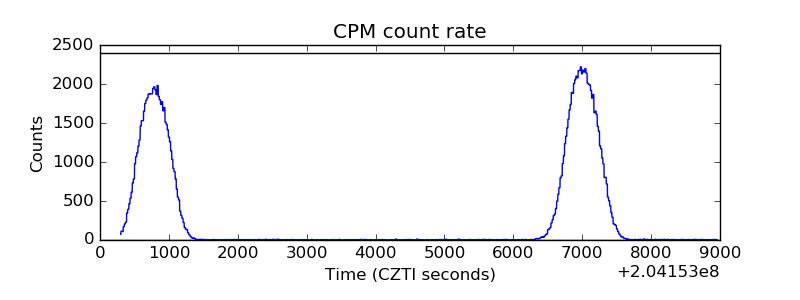 |
| CZT Counter | 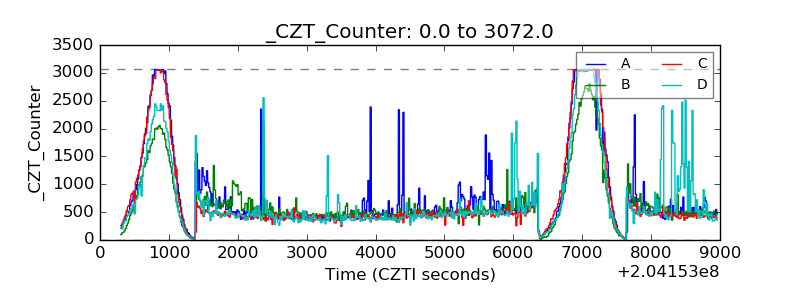 |
| +2.5 Volts monitor |  |
| +5 Volts monitor |  |
| Veto Counter | 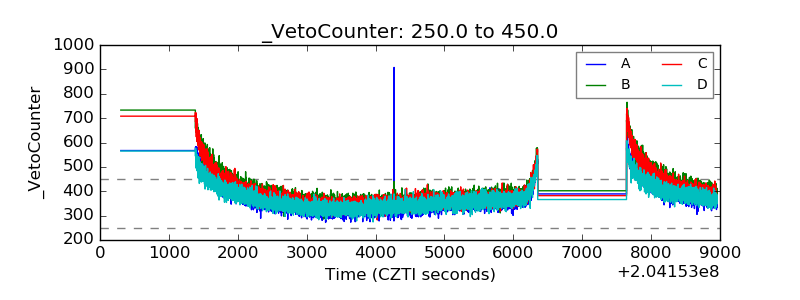 |