| Param | Original file | Final file |
|---|---|---|
| Filename | modeM0/AS1G05_246T02_9000000504_03951cztM0_level2.evt | modeM0/AS1G05_246T02_9000000504_03951cztM0_level2_quad_clean.evt |
| Size (bytes) | 496,221,120 | 70,594,560 |
| Size | 473.2 MB | 67.3 MB |
| Events in quadrant A | 3,668,944 | 431,734 |
| Events in quadrant B | 3,427,915 | 442,609 |
| Events in quadrant C | 2,995,894 | 432,807 |
| Events in quadrant D | 4,504,781 | 387,538 |
| Mode M0 | |||
|---|---|---|---|
| Quadrant | BADHDUFLAG | Total packets | Discarded packets |
| A | 0 | 14934 | 3 |
| B | 0 | 14128 | 2 |
| C | 0 | 13143 | 2 |
| D | 0 | 17858 | 2 |
| Mode M9 | |||
|---|---|---|---|
| Quadrant | BADHDUFLAG | Total packets | Discarded packets |
| A | 0 | 26 | 0 |
| B | 0 | 26 | 0 |
| C | 0 | 26 | 0 |
| D | 0 | 26 | 0 |
| Mode SS | |||
|---|---|---|---|
| Quadrant | BADHDUFLAG | Total packets | Discarded packets |
| A | 0 | 130 | 0 |
| B | 0 | 130 | 0 |
| C | 0 | 130 | 0 |
| D | 0 | 130 | 0 |
| Quadrant | Total seconds | Saturated seconds | Saturation percentage |
|---|---|---|---|
| A | 6345 | 155 | 2.442868% |
| B | 6345 | 73 | 1.150512% |
| C | 6345 | 37 | 0.583136% |
| D | 6345 | 482 | 7.596533% |
Noise dominated data is calculated using 1-second bins in cleaned event files. If a bin has >2000 counts, and if more than 50% of those come from <1% of pixels, then it is considered to be noise-dominated and hence unusable.
| Quadrant | # 1 sec bins | Bins with >0 counts | Bins with >2000 counts | High rate bins dominated by noise | Noise dominated (total time) | Noise dominated (detector-on time) | Marked lightcurve |
|---|---|---|---|---|---|---|---|
| A | 8935 | 6347 | 68 | 68 | 0.76% | 1.07% | 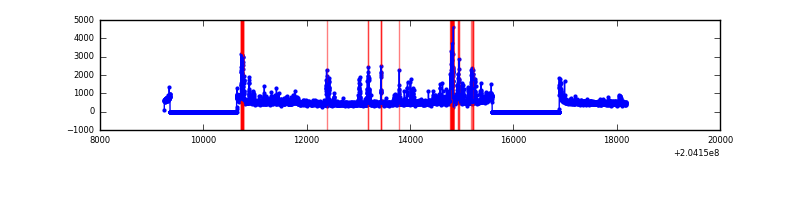 |
| B | 8935 | 6347 | 9 | 9 | 0.10% | 0.14% | 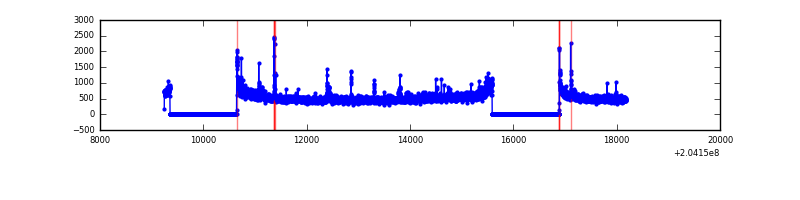 |
| C | 8935 | 6347 | 2 | 2 | 0.02% | 0.03% | 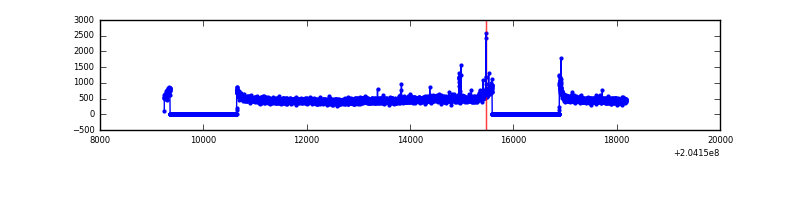 |
| D | 8935 | 6347 | 382 | 382 | 4.28% | 6.02% | 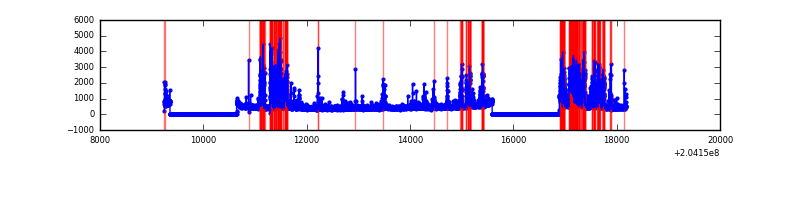 |
Top three noisy pixels from each quadrant. If the there are fewer than three noisy pixels in the level2.evt file, extra rows are filled as -1
| Pixel properties | Quadrant properties | ||||||
|---|---|---|---|---|---|---|---|
| Quadrant | DetID | PixID | Counts | Sigma | Mean | Median | Sigma |
| A | 0 | 199 | 328199 | 2072.25 | 772 | 756 | 158.0 |
| A | 0 | 118 | 152302 | 959.07 | 772 | 756 | 158.0 |
| A | 8 | 15 | 88841 | 557.45 | 772 | 756 | 158.0 |
| B | 3 | 0 | 124894 | 821.21 | 792 | 775 | 151.1 |
| B | 15 | 204 | 120892 | 794.73 | 792 | 775 | 151.1 |
| B | 4 | 81 | 42743 | 277.67 | 792 | 775 | 151.1 |
| C | 10 | 65 | 30035 | 167.16 | 753 | 757 | 175.1 |
| C | 1 | 16 | 22955 | 126.74 | 753 | 757 | 175.1 |
| C | 13 | 61 | 6422 | 32.34 | 753 | 757 | 175.1 |
| D | 2 | 232 | 1365011 | 7860.13 | 719 | 698 | 173.6 |
| D | 12 | 233 | 147963 | 848.43 | 719 | 698 | 173.6 |
| D | 13 | 239 | 48179 | 273.55 | 719 | 698 | 173.6 |
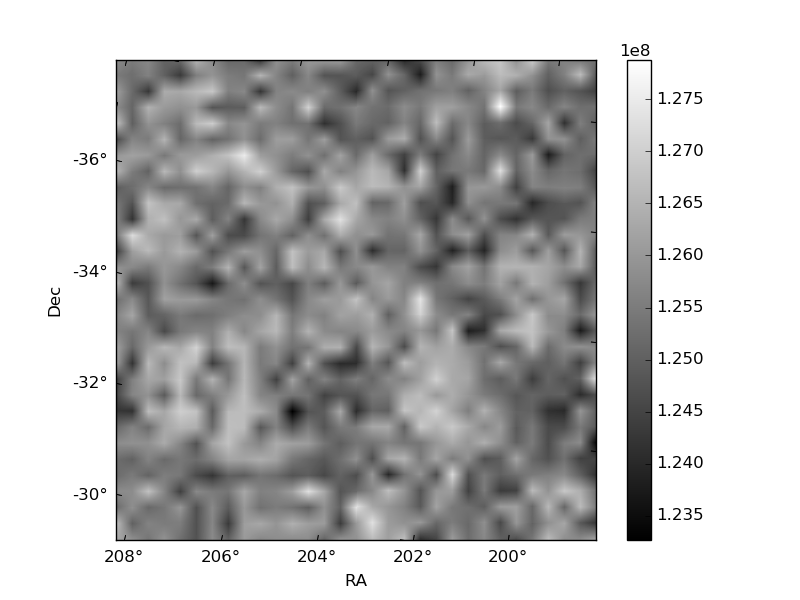
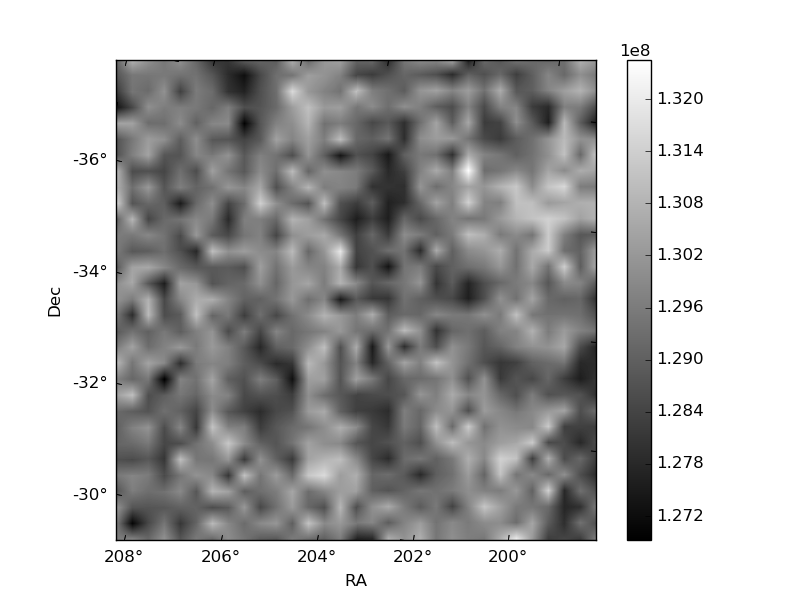
Histogram calculated using DETX and DETY for each event in the final _common_clean file
| Quadrant A | 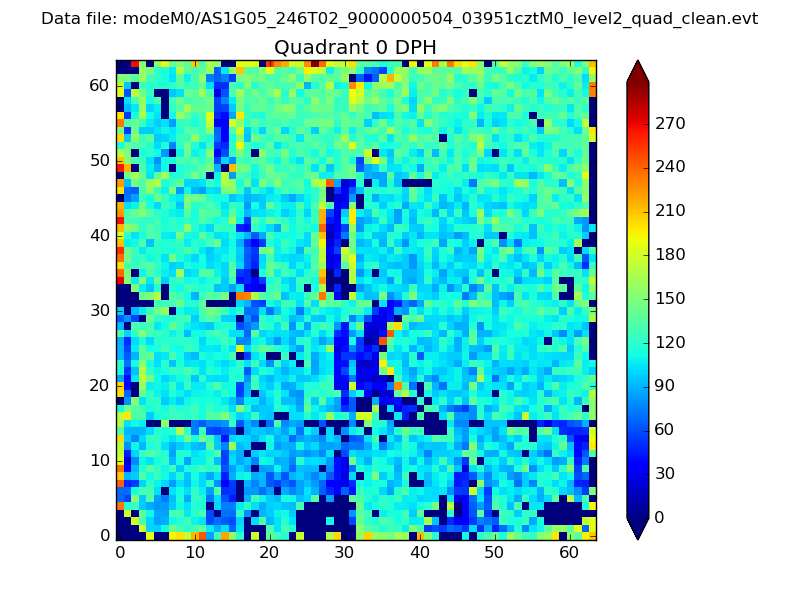 |
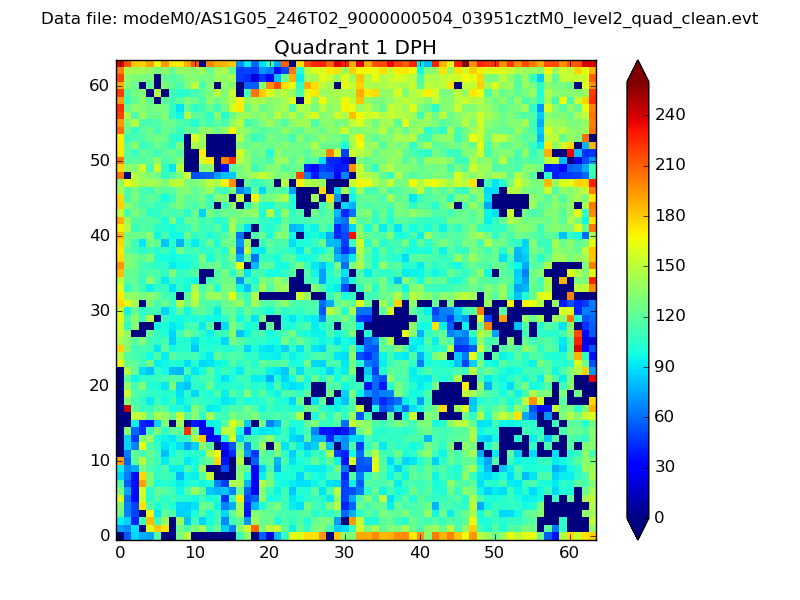 |
Quadrant B |
|---|---|---|---|
| Quadrant D | 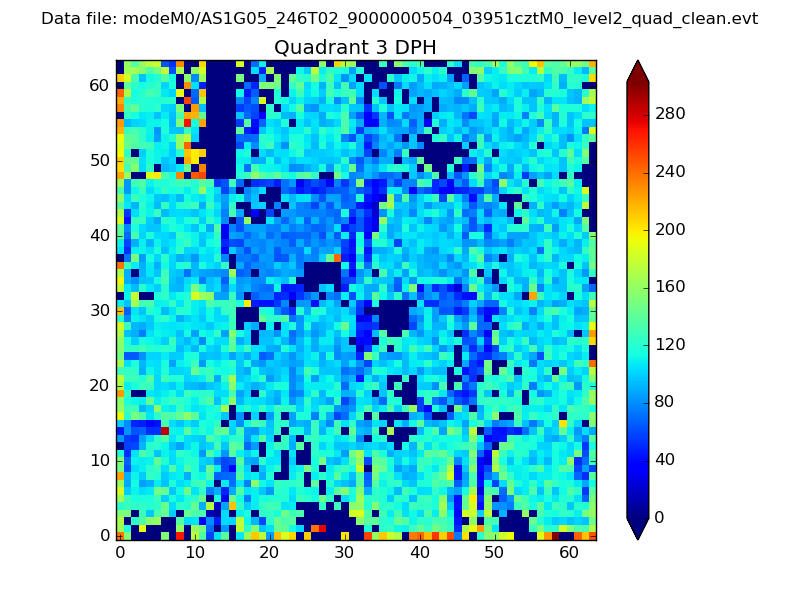 |
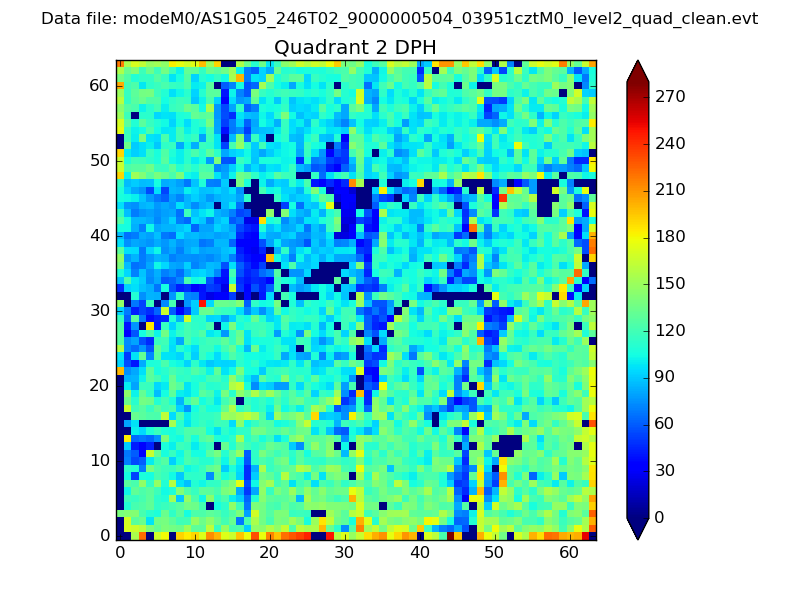 |
Quadrant C |
| Plot type | Count rate plots | Images |
|---|---|---|
| Comparison with Poisson distribution Blue bars denote a histogram of data divided into 1 sec bins. Red curve is a Poisson curve with rate = median count rate of data. |
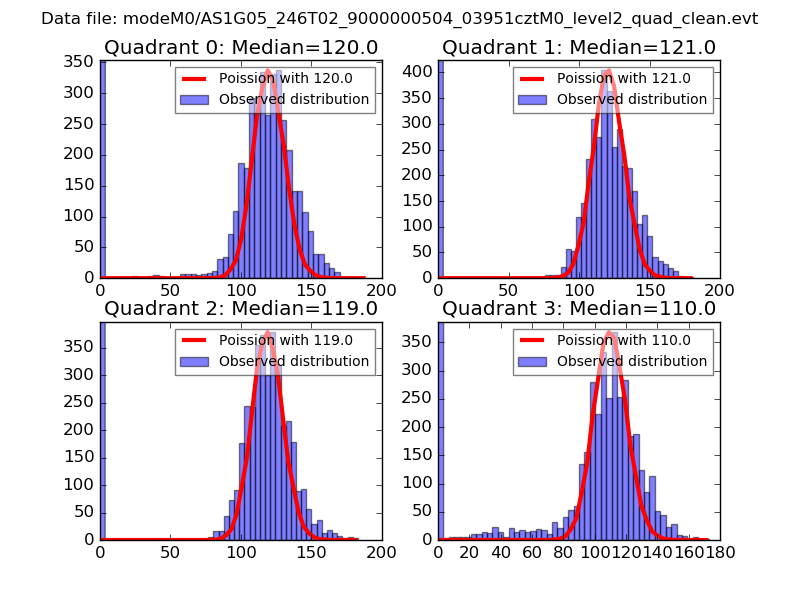 |
 |
| Quadrant-wise count rates Data is divided into 100 sec bins |
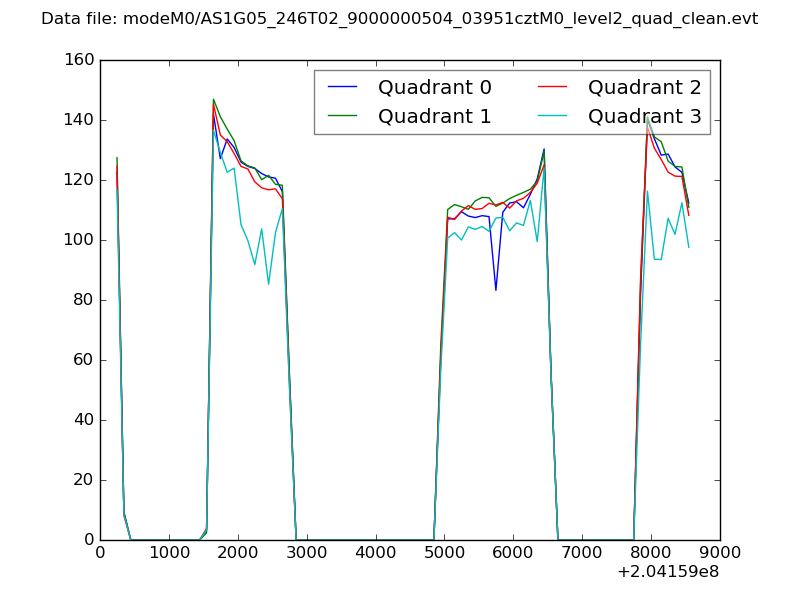 |
|
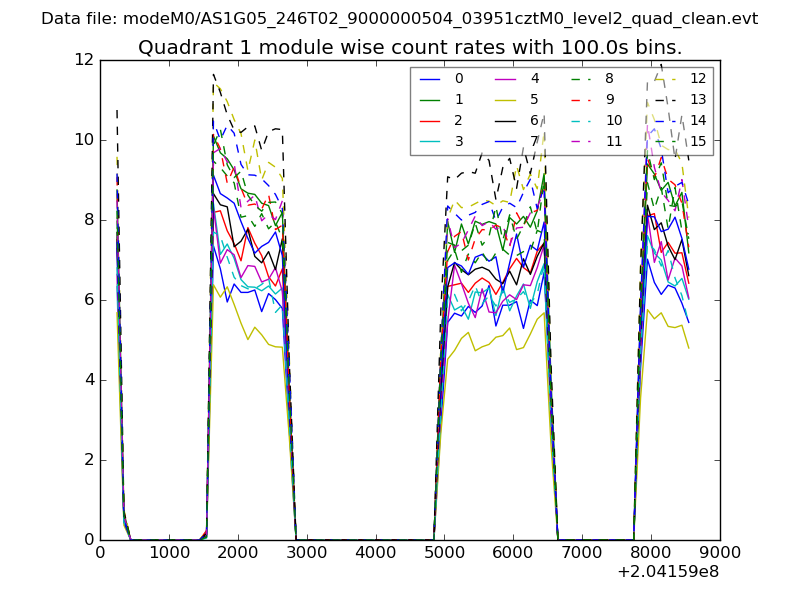
| Module-wise count rates for Quadrant A Data is divided into 100 sec bins |
 |
 |
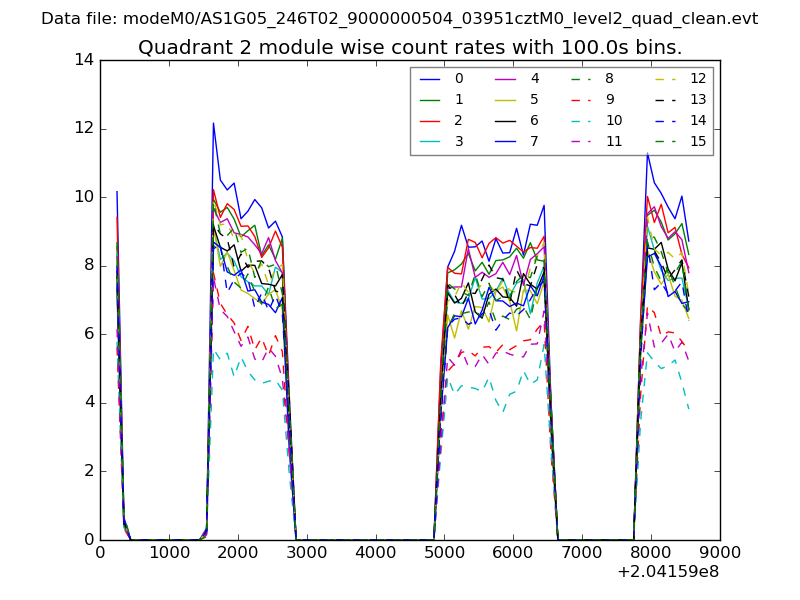
| Module-wise count rates for Quadrant B Data is divided into 100 sec bins |
 |
 |
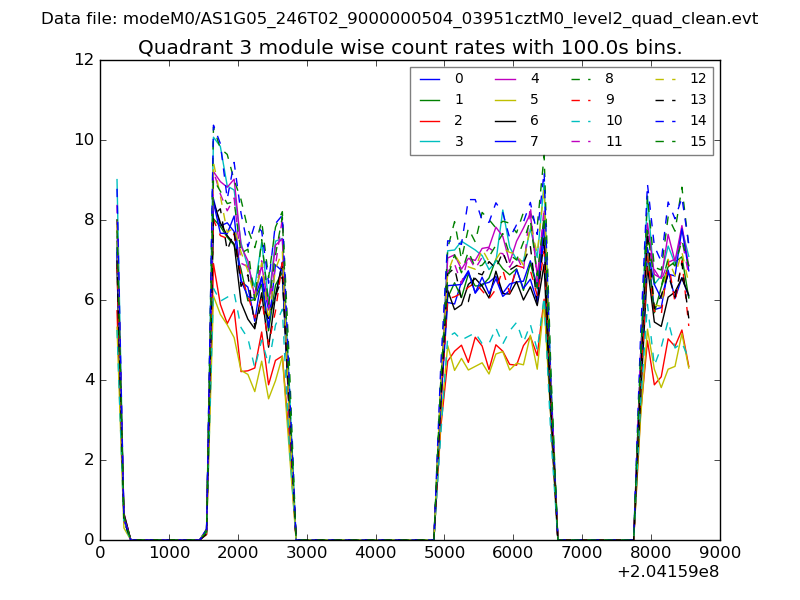
| Module-wise count rates for Quadrant C Data is divided into 100 sec bins |
 |
 |
| Module-wise count rates for Quadrant D Data is divided into 100 sec bins |
 |
 |
| Parameter | Plot |
|---|---|
| CZT HV Monitor | 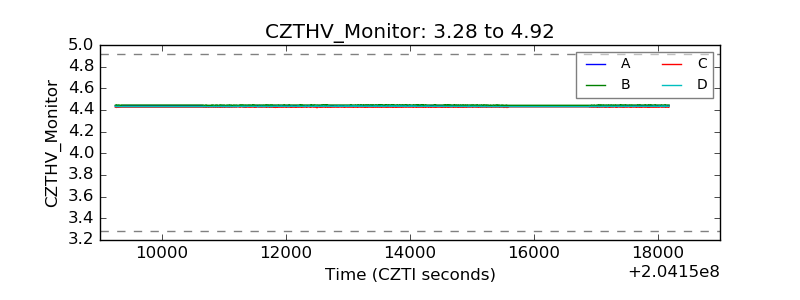 |
| D_VDD | 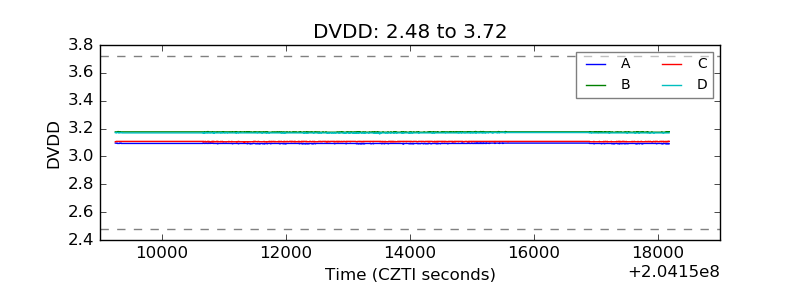 |
| Temperature 1 | 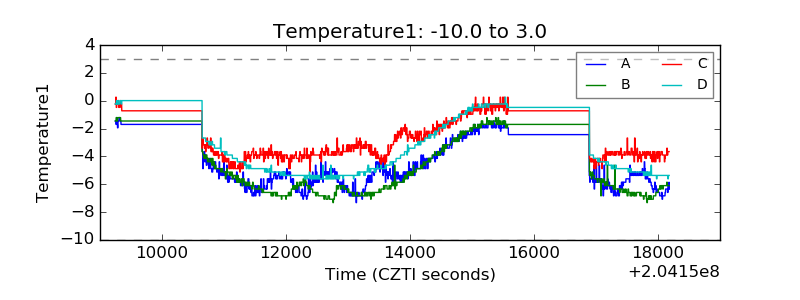 |
| Veto HV Monitor | 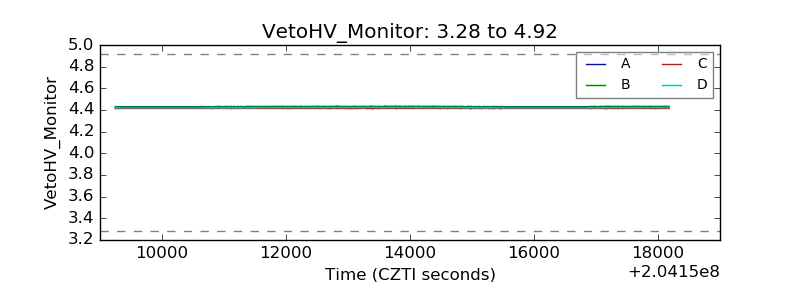 |
| Veto LLD | 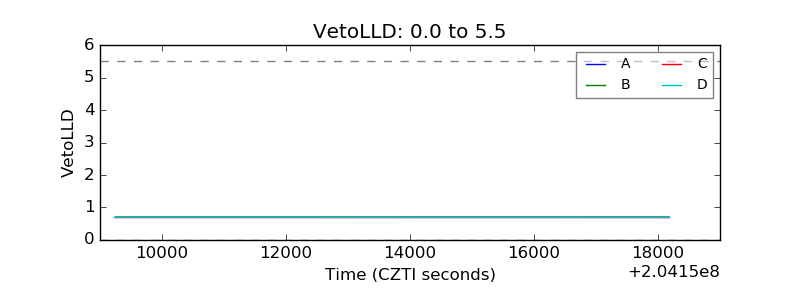 |
| Alpha Counter | 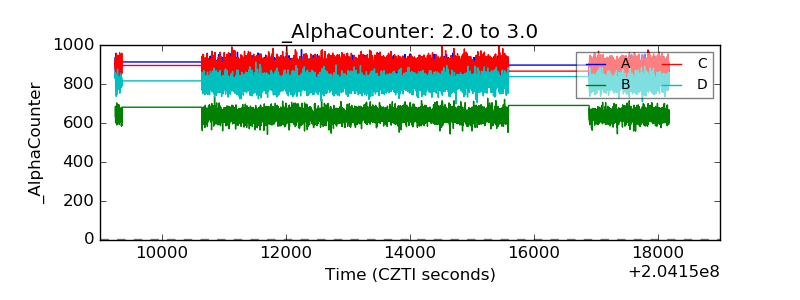 |
| _CPM_Rate | 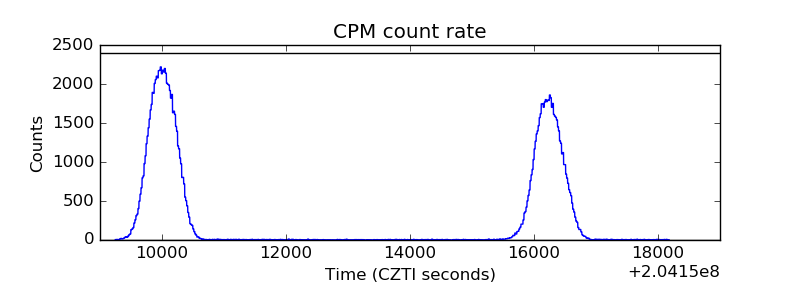 |
| CZT Counter | 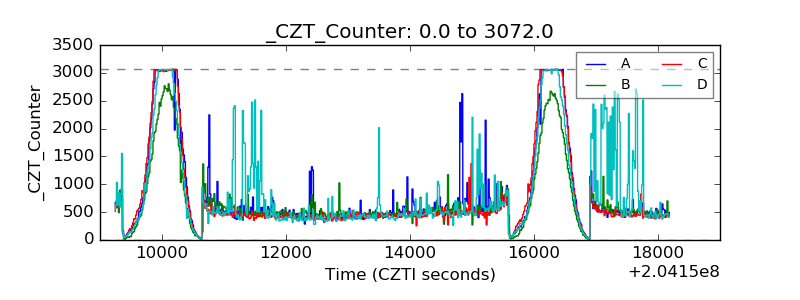 |
| +2.5 Volts monitor |  |
| +5 Volts monitor |  |
| _ROLL_ROT | 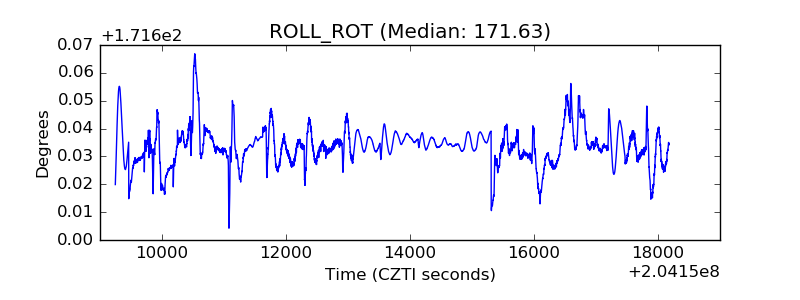 |
| _Roll_DEC | 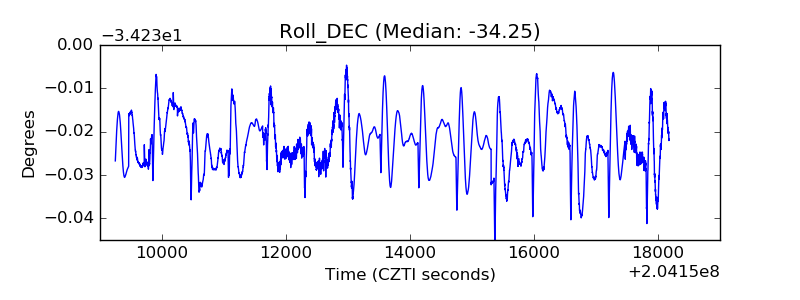 |
| _Roll_RA | 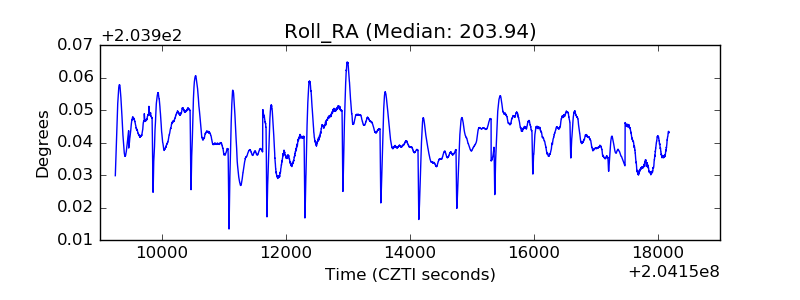 |
| Veto Counter | 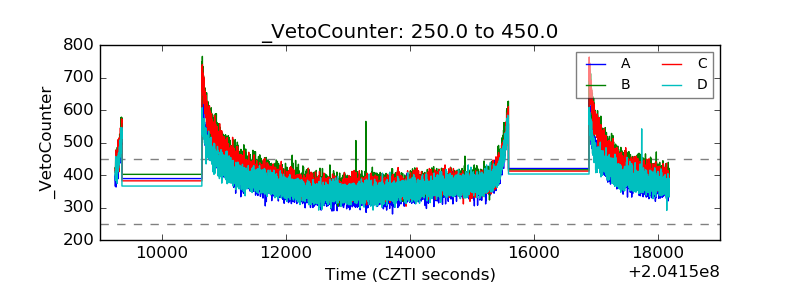 |