| Param | Original file | Final file |
|---|---|---|
| Filename | modeM0/AS1G05_246T02_9000000504_03954cztM0_level2.evt | modeM0/AS1G05_246T02_9000000504_03954cztM0_level2_quad_clean.evt |
| Size (bytes) | 478,762,560 | 61,375,680 |
| Size | 456.6 MB | 58.5 MB |
| Events in quadrant A | 3,779,738 | 347,182 |
| Events in quadrant B | 3,470,743 | 348,177 |
| Events in quadrant C | 3,086,020 | 345,069 |
| Events in quadrant D | 3,692,475 | 335,050 |
| Mode M0 | |||
|---|---|---|---|
| Quadrant | BADHDUFLAG | Total packets | Discarded packets |
| A | 0 | 15600 | 2 |
| B | 0 | 14737 | 1 |
| C | 0 | 14143 | 1 |
| D | 0 | 15983 | 1 |
| Mode M9 | |||
|---|---|---|---|
| Quadrant | BADHDUFLAG | Total packets | Discarded packets |
| A | 0 | 8 | 0 |
| B | 0 | 8 | 0 |
| C | 0 | 8 | 0 |
| D | 0 | 8 | 0 |
| Mode SS | |||
|---|---|---|---|
| Quadrant | BADHDUFLAG | Total packets | Discarded packets |
| A | 0 | 140 | 0 |
| B | 0 | 140 | 0 |
| C | 0 | 140 | 0 |
| D | 0 | 140 | 0 |
| Quadrant | Total seconds | Saturated seconds | Saturation percentage |
|---|---|---|---|
| A | 6928 | 93 | 1.342379% |
| B | 6928 | 64 | 0.923788% |
| C | 6928 | 48 | 0.692841% |
| D | 6928 | 81 | 1.169169% |
Noise dominated data is calculated using 1-second bins in cleaned event files. If a bin has >2000 counts, and if more than 50% of those come from <1% of pixels, then it is considered to be noise-dominated and hence unusable.
| Quadrant | # 1 sec bins | Bins with >0 counts | Bins with >2000 counts | High rate bins dominated by noise | Noise dominated (total time) | Noise dominated (detector-on time) | Marked lightcurve |
|---|---|---|---|---|---|---|---|
| A | 7738 | 6929 | 18 | 18 | 0.23% | 0.26% | 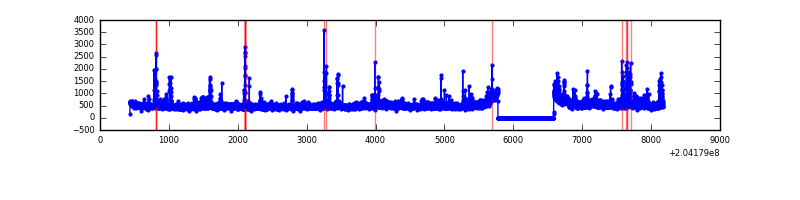 |
| B | 7738 | 6929 | 0 | 0 | 0.00% | 0.00% | 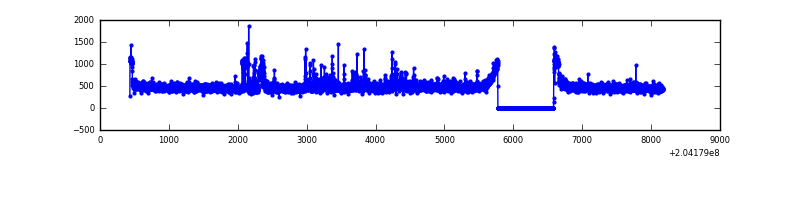 |
| C | 7738 | 6929 | 0 | 0 | 0.00% | 0.00% | 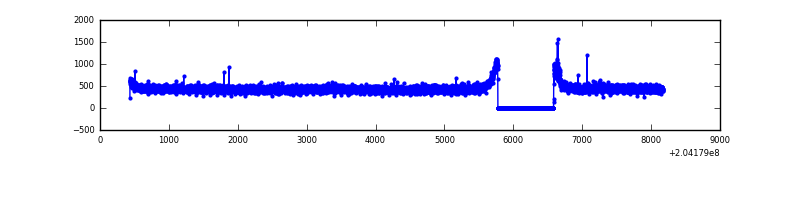 |
| D | 7738 | 6929 | 43 | 43 | 0.56% | 0.62% | 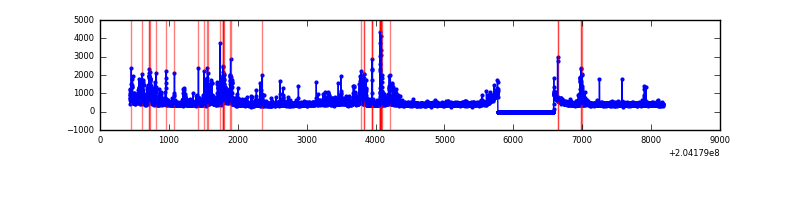 |
Top three noisy pixels from each quadrant. If the there are fewer than three noisy pixels in the level2.evt file, extra rows are filled as -1
| Pixel properties | Quadrant properties | ||||||
|---|---|---|---|---|---|---|---|
| Quadrant | DetID | PixID | Counts | Sigma | Mean | Median | Sigma |
| A | 8 | 15 | 235903 | 1414.82 | 806 | 788 | 166.2 |
| A | 0 | 118 | 205456 | 1231.61 | 806 | 788 | 166.2 |
| A | 0 | 199 | 140093 | 838.28 | 806 | 788 | 166.2 |
| B | 3 | 0 | 149761 | 940.82 | 817 | 799 | 158.3 |
| B | 4 | 81 | 72666 | 453.9 | 817 | 799 | 158.3 |
| B | 5 | 184 | 37260 | 230.28 | 817 | 799 | 158.3 |
| C | 1 | 16 | 19669 | 101.47 | 785 | 787 | 186.1 |
| C | 13 | 61 | 6791 | 32.26 | 785 | 787 | 186.1 |
| C | 3 | 202 | 1891 | 5.93 | 785 | 787 | 186.1 |
| D | 12 | 233 | 221334 | 1174.63 | 775 | 752 | 187.8 |
| D | 10 | 246 | 168801 | 894.88 | 775 | 752 | 187.8 |
| D | 1 | 7 | 109598 | 579.62 | 775 | 752 | 187.8 |
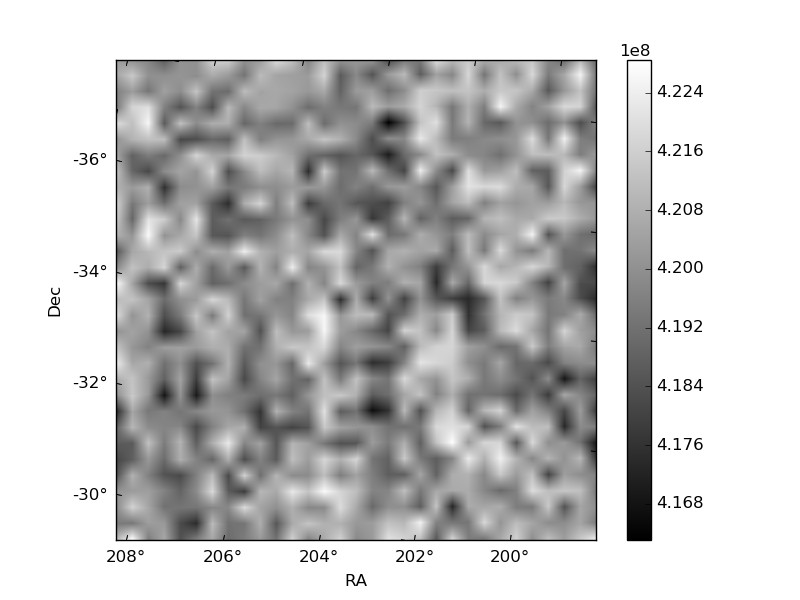
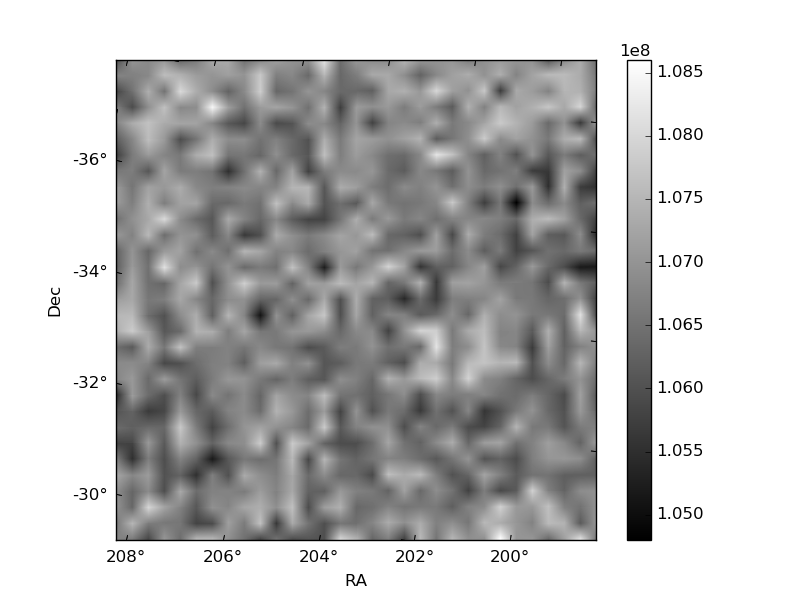
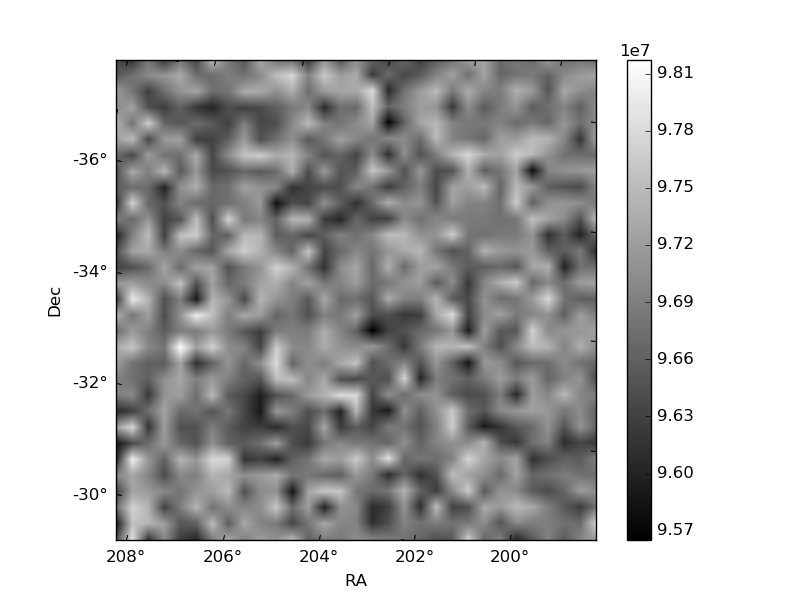
Histogram calculated using DETX and DETY for each event in the final _common_clean file
| Quadrant A |  |
 |
Quadrant B |
|---|---|---|---|
| Quadrant D |  |
 |
Quadrant C |
| Plot type | Count rate plots | Images |
|---|---|---|
| Comparison with Poisson distribution Blue bars denote a histogram of data divided into 1 sec bins. Red curve is a Poisson curve with rate = median count rate of data. |
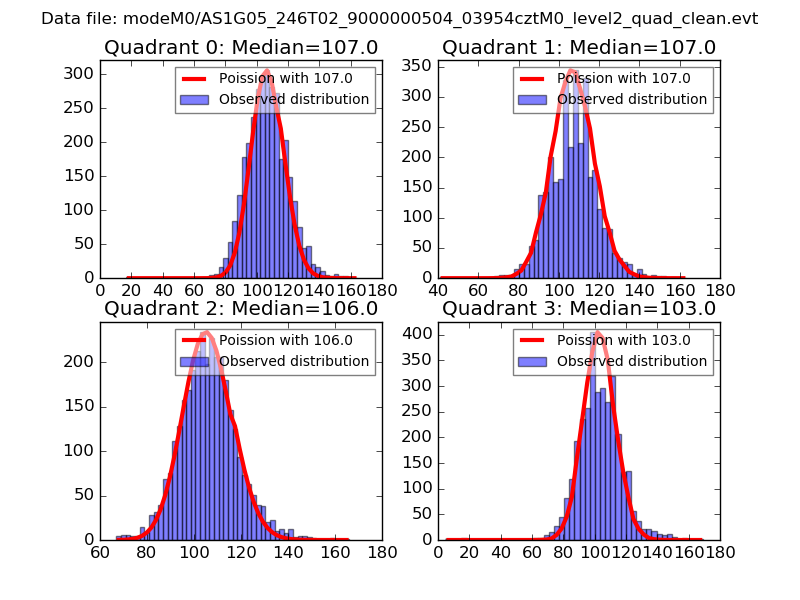 |
 |
| Quadrant-wise count rates Data is divided into 100 sec bins |
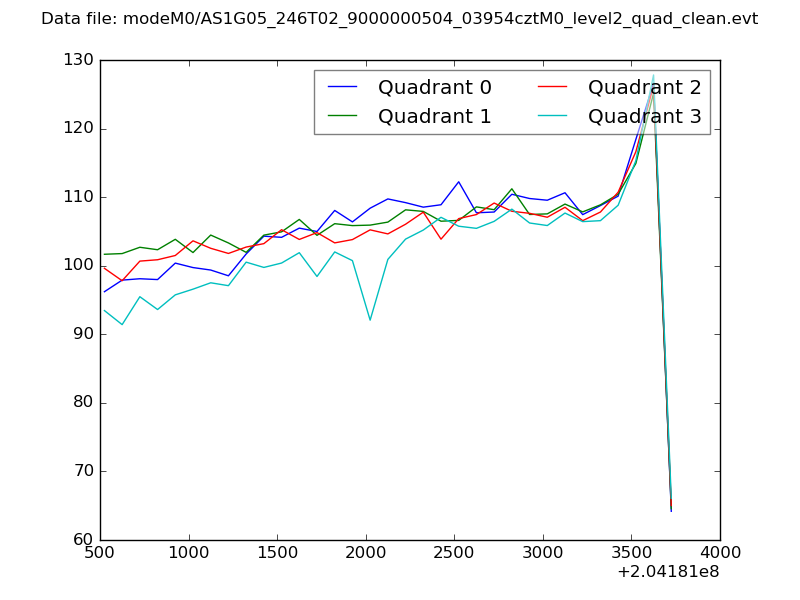 |
|
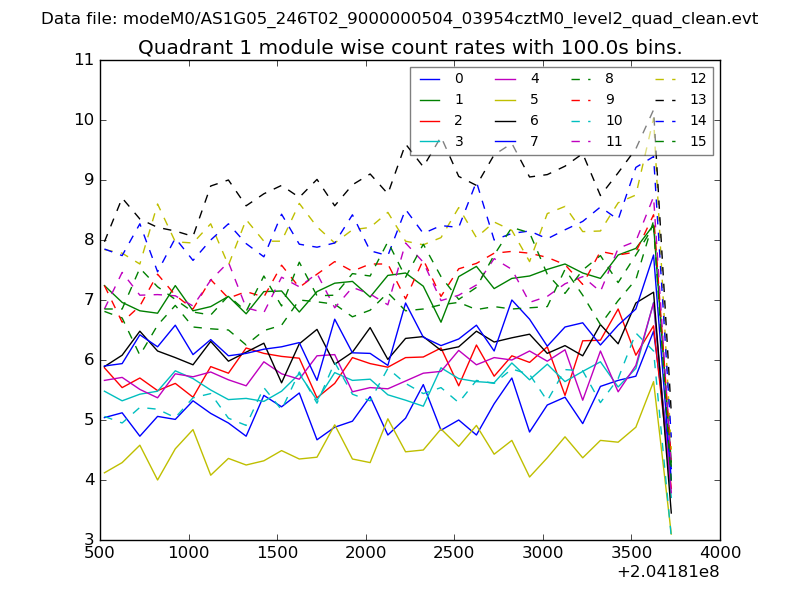
| Module-wise count rates for Quadrant A Data is divided into 100 sec bins |
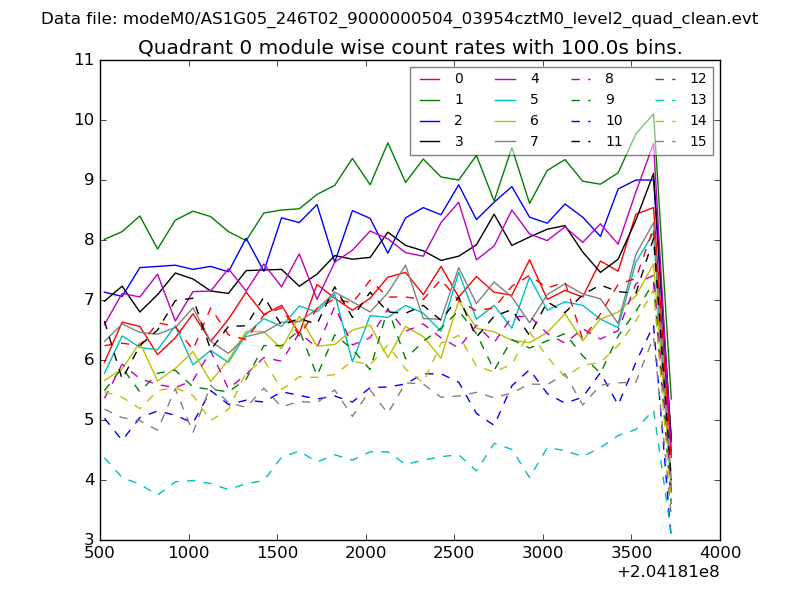 |
 |
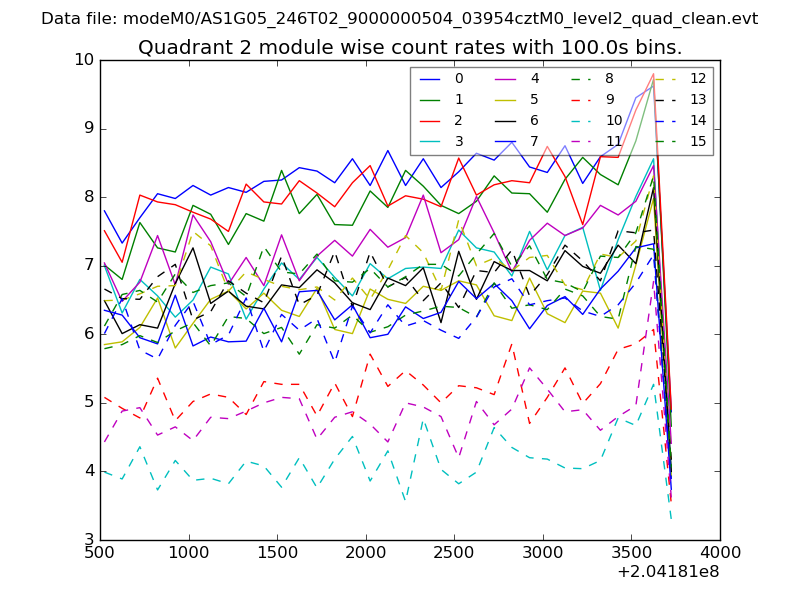
| Module-wise count rates for Quadrant B Data is divided into 100 sec bins |
 |
 |
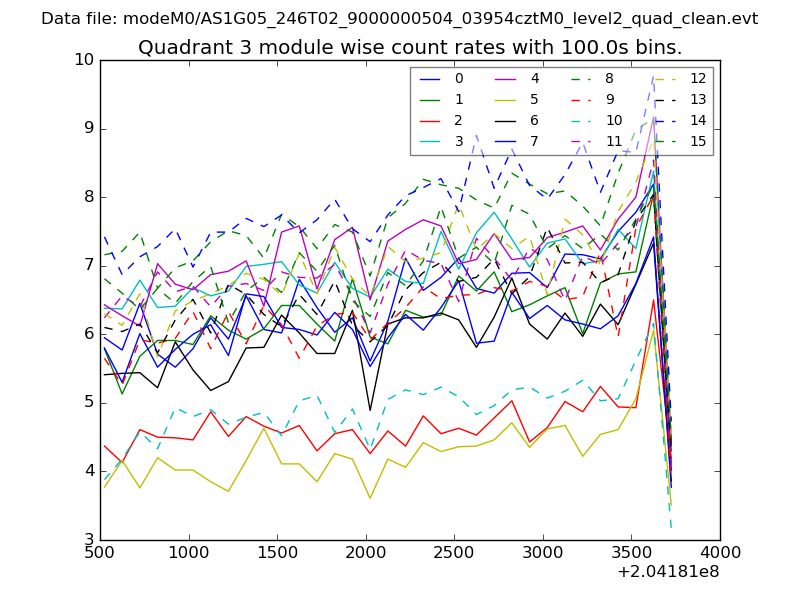
| Module-wise count rates for Quadrant C Data is divided into 100 sec bins |
 |
 |
| Module-wise count rates for Quadrant D Data is divided into 100 sec bins |
 |
 |
| Parameter | Plot |
|---|---|
| CZT HV Monitor | 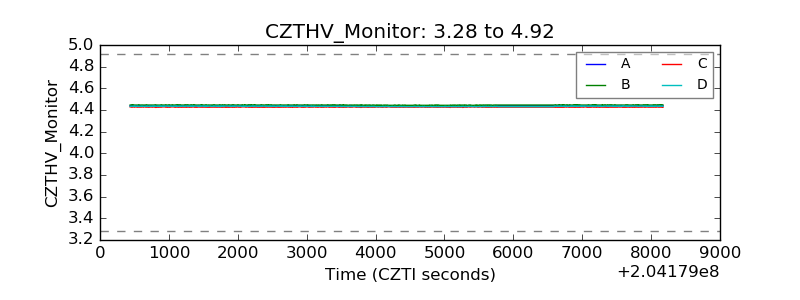 |
| D_VDD | 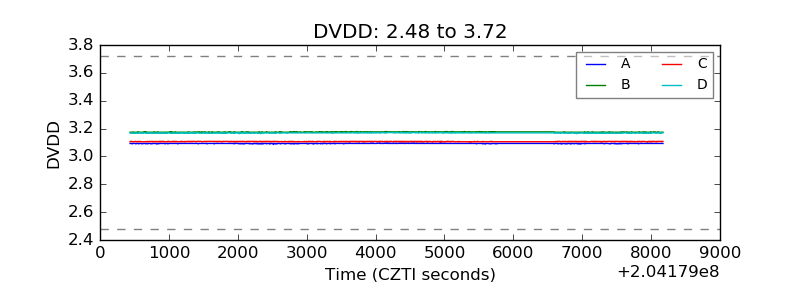 |
| Temperature 1 | 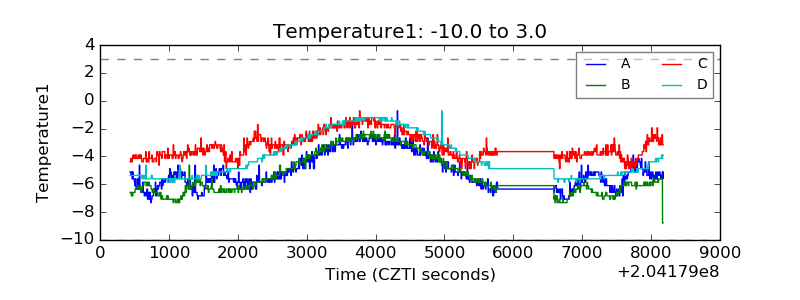 |
| Veto HV Monitor | 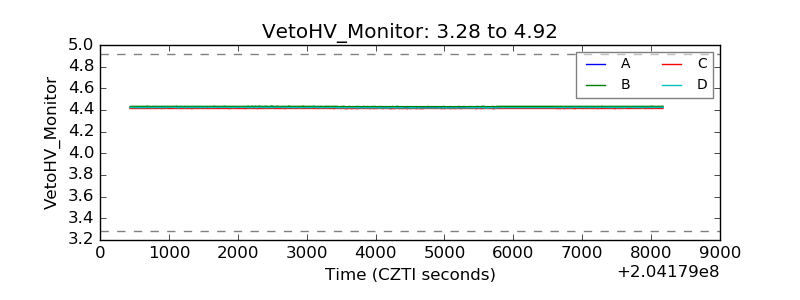 |
| Veto LLD | 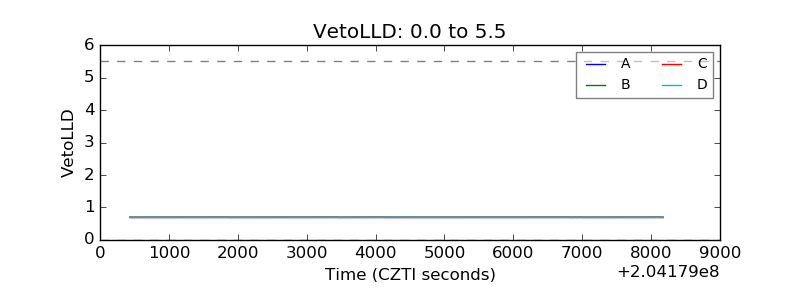 |
| Alpha Counter | 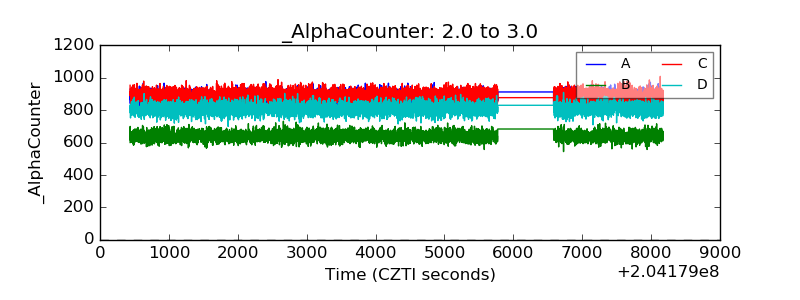 |
| _CPM_Rate | 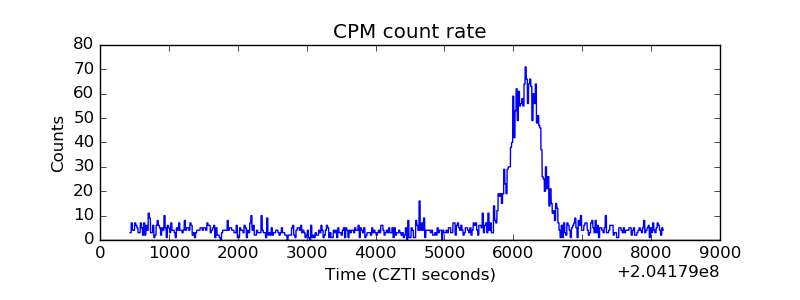 |
| CZT Counter |  |
| +2.5 Volts monitor |  |
| +5 Volts monitor |  |
| _ROLL_ROT | 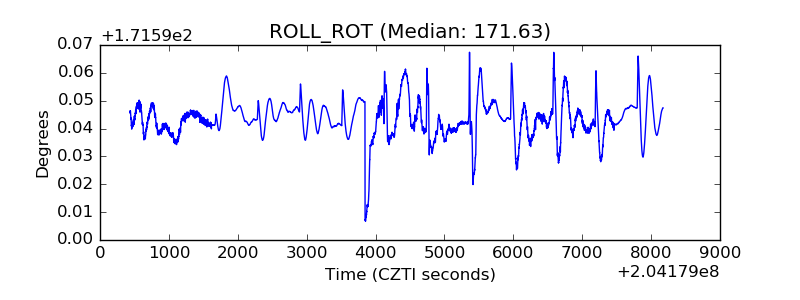 |
| _Roll_DEC |  |
| _Roll_RA |  |
| Veto Counter | 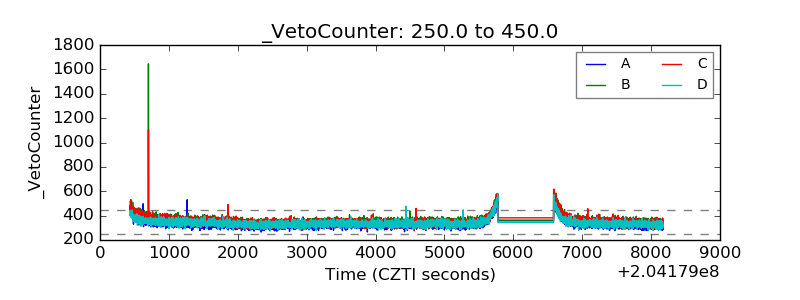 |