| Param | Original file | Final file |
|---|---|---|
| Filename | modeM0/AS1G05_246T02_9000000504_03955cztM0_level2.evt | modeM0/AS1G05_246T02_9000000504_03955cztM0_level2_quad_clean.evt |
| Size (bytes) | 544,178,880 | 68,086,080 |
| Size | 519.0 MB | 64.9 MB |
| Events in quadrant A | 5,087,314 | 389,142 |
| Events in quadrant B | 3,709,341 | 391,141 |
| Events in quadrant C | 3,351,296 | 388,595 |
| Events in quadrant D | 3,828,649 | 375,968 |
| Mode M0 | |||
|---|---|---|---|
| Quadrant | BADHDUFLAG | Total packets | Discarded packets |
| A | 0 | 20145 | 2 |
| B | 0 | 15749 | 1 |
| C | 0 | 15337 | 1 |
| D | 0 | 16877 | 1 |
| Mode M9 | |||
|---|---|---|---|
| Quadrant | BADHDUFLAG | Total packets | Discarded packets |
| A | 0 | 3 | 0 |
| B | 0 | 3 | 0 |
| C | 0 | 3 | 0 |
| D | 0 | 3 | 0 |
| Mode SS | |||
|---|---|---|---|
| Quadrant | BADHDUFLAG | Total packets | Discarded packets |
| A | 0 | 150 | 0 |
| B | 0 | 150 | 0 |
| C | 0 | 150 | 0 |
| D | 0 | 150 | 0 |
| Quadrant | Total seconds | Saturated seconds | Saturation percentage |
|---|---|---|---|
| A | 7425 | 306 | 4.121212% |
| B | 7425 | 163 | 2.195286% |
| C | 7425 | 128 | 1.723906% |
| D | 7425 | 205 | 2.760943% |
Noise dominated data is calculated using 1-second bins in cleaned event files. If a bin has >2000 counts, and if more than 50% of those come from <1% of pixels, then it is considered to be noise-dominated and hence unusable.
| Quadrant | # 1 sec bins | Bins with >0 counts | Bins with >2000 counts | High rate bins dominated by noise | Noise dominated (total time) | Noise dominated (detector-on time) | Marked lightcurve |
|---|---|---|---|---|---|---|---|
| A | 7725 | 7426 | 53 | 53 | 0.69% | 0.71% | 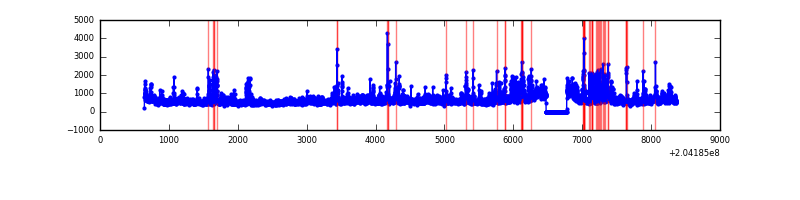 |
| B | 7725 | 7426 | 8 | 8 | 0.10% | 0.11% | 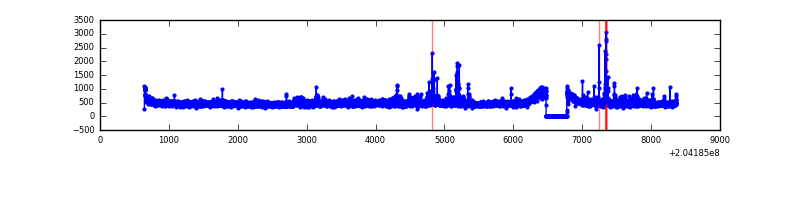 |
| C | 7725 | 7426 | 1 | 1 | 0.01% | 0.01% | 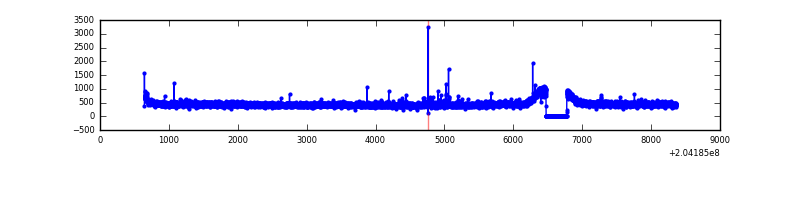 |
| D | 7725 | 7426 | 77 | 77 | 1.00% | 1.04% | 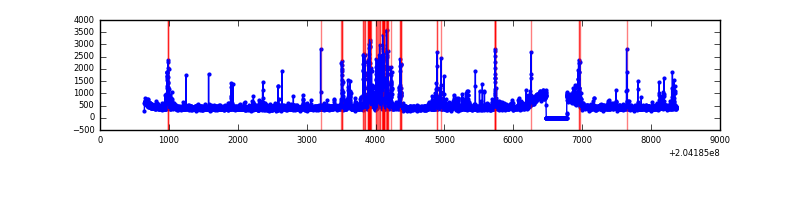 |
Top three noisy pixels from each quadrant. If the there are fewer than three noisy pixels in the level2.evt file, extra rows are filled as -1
| Pixel properties | Quadrant properties | ||||||
|---|---|---|---|---|---|---|---|
| Quadrant | DetID | PixID | Counts | Sigma | Mean | Median | Sigma |
| A | 8 | 15 | 689363 | 3862.8 | 863 | 846 | 178.2 |
| A | 0 | 199 | 490437 | 2746.76 | 863 | 846 | 178.2 |
| A | 0 | 118 | 329143 | 1841.85 | 863 | 846 | 178.2 |
| B | 4 | 81 | 118634 | 684.51 | 881 | 861 | 172.1 |
| B | 15 | 204 | 82719 | 475.77 | 881 | 861 | 172.1 |
| B | 3 | 0 | 61428 | 352.02 | 881 | 861 | 172.1 |
| C | 1 | 16 | 38850 | 191.3 | 847 | 850 | 198.6 |
| C | 13 | 61 | 7188 | 31.91 | 847 | 850 | 198.6 |
| C | 7 | 247 | 2219 | 6.89 | 847 | 850 | 198.6 |
| D | 2 | 232 | 267937 | 1321.9 | 837 | 812 | 202.1 |
| D | 2 | 63 | 179413 | 883.83 | 837 | 812 | 202.1 |
| D | 13 | 239 | 115571 | 567.9 | 837 | 812 | 202.1 |
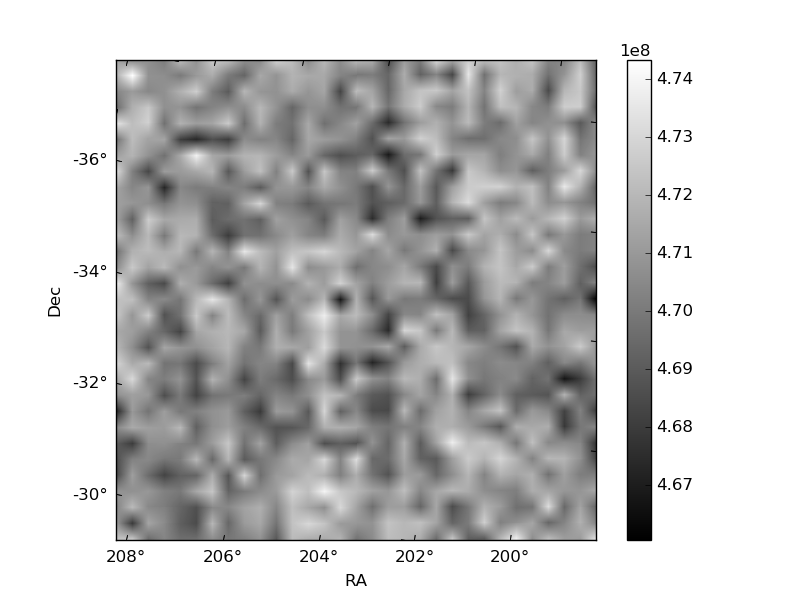
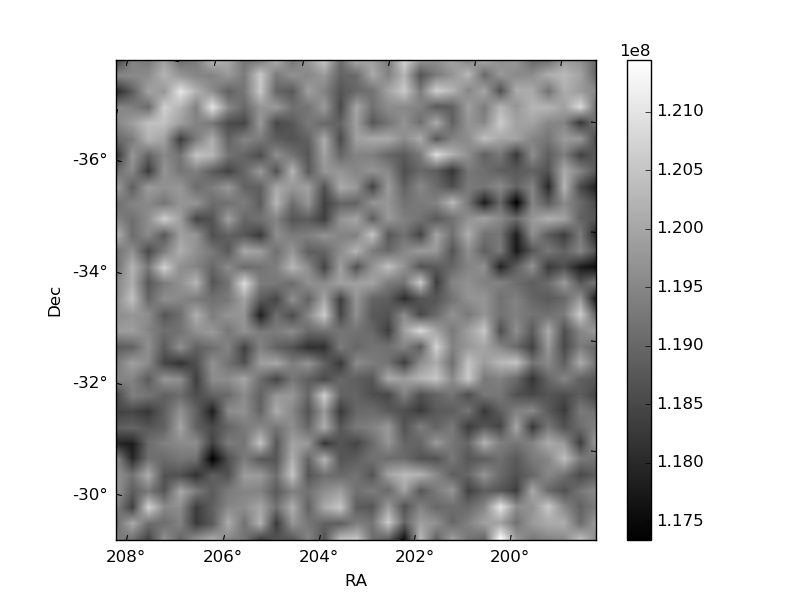
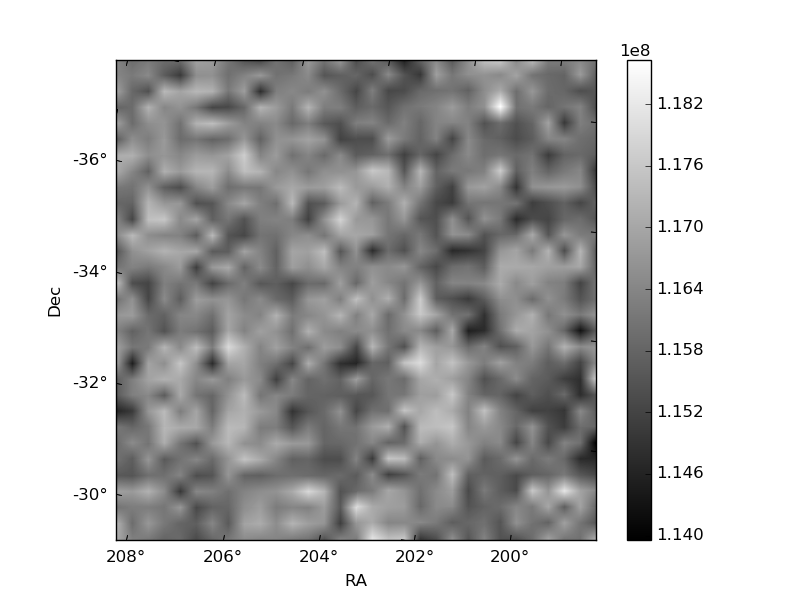
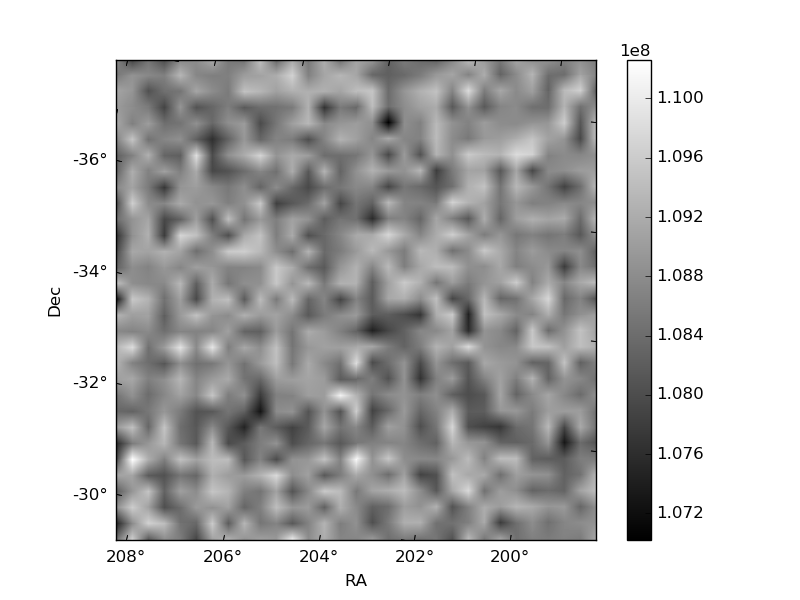
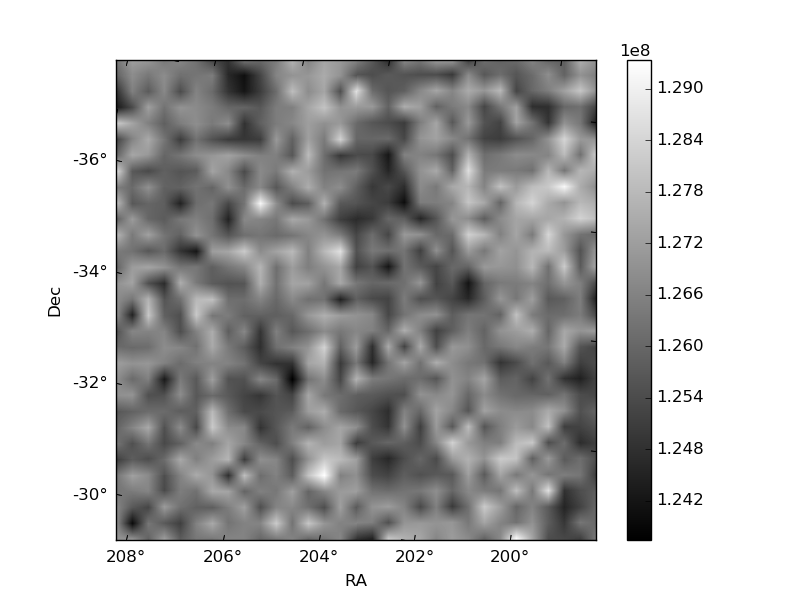
Histogram calculated using DETX and DETY for each event in the final _common_clean file
| Quadrant A | 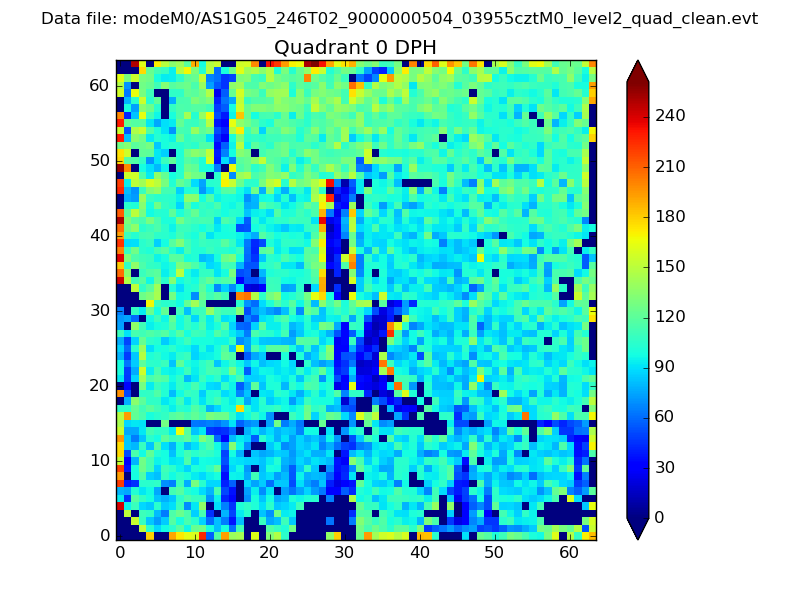 |
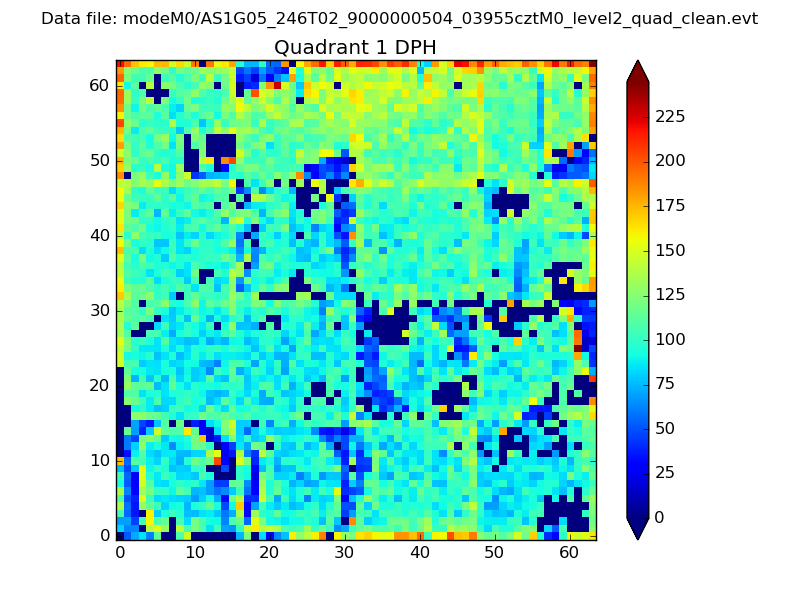 |
Quadrant B |
|---|---|---|---|
| Quadrant D | 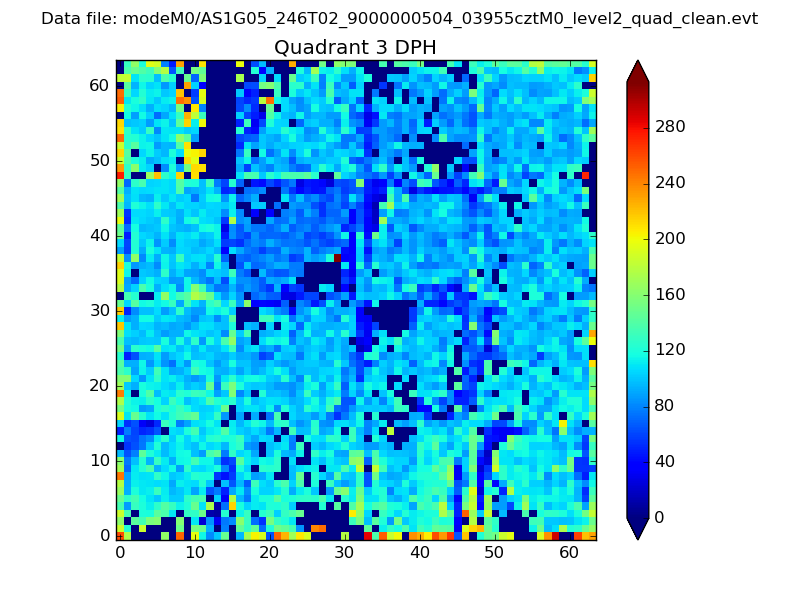 |
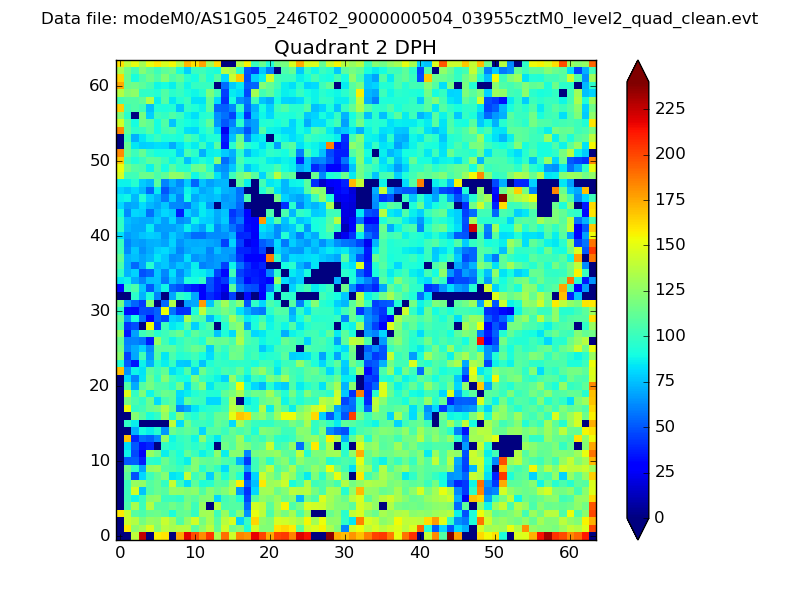 |
Quadrant C |
| Plot type | Count rate plots | Images |
|---|---|---|
| Comparison with Poisson distribution Blue bars denote a histogram of data divided into 1 sec bins. Red curve is a Poisson curve with rate = median count rate of data. |
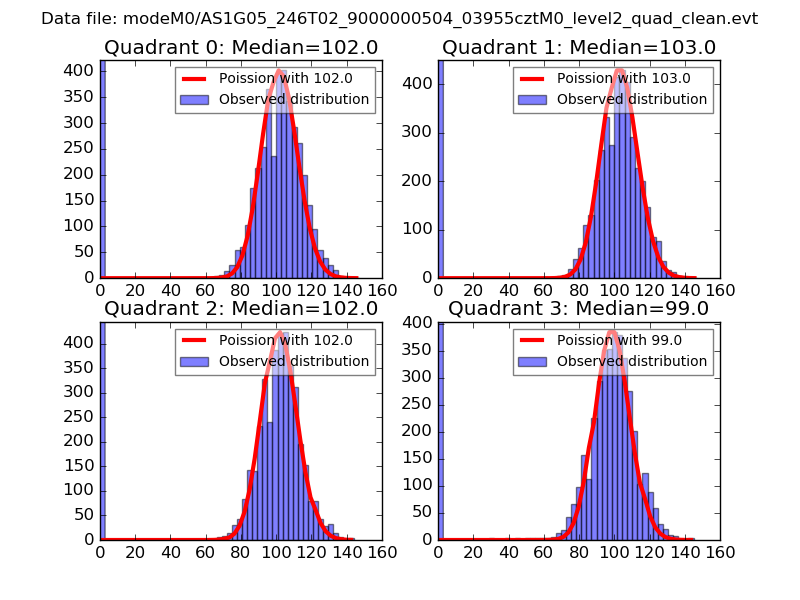 |
 |
| Quadrant-wise count rates Data is divided into 100 sec bins |
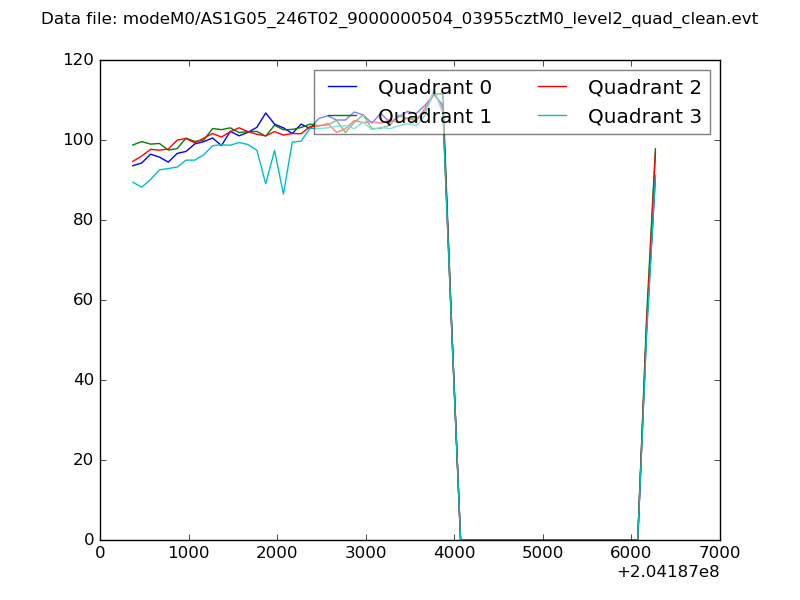 |
|
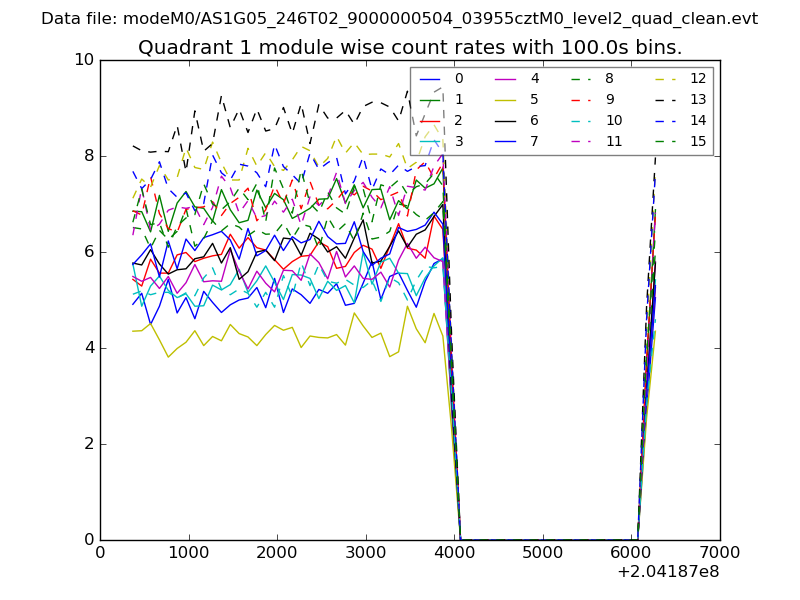
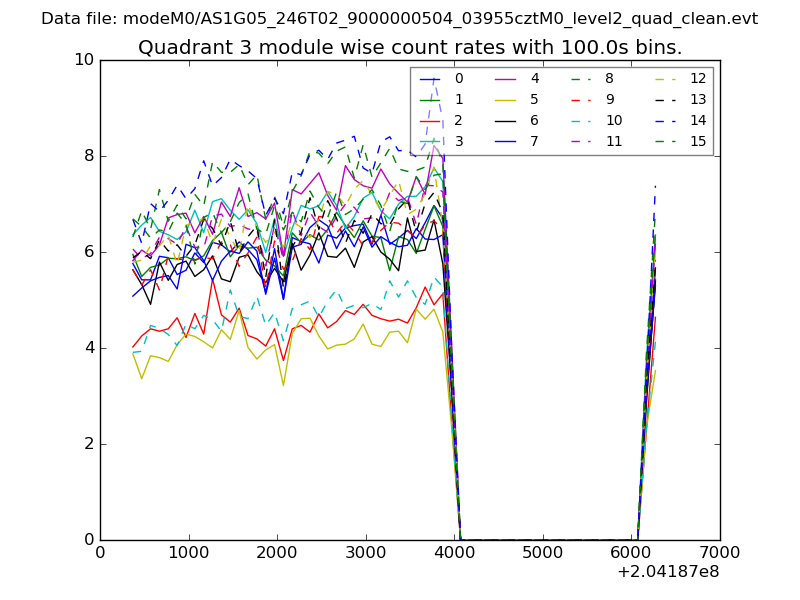
| Module-wise count rates for Quadrant A Data is divided into 100 sec bins |
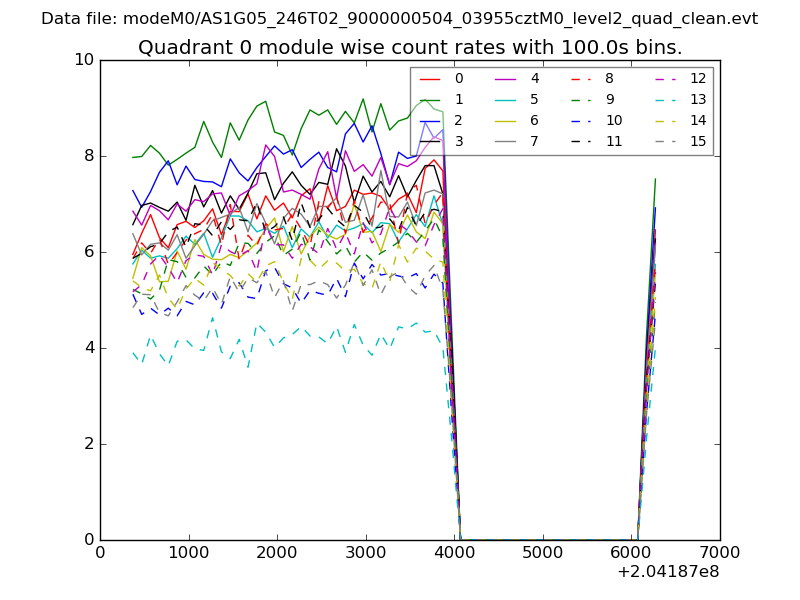 |
 |
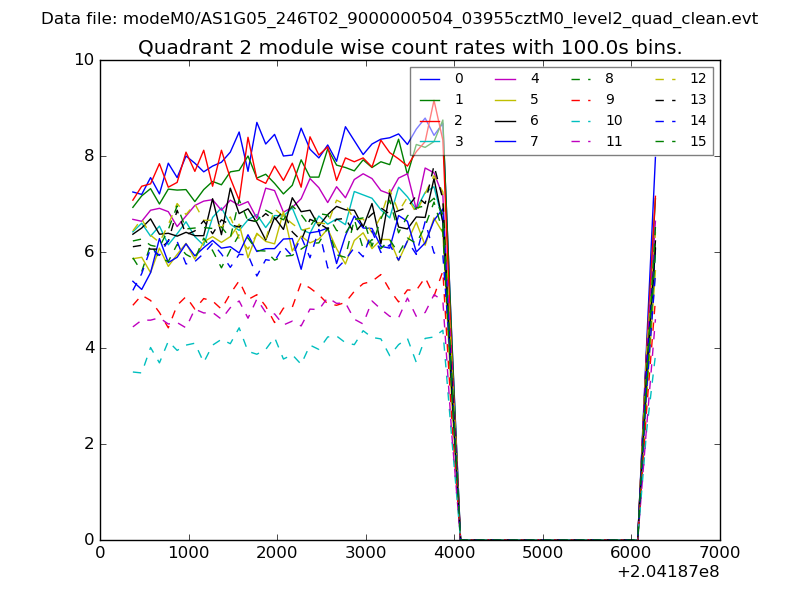
| Module-wise count rates for Quadrant B Data is divided into 100 sec bins |
 |
 |
| Module-wise count rates for Quadrant C Data is divided into 100 sec bins |
 |
 |
| Module-wise count rates for Quadrant D Data is divided into 100 sec bins |
 |
 |
| Parameter | Plot |
|---|---|
| CZT HV Monitor | 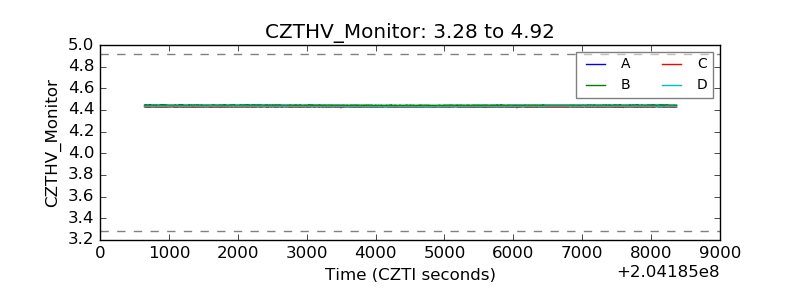 |
| D_VDD |  |
| Temperature 1 | 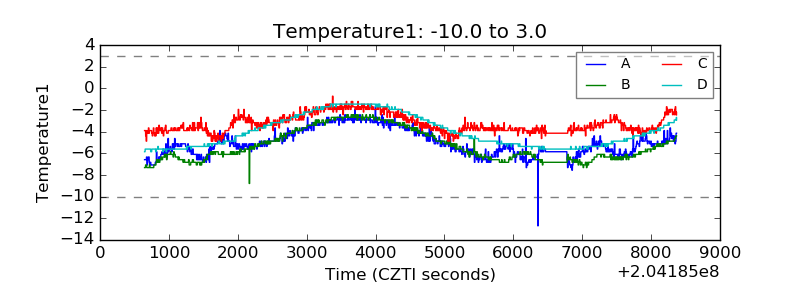 |
| Veto HV Monitor | 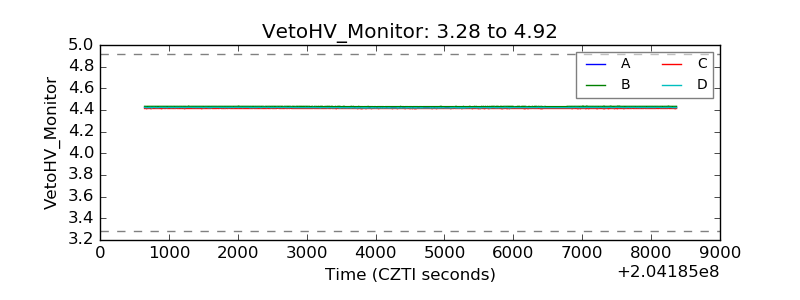 |
| Veto LLD | 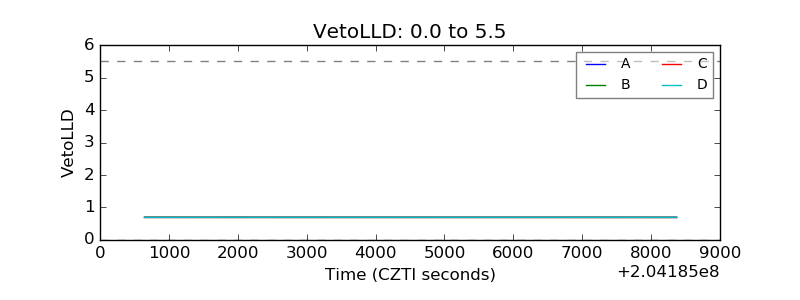 |
| Alpha Counter | 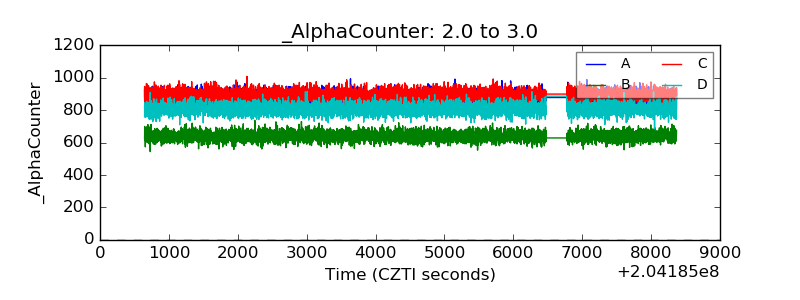 |
| _CPM_Rate | 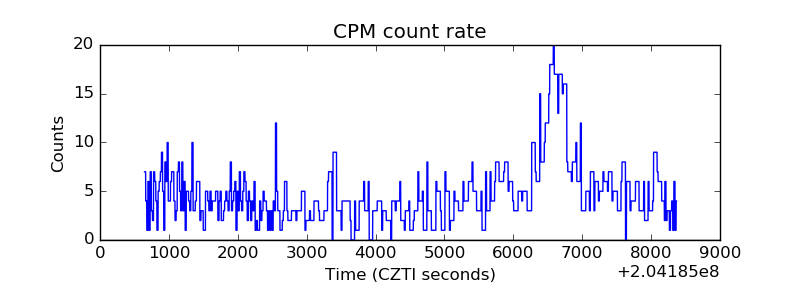 |
| CZT Counter | 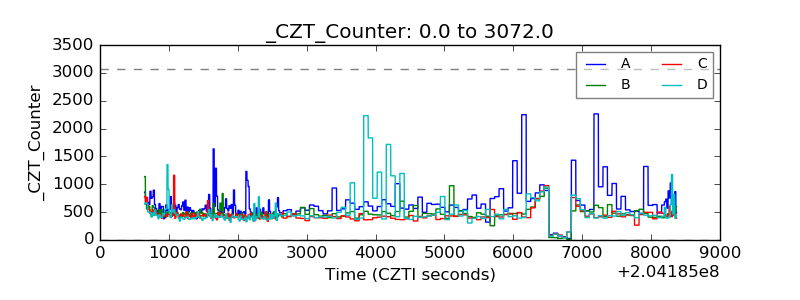 |
| +2.5 Volts monitor | 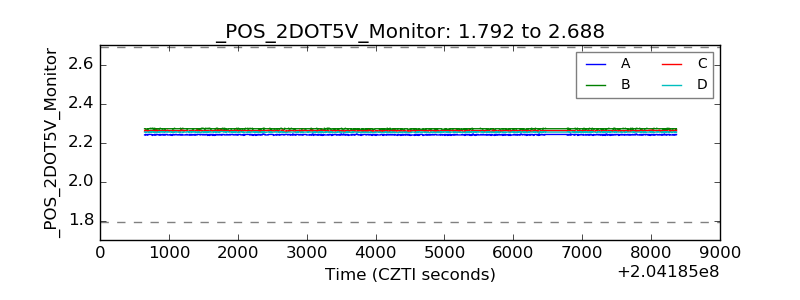 |
| +5 Volts monitor |  |
| _ROLL_ROT | 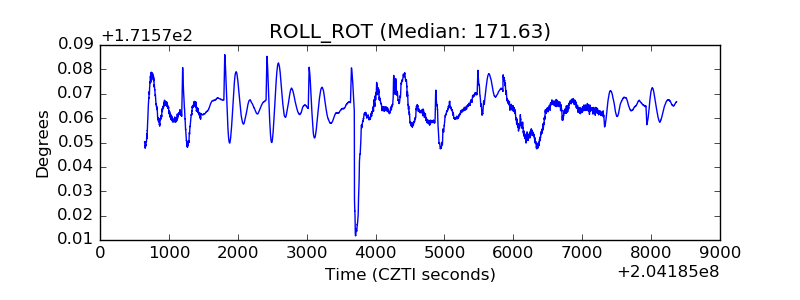 |
| _Roll_DEC | 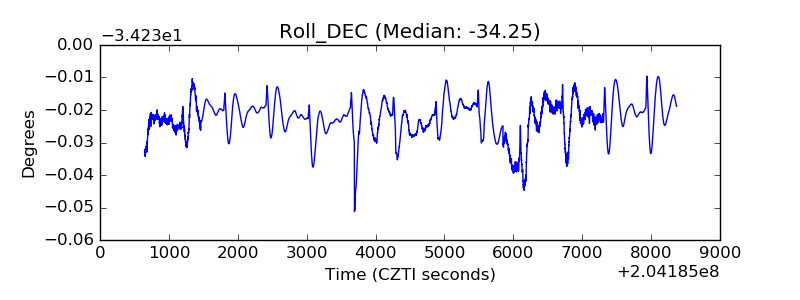 |
| _Roll_RA | 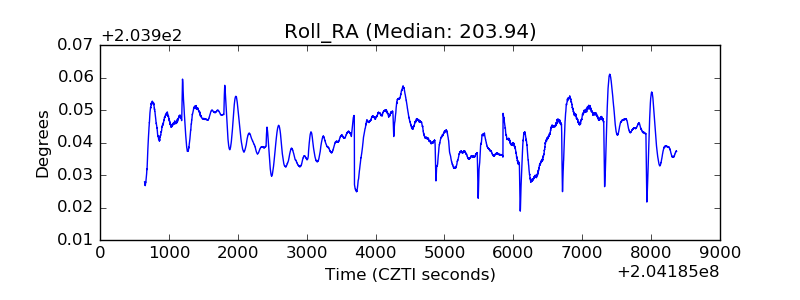 |
| Veto Counter | 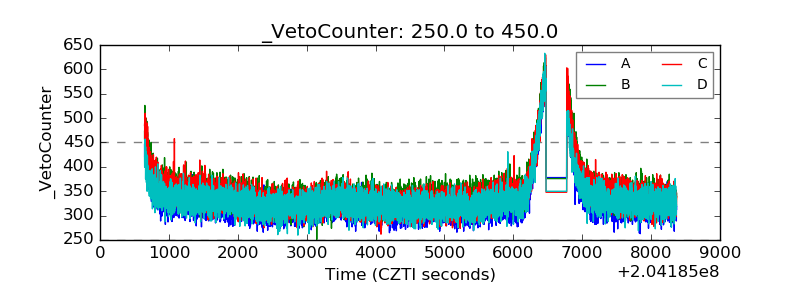 |