| Param | Original file | Final file |
|---|---|---|
| Filename | modeM0/AS1G05_246T02_9000000504_03956cztM0_level2.evt | modeM0/AS1G05_246T02_9000000504_03956cztM0_level2_quad_clean.evt |
| Size (bytes) | 566,697,600 | 75,205,440 |
| Size | 540.4 MB | 71.7 MB |
| Events in quadrant A | 5,161,128 | 432,397 |
| Events in quadrant B | 3,938,542 | 436,932 |
| Events in quadrant C | 3,695,598 | 432,773 |
| Events in quadrant D | 3,826,338 | 421,262 |
| Mode M0 | |||
|---|---|---|---|
| Quadrant | BADHDUFLAG | Total packets | Discarded packets |
| A | 0 | 20446 | 2 |
| B | 0 | 16887 | 1 |
| C | 0 | 16709 | 3 |
| D | 0 | 17338 | 1 |
| Mode M9 | |||
|---|---|---|---|
| Quadrant | BADHDUFLAG | Total packets | Discarded packets |
| A | 1 | 224764499168 | 0 |
| B | 1 | -1 | -1 |
| C | 1 | -1 | -1 |
| D | 1 | -1 | -1 |
| Mode SS | |||
|---|---|---|---|
| Quadrant | BADHDUFLAG | Total packets | Discarded packets |
| A | 0 | 160 | 0 |
| B | 0 | 160 | 0 |
| C | 0 | 160 | 0 |
| D | 0 | 160 | 0 |
| Quadrant | Total seconds | Saturated seconds | Saturation percentage |
|---|---|---|---|
| A | 7965 | 432 | 5.423729% |
| B | 7965 | 320 | 4.017577% |
| C | 7964 | 230 | 2.887996% |
| D | 7965 | 256 | 3.214062% |
Noise dominated data is calculated using 1-second bins in cleaned event files. If a bin has >2000 counts, and if more than 50% of those come from <1% of pixels, then it is considered to be noise-dominated and hence unusable.
| Quadrant | # 1 sec bins | Bins with >0 counts | Bins with >2000 counts | High rate bins dominated by noise | Noise dominated (total time) | Noise dominated (detector-on time) | Marked lightcurve |
|---|---|---|---|---|---|---|---|
| A | 7965 | 7965 | 42 | 42 | 0.53% | 0.53% | 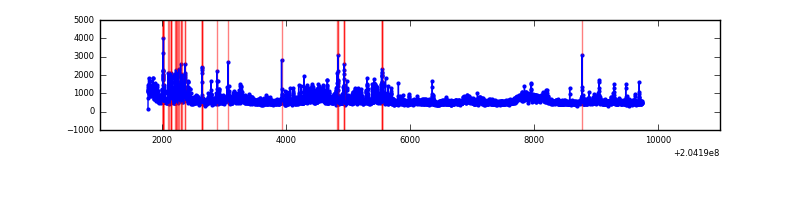 |
| B | 7965 | 7965 | 9 | 9 | 0.11% | 0.11% | 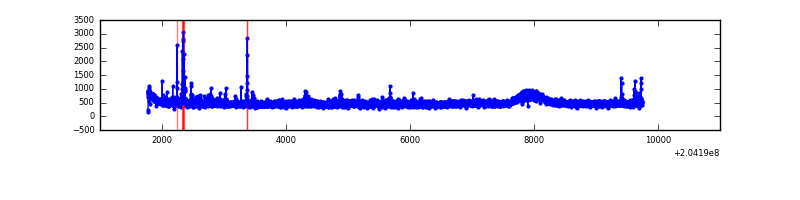 |
| C | 7965 | 7965 | 7 | 7 | 0.09% | 0.09% | 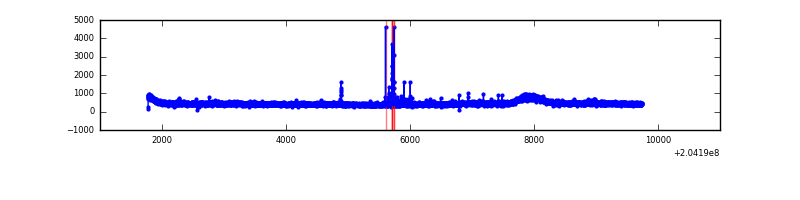 |
| D | 7965 | 7965 | 17 | 17 | 0.21% | 0.21% | 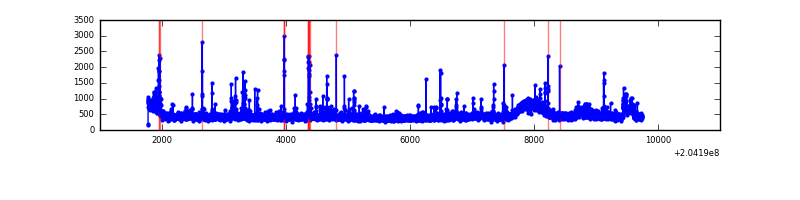 |
Top three noisy pixels from each quadrant. If the there are fewer than three noisy pixels in the level2.evt file, extra rows are filled as -1
| Pixel properties | Quadrant properties | ||||||
|---|---|---|---|---|---|---|---|
| Quadrant | DetID | PixID | Counts | Sigma | Mean | Median | Sigma |
| A | 8 | 15 | 746352 | 3823.27 | 939 | 914 | 195.0 |
| A | 0 | 118 | 400719 | 2050.55 | 939 | 914 | 195.0 |
| A | 0 | 199 | 185242 | 945.4 | 939 | 914 | 195.0 |
| B | 4 | 81 | 102885 | 548.56 | 956 | 930 | 185.9 |
| B | 15 | 204 | 95807 | 510.48 | 956 | 930 | 185.9 |
| B | 3 | 0 | 21814 | 112.36 | 956 | 930 | 185.9 |
| C | 1 | 16 | 75986 | 344.88 | 924 | 924 | 217.6 |
| C | 13 | 61 | 7924 | 32.16 | 924 | 924 | 217.6 |
| C | 2 | 37 | 3513 | 11.9 | 924 | 924 | 217.6 |
| D | 2 | 63 | 156474 | 691.68 | 919 | 889 | 224.9 |
| D | 13 | 239 | 88373 | 388.92 | 919 | 889 | 224.9 |
| D | 2 | 232 | 28186 | 121.35 | 919 | 889 | 224.9 |
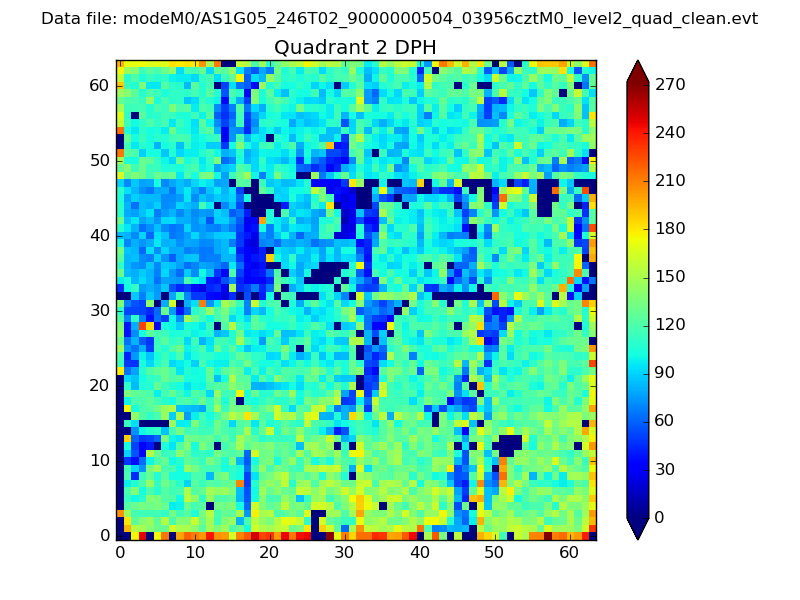
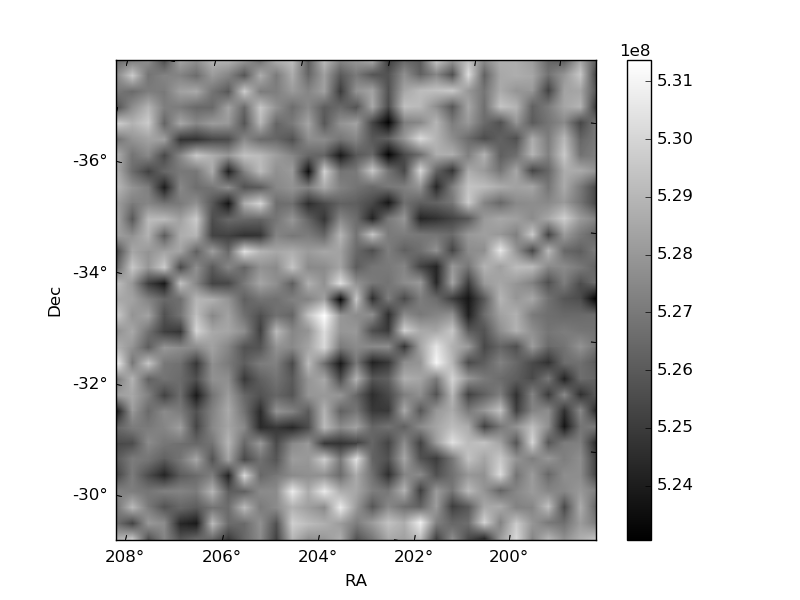
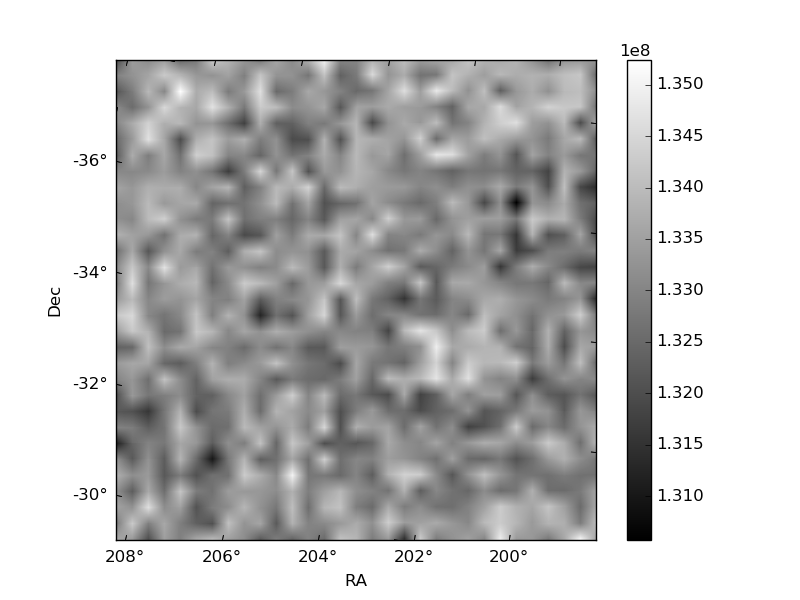
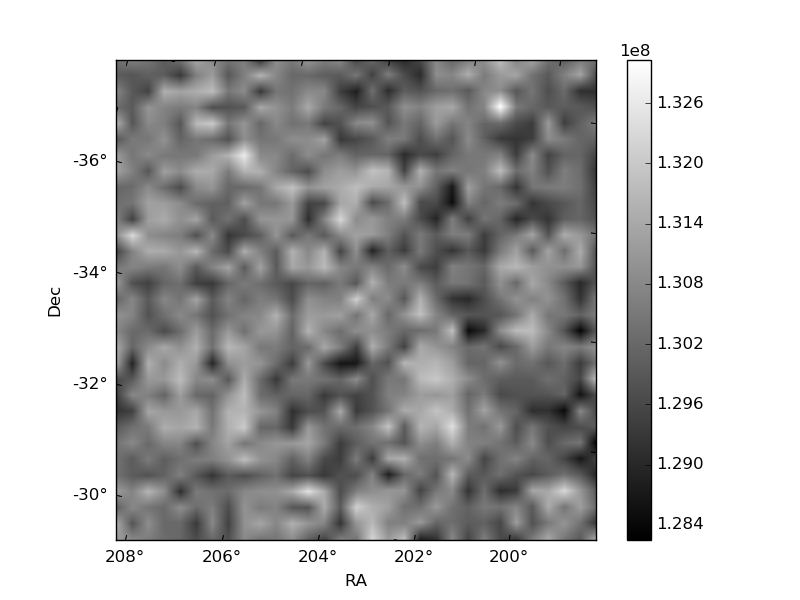
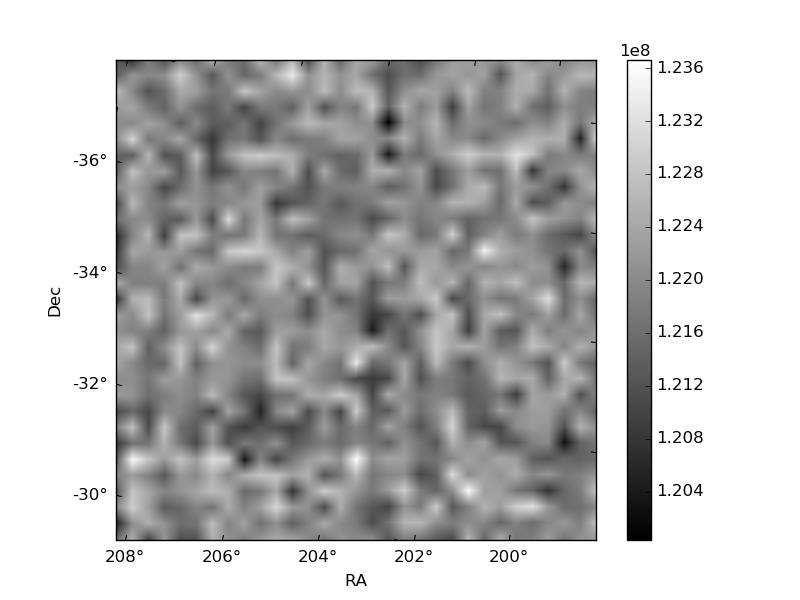
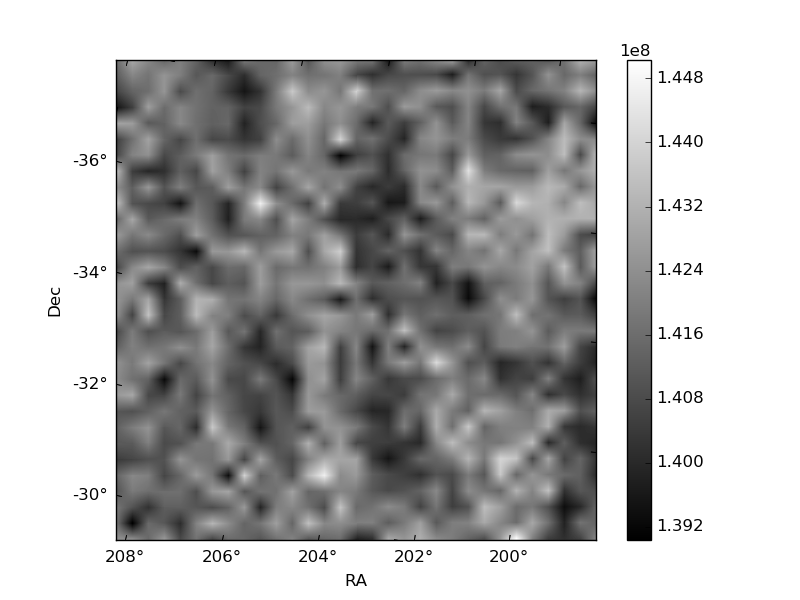
Histogram calculated using DETX and DETY for each event in the final _common_clean file
| Quadrant A | 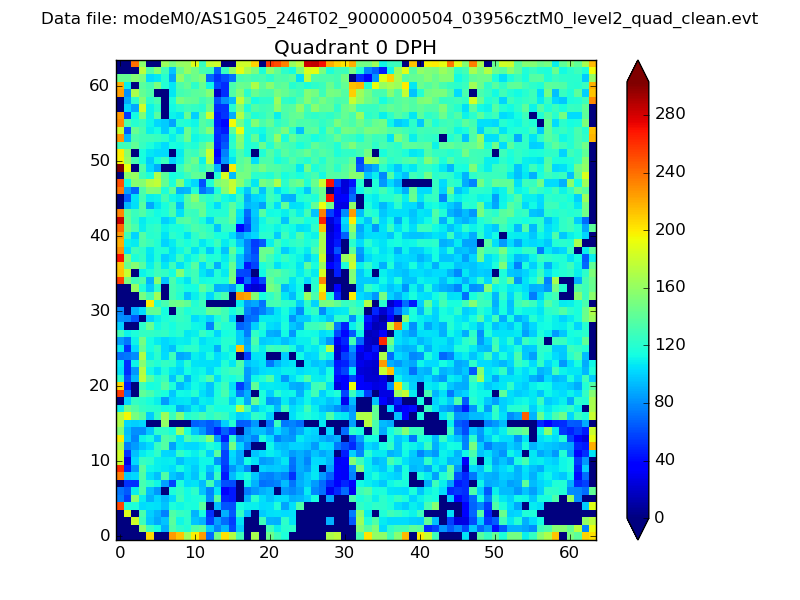 |
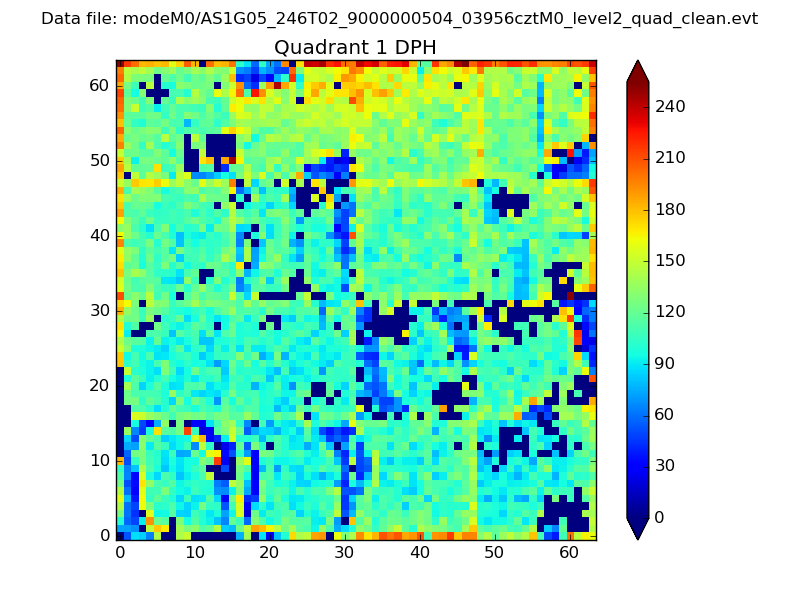 |
Quadrant B |
|---|---|---|---|
| Quadrant D | 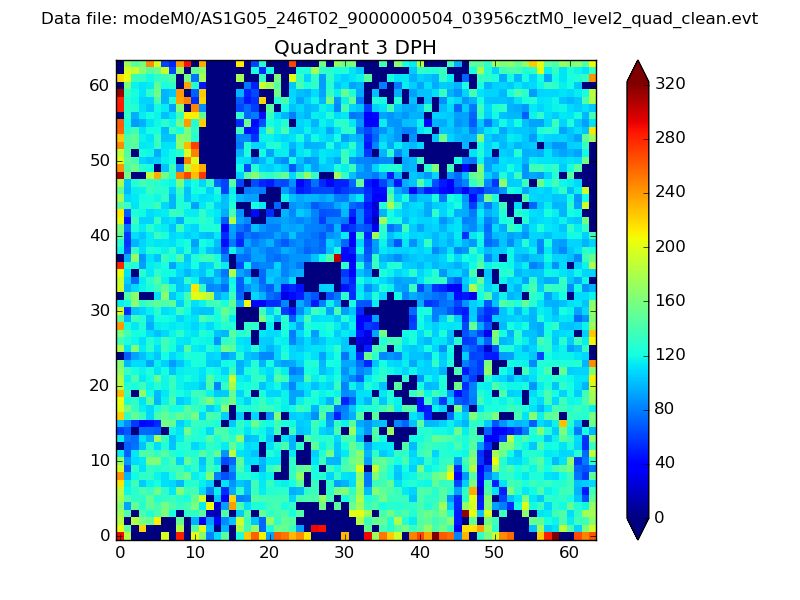 |
 |
Quadrant C |
| Plot type | Count rate plots | Images |
|---|---|---|
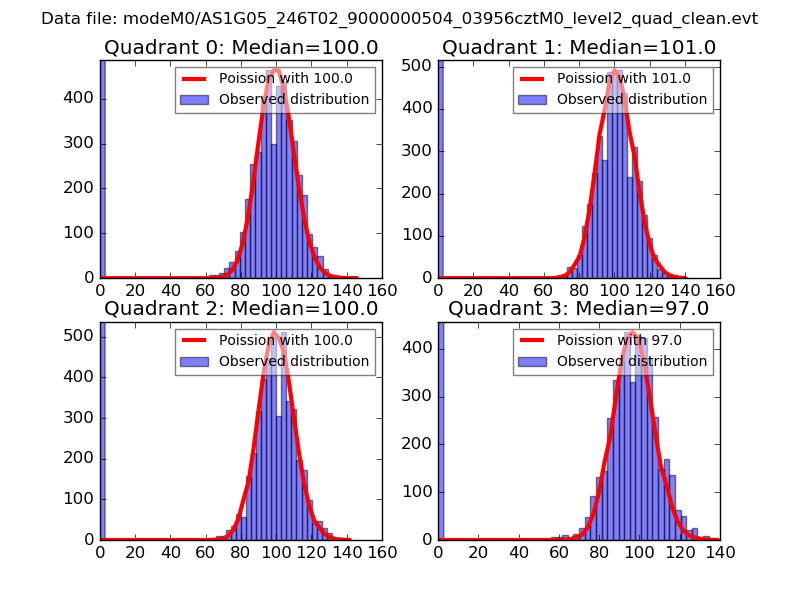
| Comparison with Poisson distribution Blue bars denote a histogram of data divided into 1 sec bins. Red curve is a Poisson curve with rate = median count rate of data. |
 |
 |
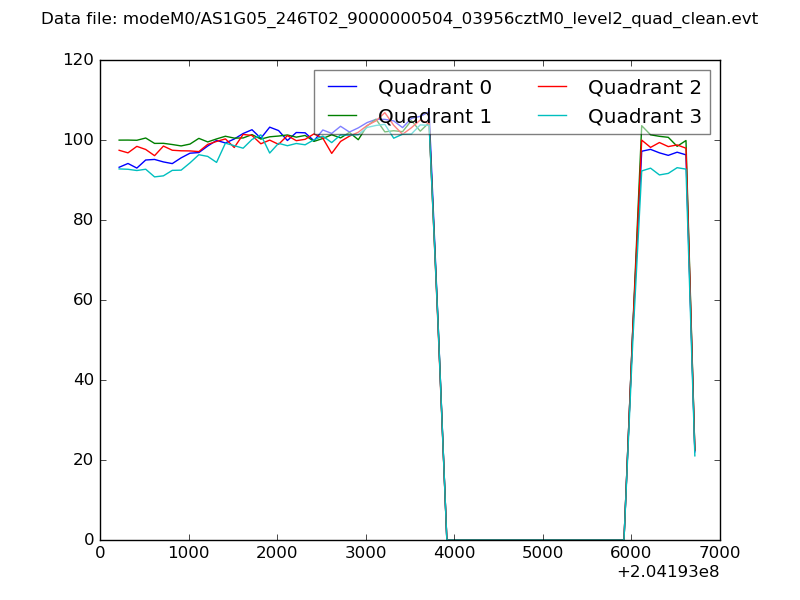
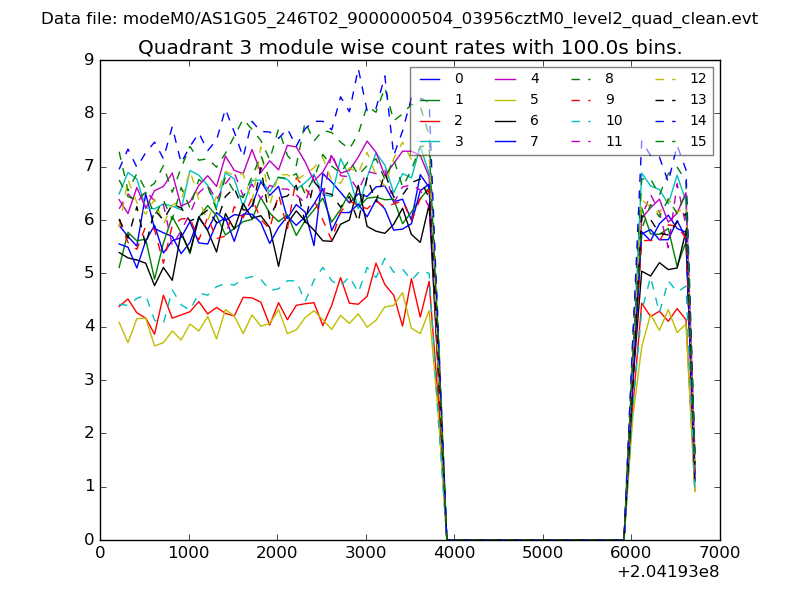
| Quadrant-wise count rates Data is divided into 100 sec bins |
 |
|
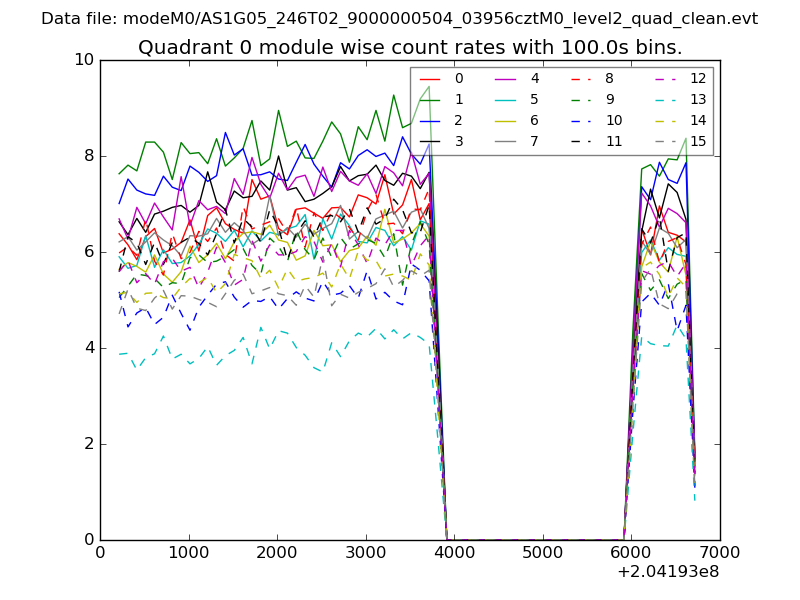
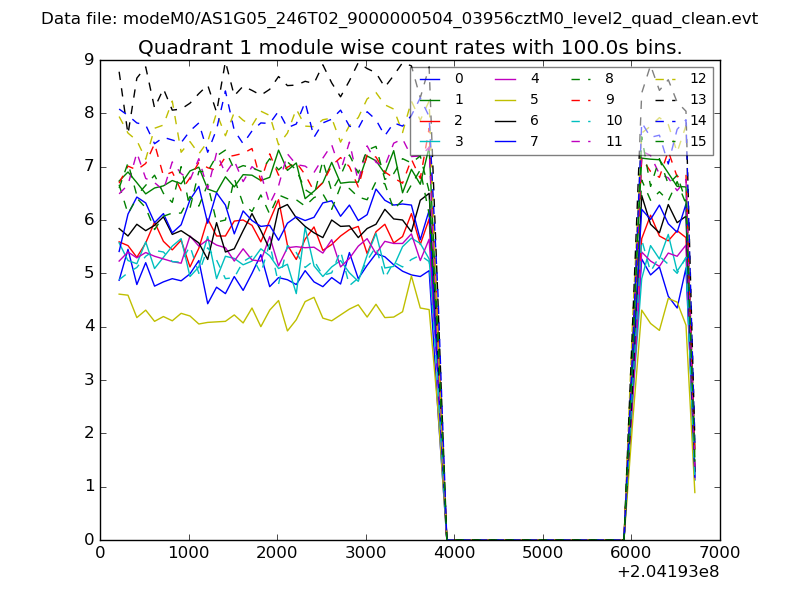
| Module-wise count rates for Quadrant A Data is divided into 100 sec bins |
 |
 |
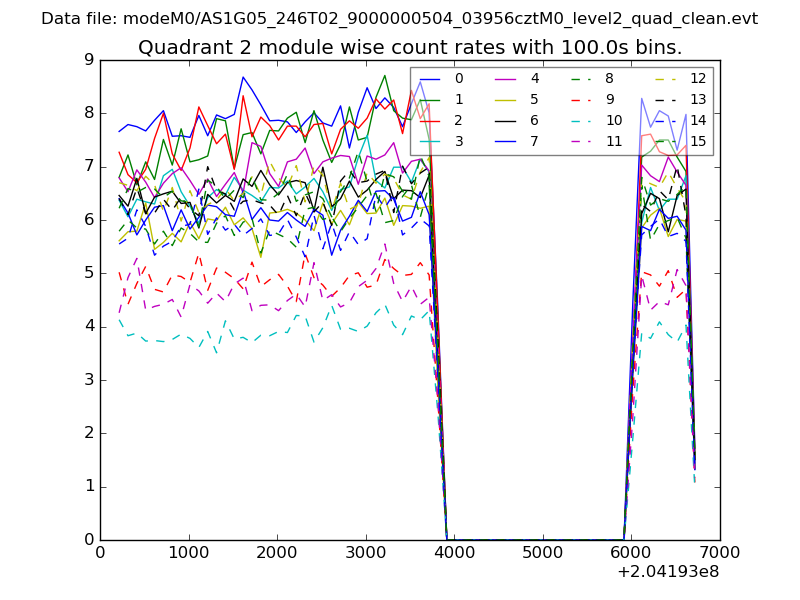
| Module-wise count rates for Quadrant B Data is divided into 100 sec bins |
 |
 |
| Module-wise count rates for Quadrant C Data is divided into 100 sec bins |
 |
 |
| Module-wise count rates for Quadrant D Data is divided into 100 sec bins |
 |
 |
| Parameter | Plot |
|---|---|
| CZT HV Monitor | 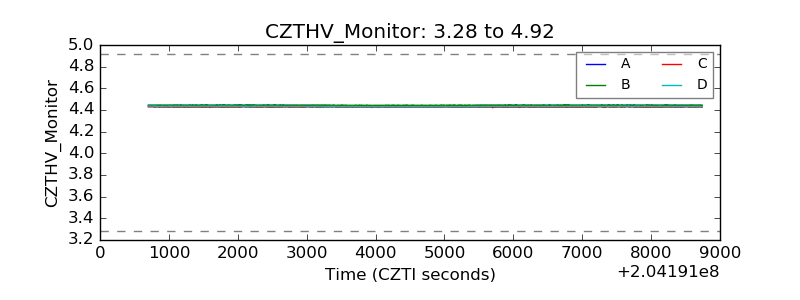 |
| D_VDD | 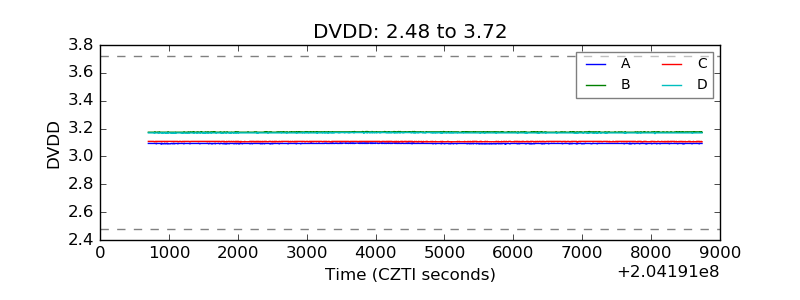 |
| Temperature 1 | 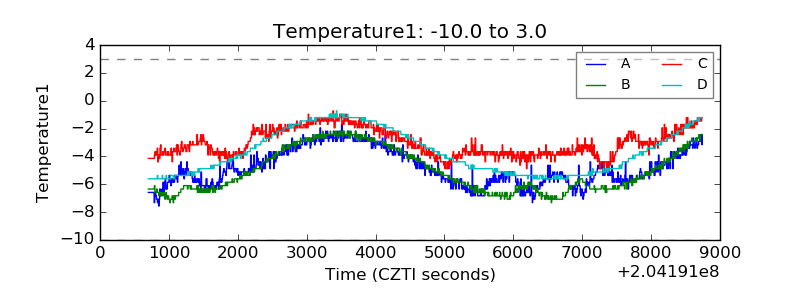 |
| Veto HV Monitor | 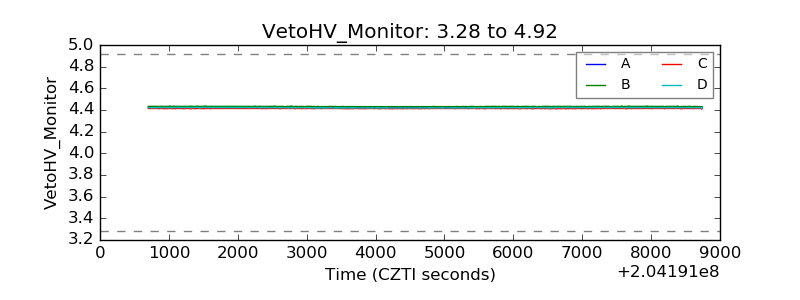 |
| Veto LLD | 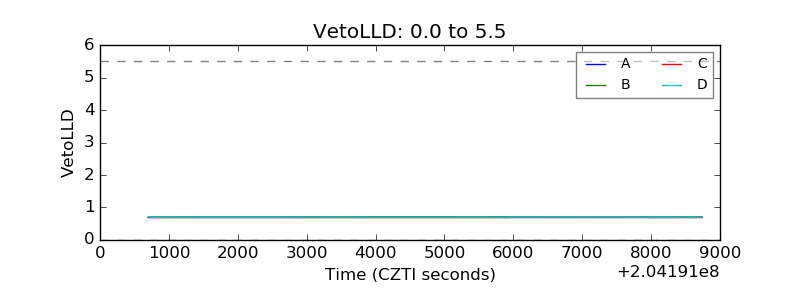 |
| Alpha Counter | 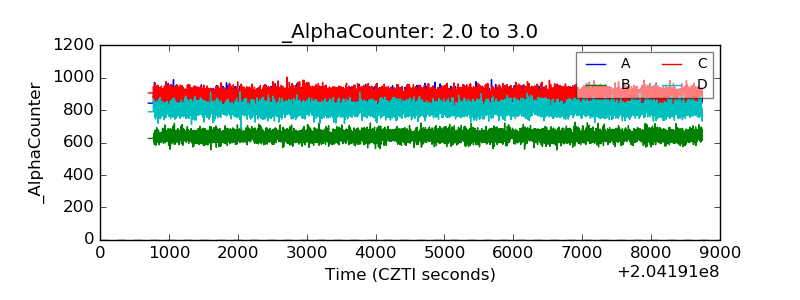 |
| _CPM_Rate | 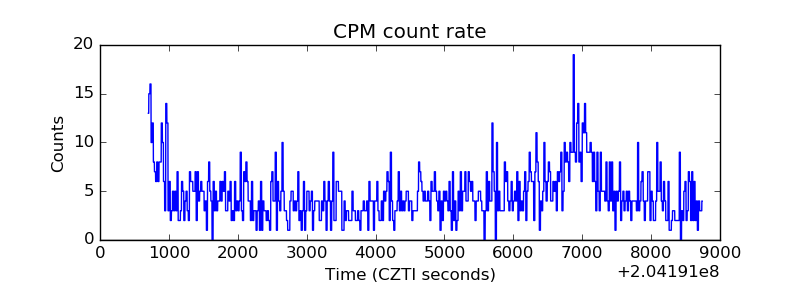 |
| CZT Counter | 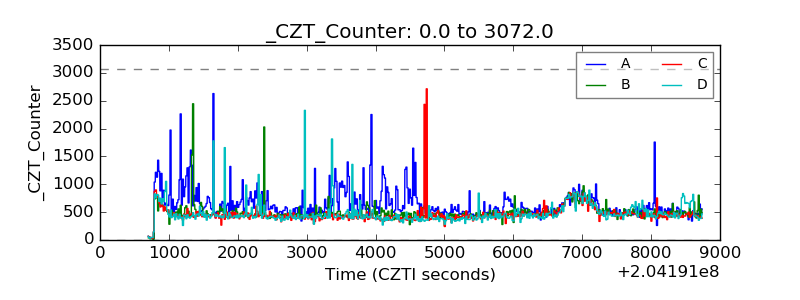 |
| +2.5 Volts monitor |  |
| +5 Volts monitor |  |
| _ROLL_ROT | 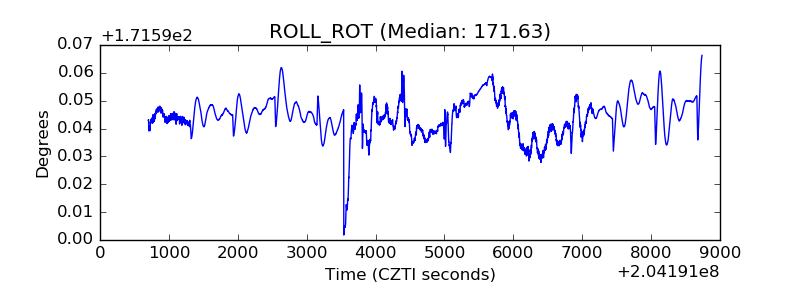 |
| _Roll_DEC | 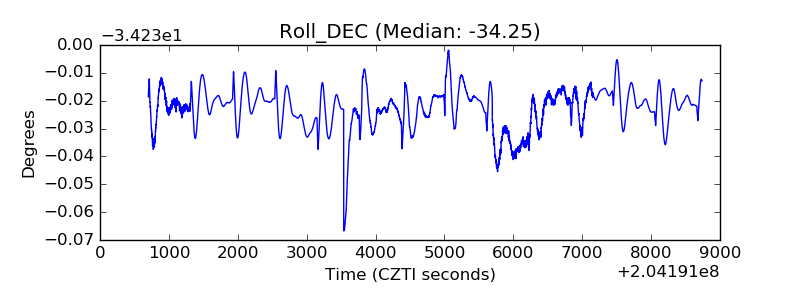 |
| _Roll_RA | 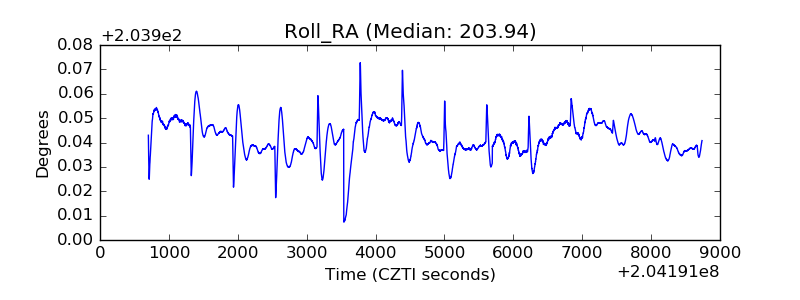 |
| Veto Counter | 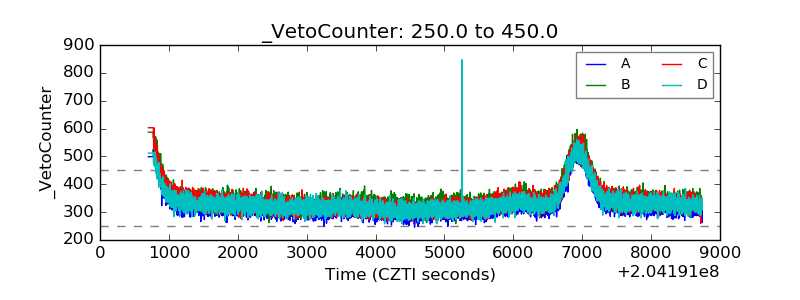 |