| Param | Original file | Final file |
|---|---|---|
| Filename | modeM0/AS1G05_246T02_9000000504_03957cztM0_level2.evt | modeM0/AS1G05_246T02_9000000504_03957cztM0_level2_quad_clean.evt |
| Size (bytes) | 582,151,680 | 88,580,160 |
| Size | 555.2 MB | 84.5 MB |
| Events in quadrant A | 4,694,520 | 484,313 |
| Events in quadrant B | 4,201,316 | 486,900 |
| Events in quadrant C | 3,806,856 | 482,258 |
| Events in quadrant D | 4,370,776 | 659,131 |
| Mode M0 | |||
|---|---|---|---|
| Quadrant | BADHDUFLAG | Total packets | Discarded packets |
| A | 0 | 19051 | 40 |
| B | 0 | 17678 | 34 |
| C | 0 | 17243 | 26 |
| D | 0 | 18880 | 39 |
| Mode M9 | |||
|---|---|---|---|
| Quadrant | BADHDUFLAG | Total packets | Discarded packets |
| A | 0 | 3 | 0 |
| B | 0 | 3 | 0 |
| C | 0 | 3 | 0 |
| D | 0 | 3 | 0 |
| Mode SS | |||
|---|---|---|---|
| Quadrant | BADHDUFLAG | Total packets | Discarded packets |
| A | 0 | 168 | 0 |
| B | 0 | 168 | 0 |
| C | 0 | 168 | 0 |
| D | 0 | 168 | 0 |
| Quadrant | Total seconds | Saturated seconds | Saturation percentage |
|---|---|---|---|
| A | 8197 | 529 | 6.453581% |
| B | 8197 | 446 | 5.441015% |
| C | 8202 | 310 | 3.779566% |
| D | 8196 | 469 | 5.722304% |
Noise dominated data is calculated using 1-second bins in cleaned event files. If a bin has >2000 counts, and if more than 50% of those come from <1% of pixels, then it is considered to be noise-dominated and hence unusable.
| Quadrant | # 1 sec bins | Bins with >0 counts | Bins with >2000 counts | High rate bins dominated by noise | Noise dominated (total time) | Noise dominated (detector-on time) | Marked lightcurve |
|---|---|---|---|---|---|---|---|
| A | 8423 | 8215 | 51 | 51 | 0.61% | 0.62% | 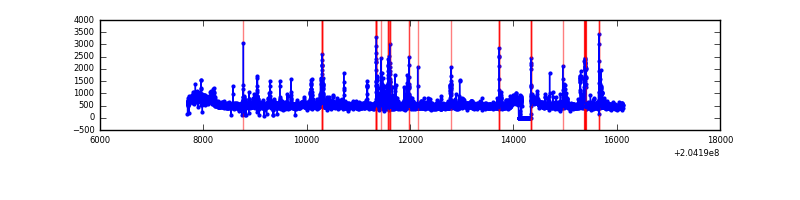 |
| B | 8423 | 8213 | 4 | 4 | 0.05% | 0.05% | 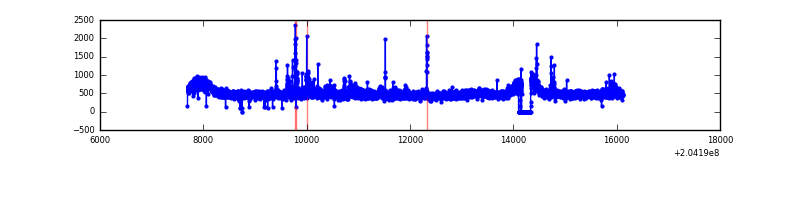 |
| C | 8423 | 8215 | 0 | 0 | 0.00% | 0.00% | 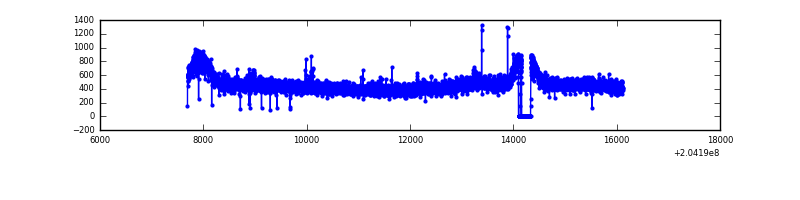 |
| D | 8423 | 8215 | 90 | 90 | 1.07% | 1.10% | 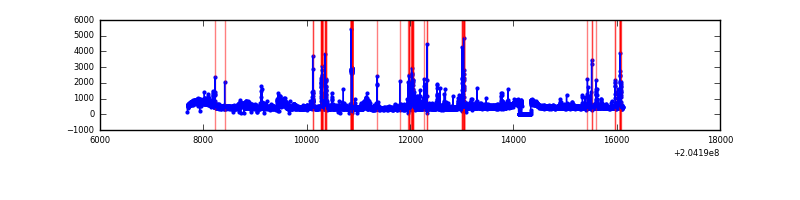 |
Top three noisy pixels from each quadrant. If the there are fewer than three noisy pixels in the level2.evt file, extra rows are filled as -1
| Pixel properties | Quadrant properties | ||||||
|---|---|---|---|---|---|---|---|
| Quadrant | DetID | PixID | Counts | Sigma | Mean | Median | Sigma |
| A | 0 | 118 | 317314 | 1542.68 | 988 | 966 | 205.1 |
| A | 8 | 15 | 316940 | 1540.86 | 988 | 966 | 205.1 |
| A | 2 | 79 | 157178 | 761.77 | 988 | 966 | 205.1 |
| B | 15 | 204 | 166749 | 848.13 | 999 | 972 | 195.5 |
| B | 4 | 81 | 63961 | 322.26 | 999 | 972 | 195.5 |
| B | 3 | 0 | 53021 | 266.29 | 999 | 972 | 195.5 |
| C | 1 | 16 | 23888 | 100.65 | 967 | 968 | 227.7 |
| C | 13 | 61 | 8024 | 30.98 | 967 | 968 | 227.7 |
| C | 9 | 144 | 2437 | 6.45 | 967 | 968 | 227.7 |
| D | 2 | 232 | 314075 | 1333.72 | 963 | 929 | 234.8 |
| D | 2 | 63 | 127889 | 540.74 | 963 | 929 | 234.8 |
| D | 10 | 246 | 78206 | 329.13 | 963 | 929 | 234.8 |
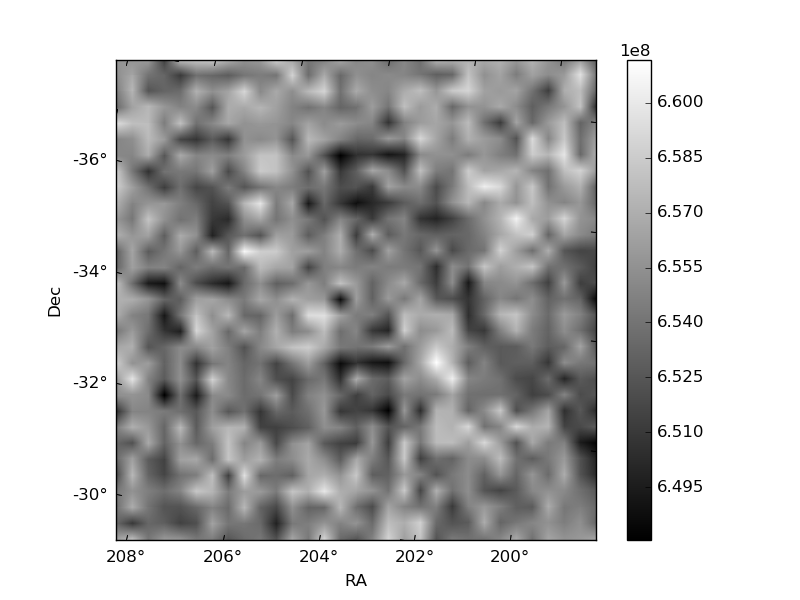
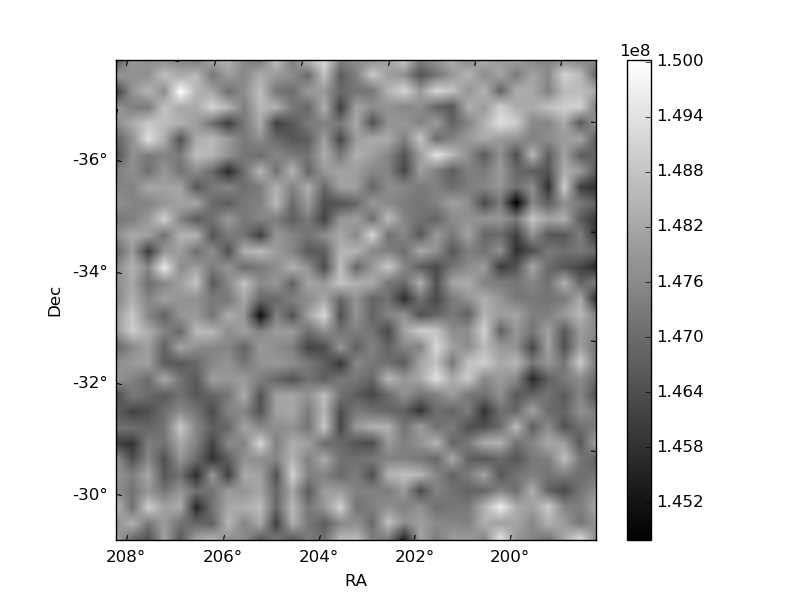
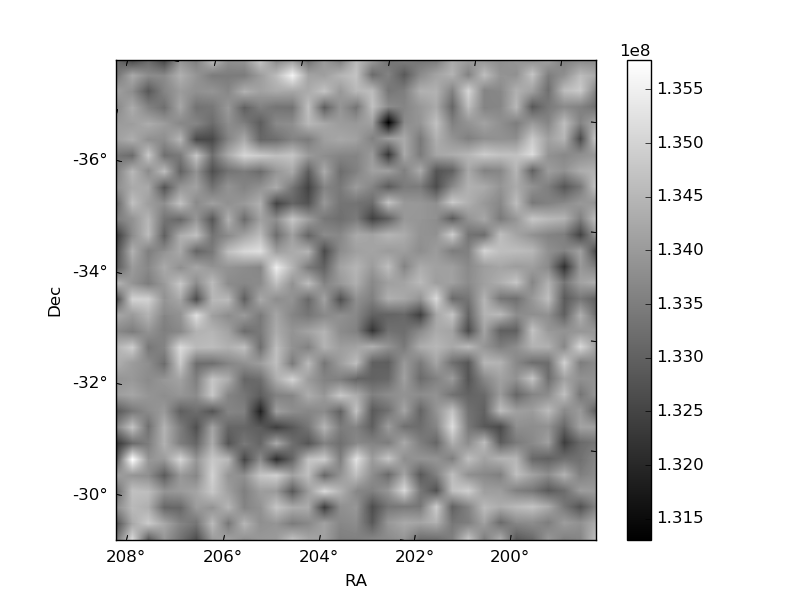
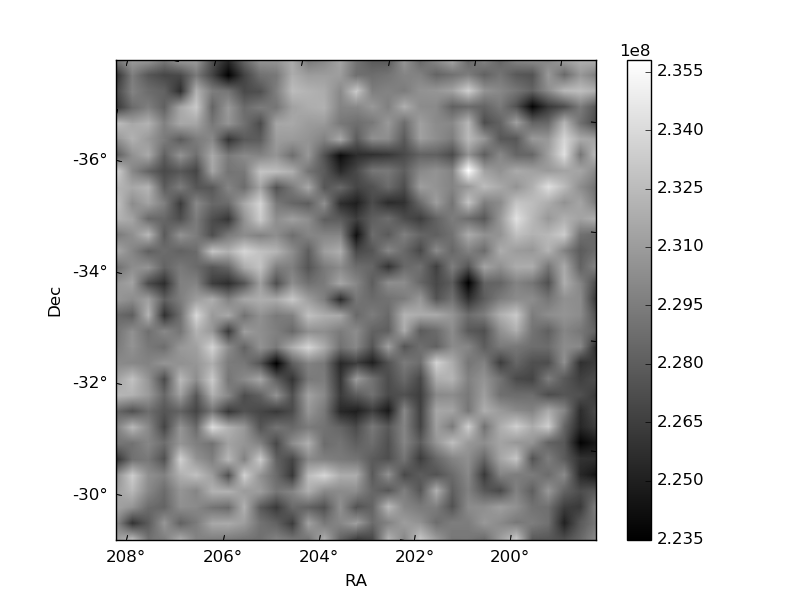
Histogram calculated using DETX and DETY for each event in the final _common_clean file
| Quadrant A | 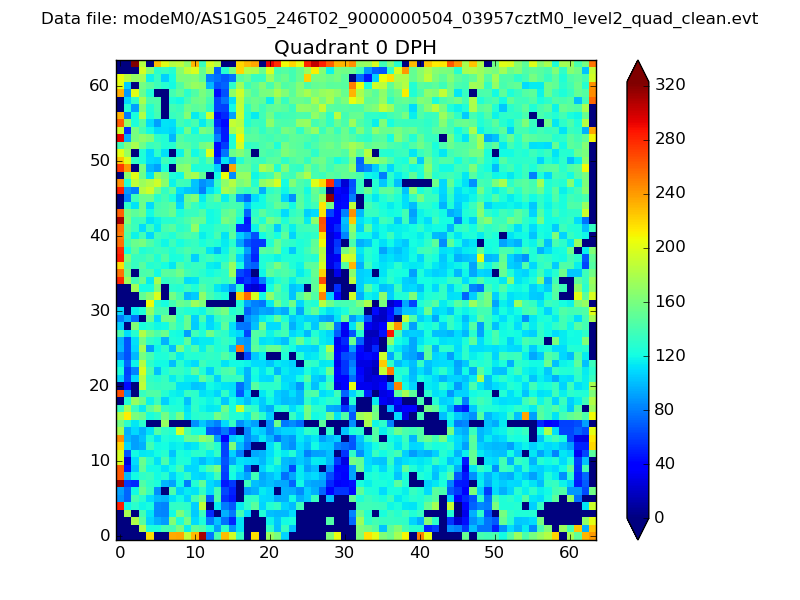 |
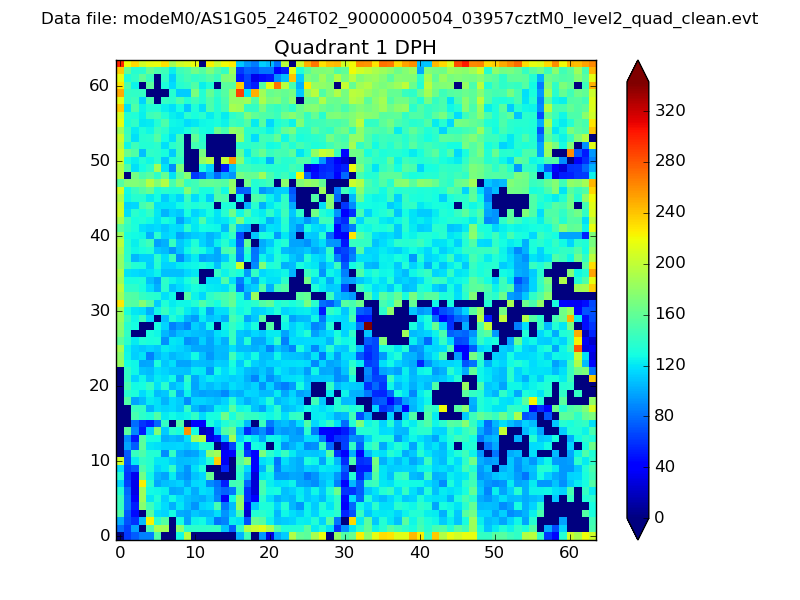 |
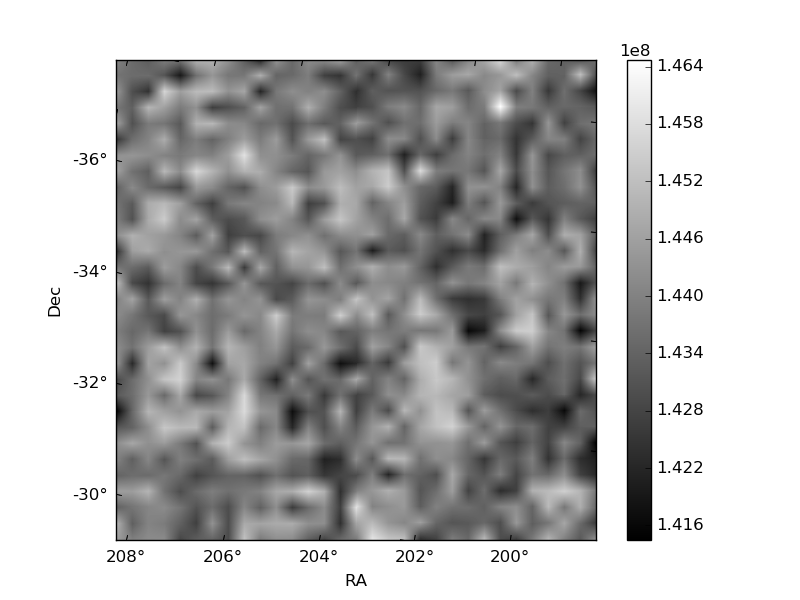
Quadrant B |
|---|---|---|---|
| Quadrant D | 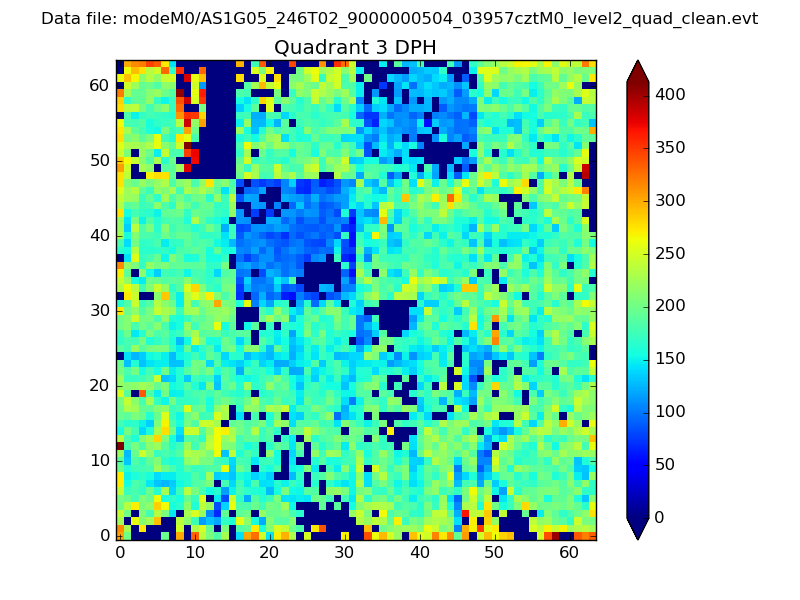 |
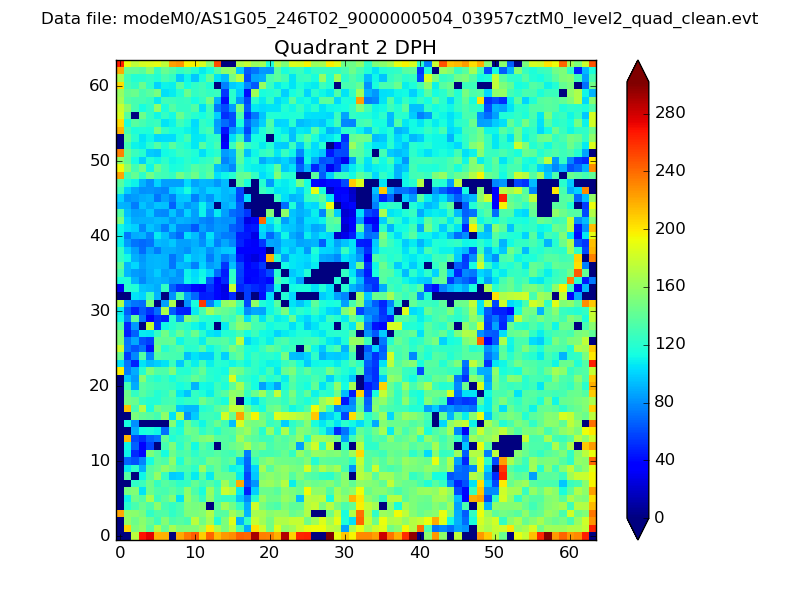 |
Quadrant C |
| Plot type | Count rate plots | Images |
|---|---|---|
| Comparison with Poisson distribution Blue bars denote a histogram of data divided into 1 sec bins. Red curve is a Poisson curve with rate = median count rate of data. |
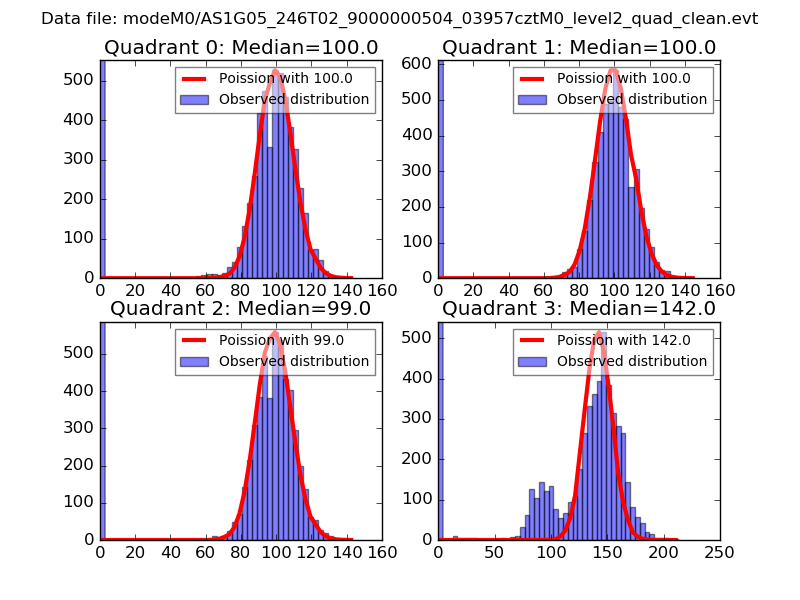 |
 |
| Quadrant-wise count rates Data is divided into 100 sec bins |
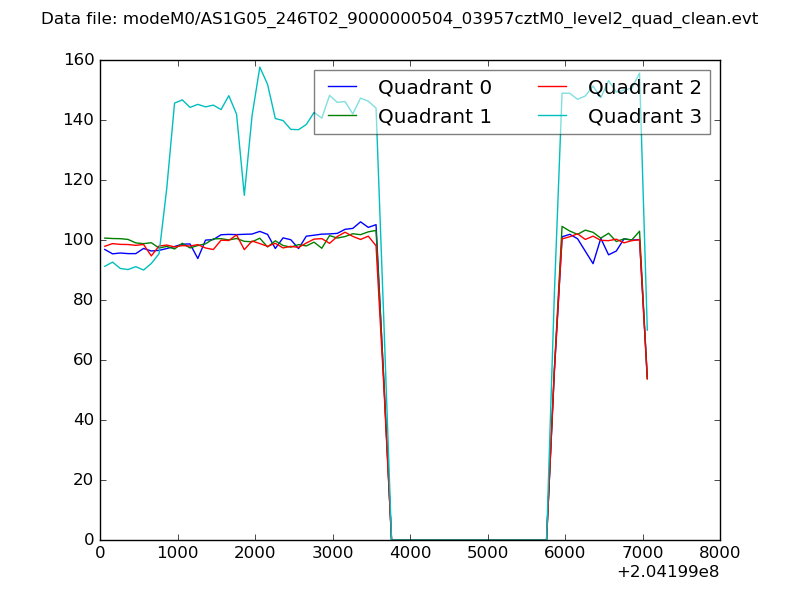 |
|
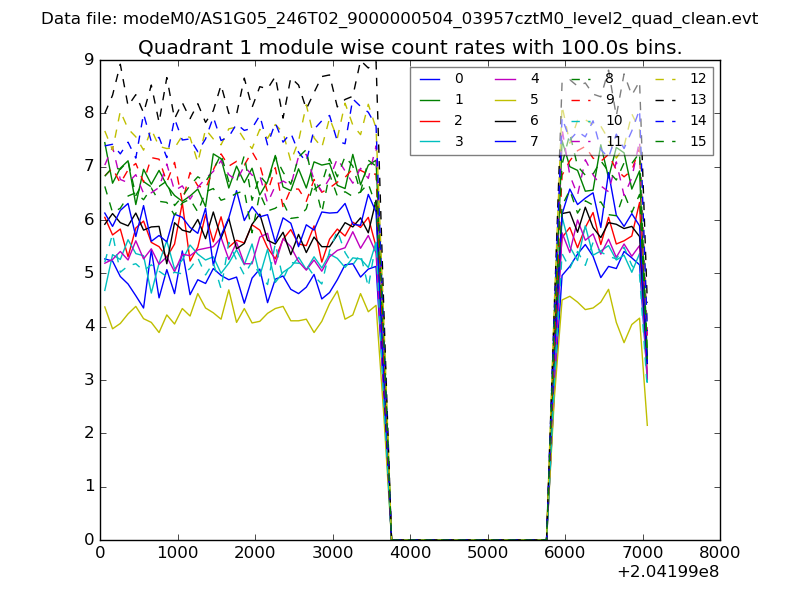
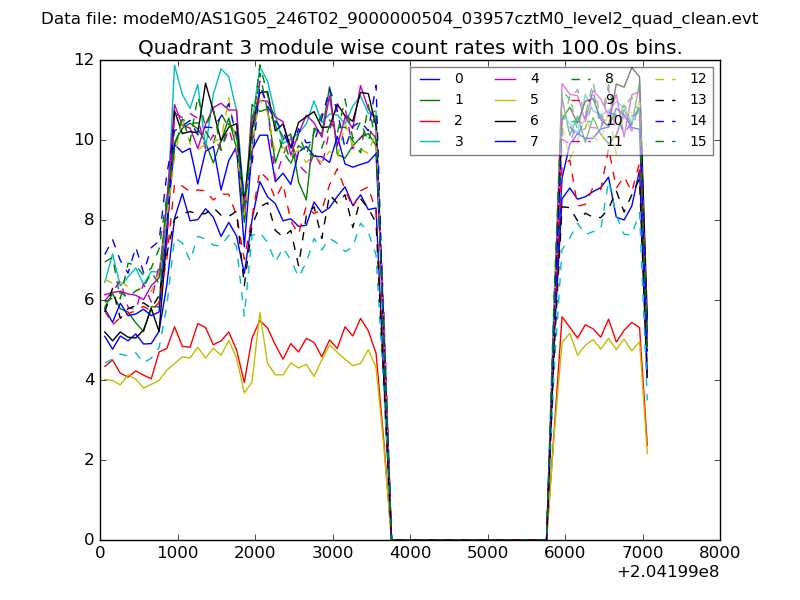
| Module-wise count rates for Quadrant A Data is divided into 100 sec bins |
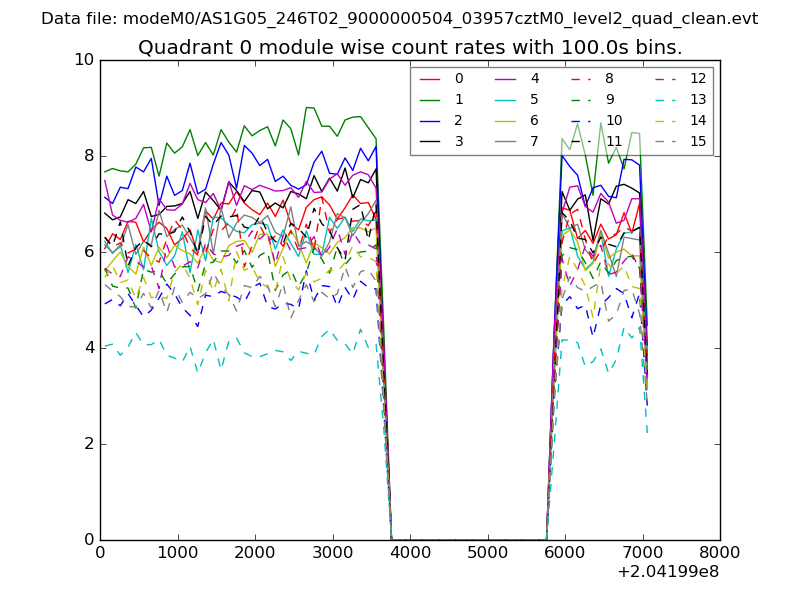 |
 |
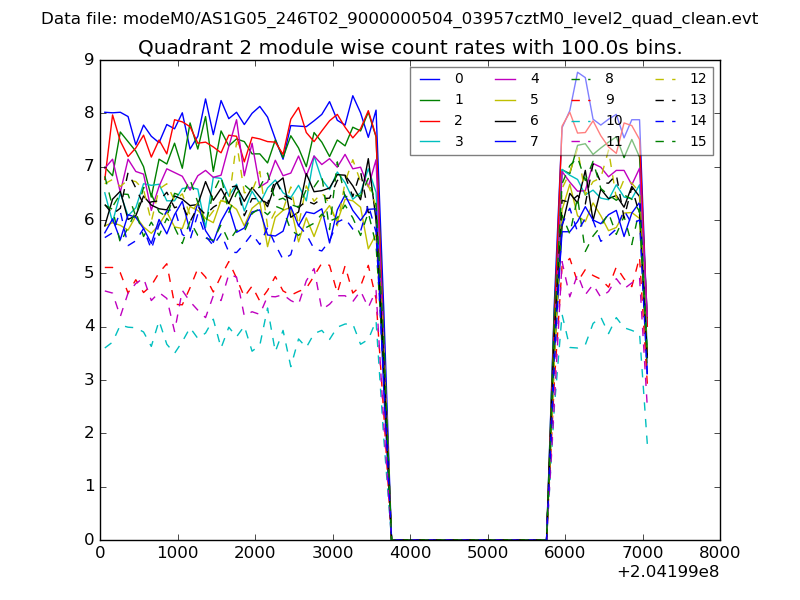
| Module-wise count rates for Quadrant B Data is divided into 100 sec bins |
 |
 |
| Module-wise count rates for Quadrant C Data is divided into 100 sec bins |
 |
 |
| Module-wise count rates for Quadrant D Data is divided into 100 sec bins |
 |
 |
| Parameter | Plot |
|---|---|
| CZT HV Monitor | 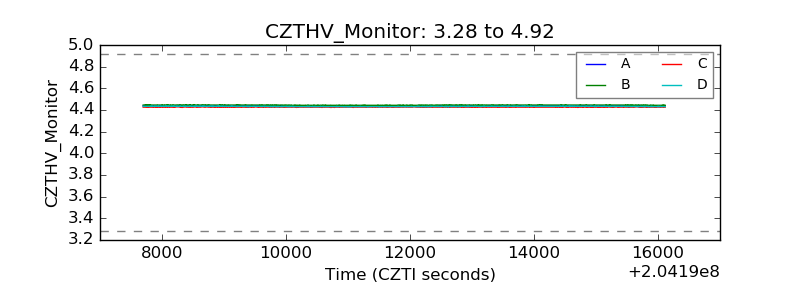 |
| D_VDD | 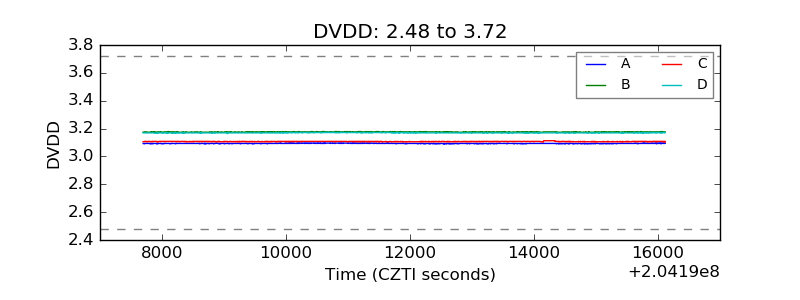 |
| Temperature 1 | 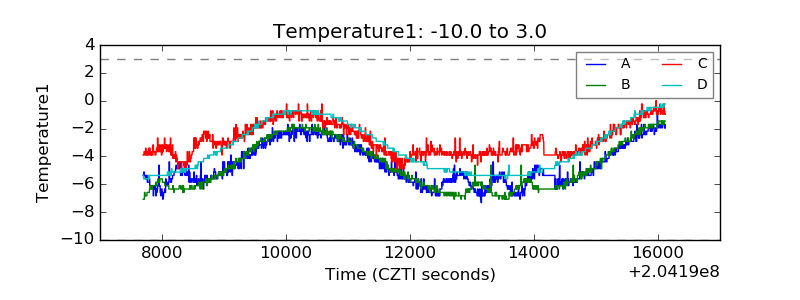 |
| Veto HV Monitor | 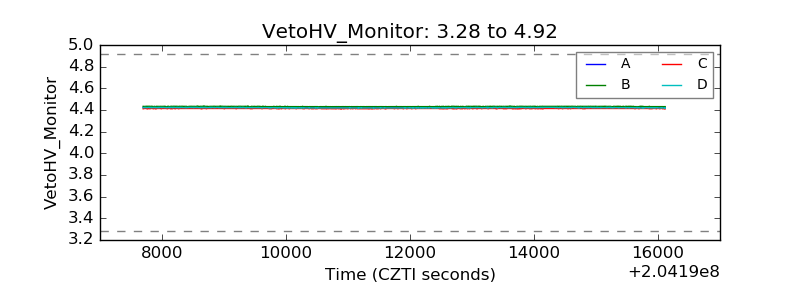 |
| Veto LLD | 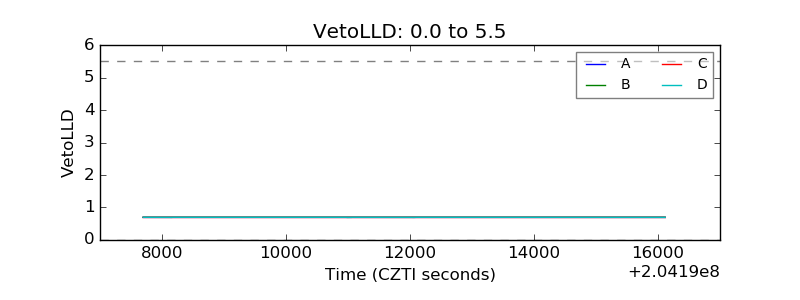 |
| Alpha Counter | 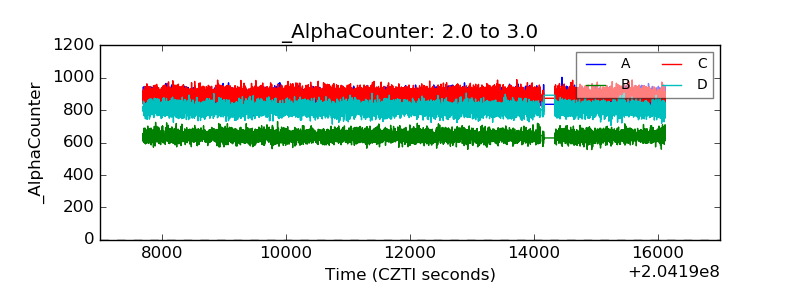 |
| _CPM_Rate | 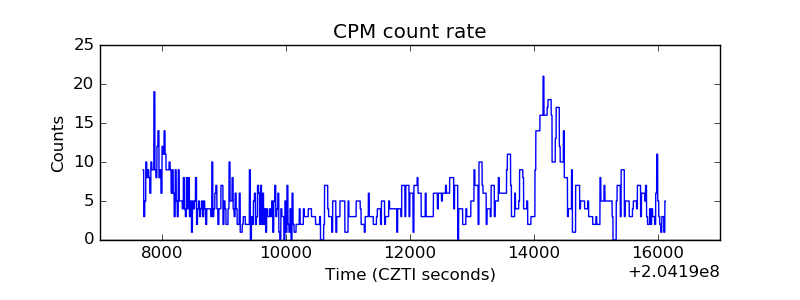 |
| CZT Counter | 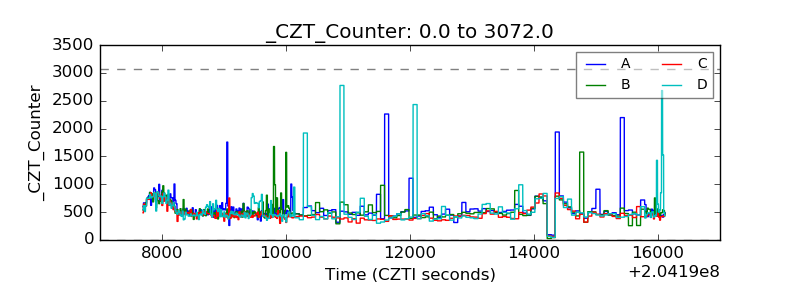 |
| +2.5 Volts monitor |  |
| +5 Volts monitor |  |
| _ROLL_ROT | 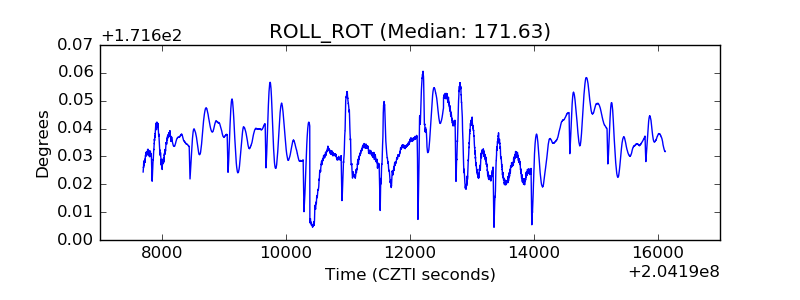 |
| _Roll_DEC | 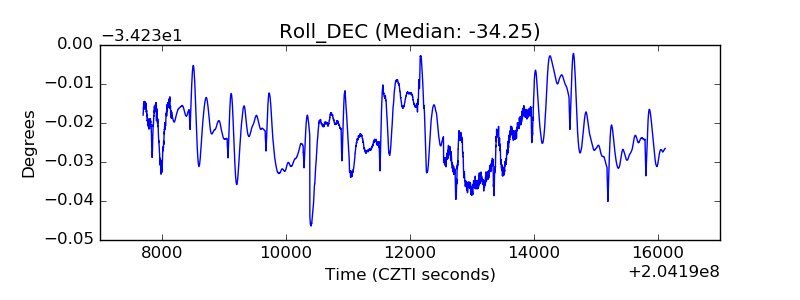 |
| _Roll_RA | 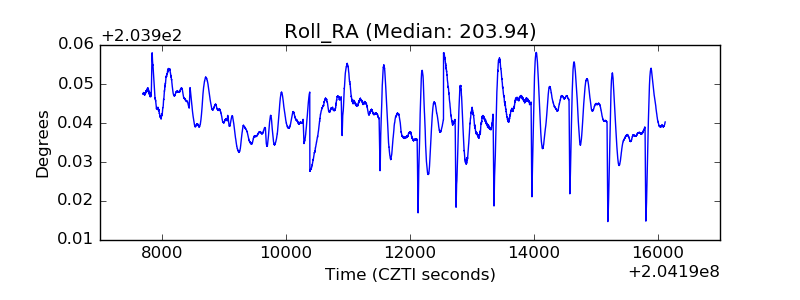 |
| Veto Counter | 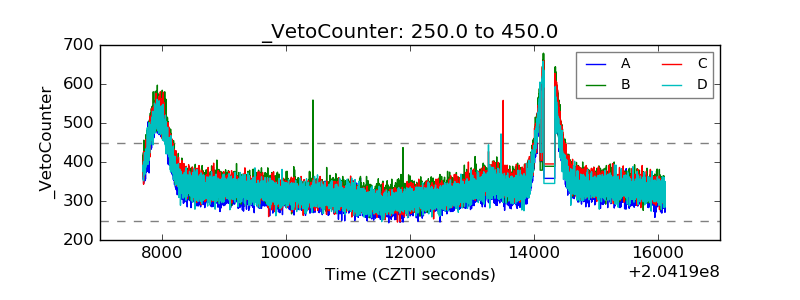 |