| Param | Original file | Final file |
|---|---|---|
| Filename | modeM0/AS1G05_246T02_9000000504_03959cztM0_level2.evt | modeM0/AS1G05_246T02_9000000504_03959cztM0_level2_quad_clean.evt |
| Size (bytes) | 119,888,640 | 27,175,680 |
| Size | 114.3 MB | 25.9 MB |
| Events in quadrant A | 947,984 | 175,004 |
| Events in quadrant B | 910,916 | 175,381 |
| Events in quadrant C | 740,557 | 174,301 |
| Events in quadrant D | 908,413 | 168,243 |
| Mode M0 | |||
|---|---|---|---|
| Quadrant | BADHDUFLAG | Total packets | Discarded packets |
| A | 0 | 3997 | 1 |
| B | 0 | 3787 | 0 |
| C | 0 | 3530 | 0 |
| D | 0 | 3956 | 0 |
| Mode SS | |||
|---|---|---|---|
| Quadrant | BADHDUFLAG | Total packets | Discarded packets |
| A | 0 | 36 | 0 |
| B | 0 | 36 | 0 |
| C | 0 | 36 | 0 |
| D | 0 | 36 | 0 |
| Quadrant | Total seconds | Saturated seconds | Saturation percentage |
|---|---|---|---|
| A | 1764 | 32 | 1.814059% |
| B | 1764 | 1 | 0.056689% |
| C | 1764 | 1 | 0.056689% |
| D | 1764 | 32 | 1.814059% |
Noise dominated data is calculated using 1-second bins in cleaned event files. If a bin has >2000 counts, and if more than 50% of those come from <1% of pixels, then it is considered to be noise-dominated and hence unusable.
| Quadrant | # 1 sec bins | Bins with >0 counts | Bins with >2000 counts | High rate bins dominated by noise | Noise dominated (total time) | Noise dominated (detector-on time) | Marked lightcurve |
|---|---|---|---|---|---|---|---|
| A | 1764 | 1764 | 21 | 21 | 1.19% | 1.19% | 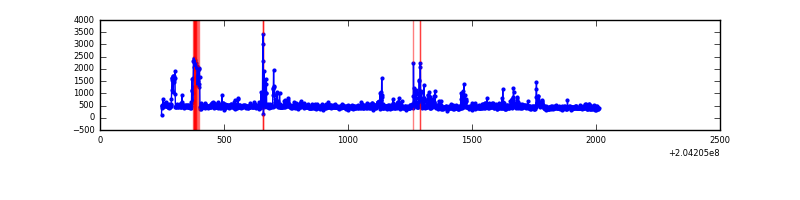 |
| B | 1764 | 1764 | 0 | 0 | 0.00% | 0.00% | 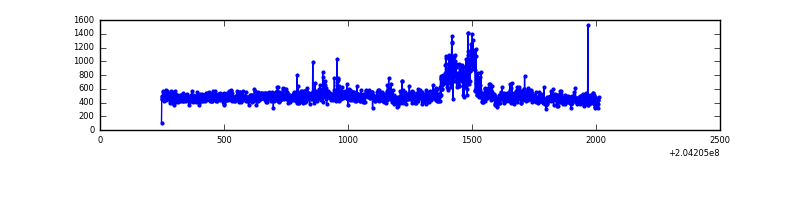 |
| C | 1764 | 1764 | 0 | 0 | 0.00% | 0.00% |  |
| D | 1764 | 1764 | 18 | 18 | 1.02% | 1.02% | 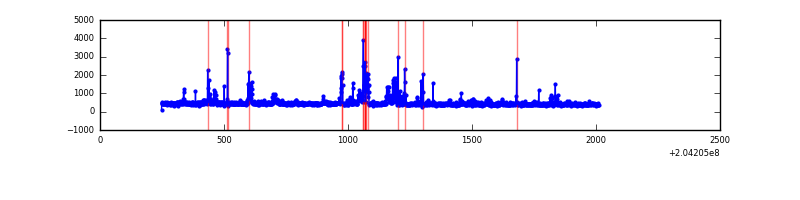 |
Top three noisy pixels from each quadrant. If the there are fewer than three noisy pixels in the level2.evt file, extra rows are filled as -1
| Pixel properties | Quadrant properties | ||||||
|---|---|---|---|---|---|---|---|
| Quadrant | DetID | PixID | Counts | Sigma | Mean | Median | Sigma |
| A | 0 | 118 | 142222 | 3340.19 | 198 | 194 | 42.5 |
| A | 0 | 226 | 14546 | 337.53 | 198 | 194 | 42.5 |
| A | 8 | 15 | 11595 | 268.13 | 198 | 194 | 42.5 |
| B | 15 | 204 | 117343 | 2855.34 | 197 | 192 | 41.0 |
| B | 3 | 0 | 12682 | 304.42 | 197 | 192 | 41.0 |
| B | 15 | 54 | 10884 | 260.6 | 197 | 192 | 41.0 |
| C | 13 | 61 | 1572 | 29.94 | 189 | 190 | 46.2 |
| C | 14 | 67 | 1303 | 24.11 | 189 | 190 | 46.2 |
| C | 3 | 202 | 462 | 5.89 | 189 | 190 | 46.2 |
| D | 2 | 232 | 83929 | 1723.25 | 191 | 185 | 48.6 |
| D | 12 | 233 | 25071 | 512.09 | 191 | 185 | 48.6 |
| D | 4 | 95 | 22879 | 466.99 | 191 | 185 | 48.6 |
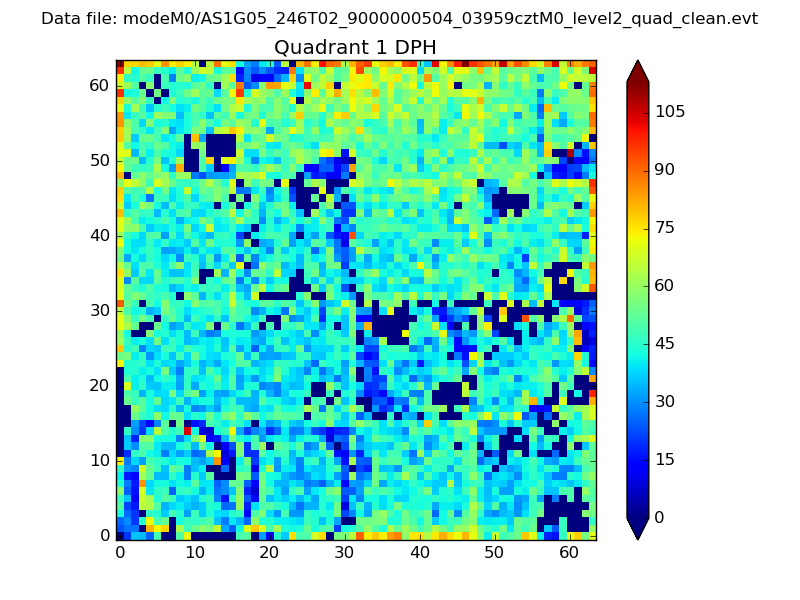
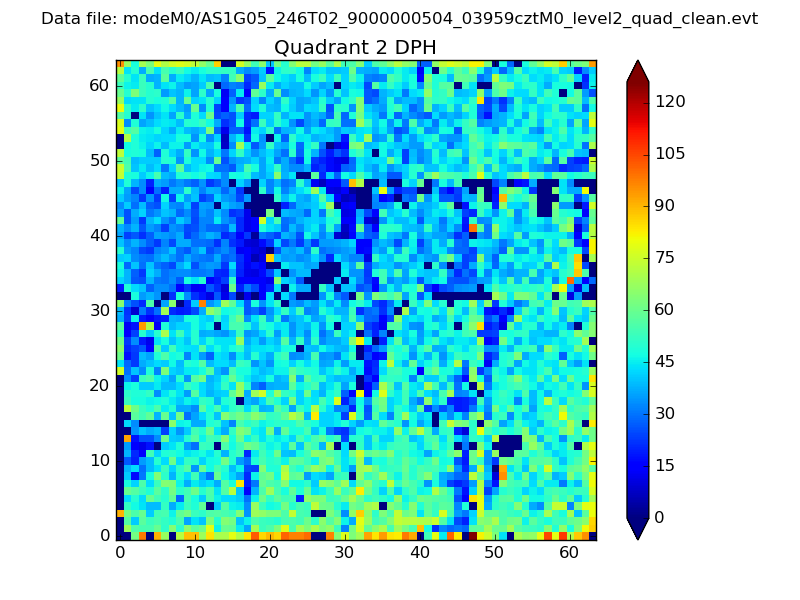
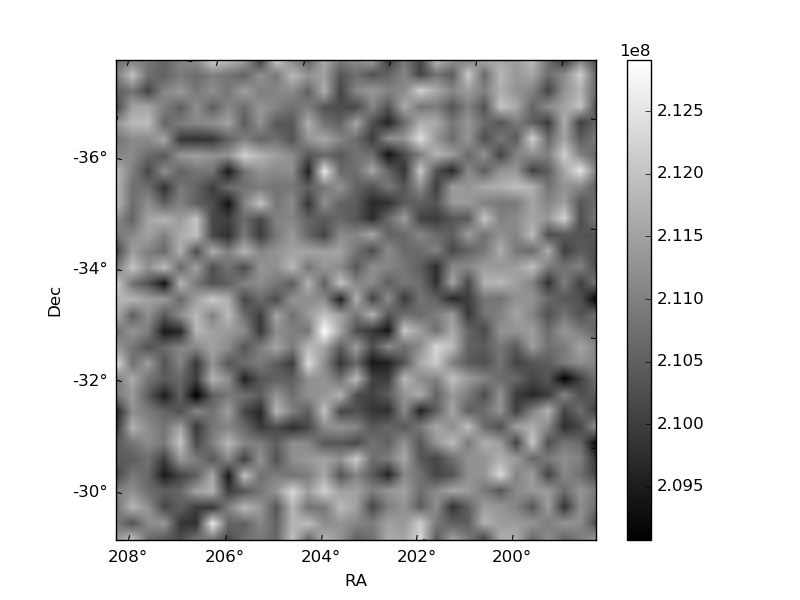
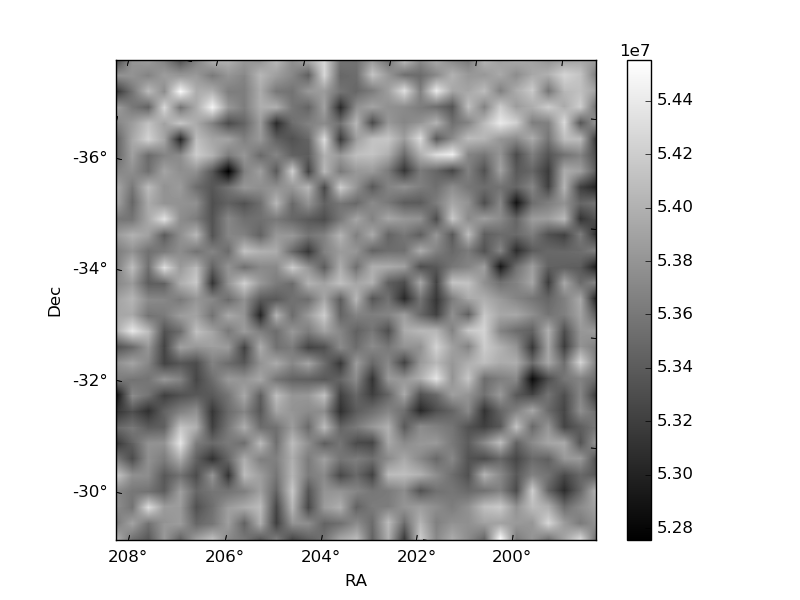
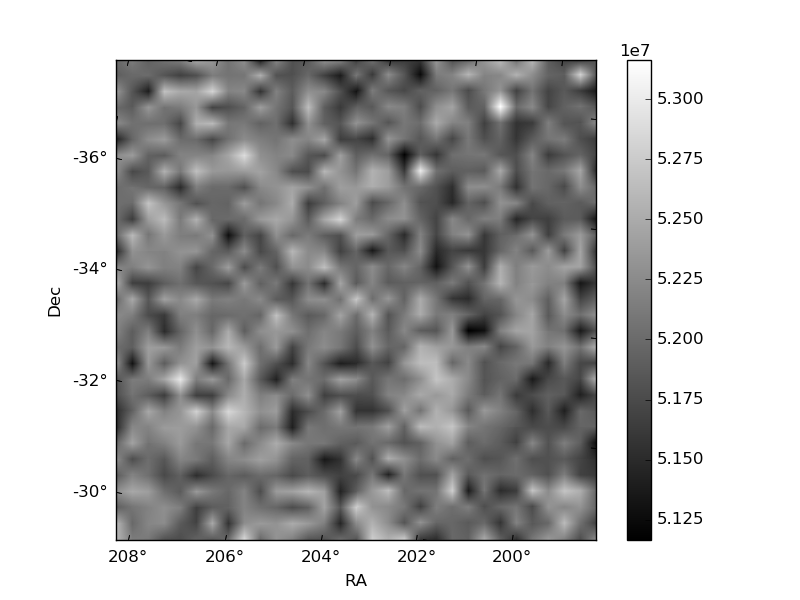
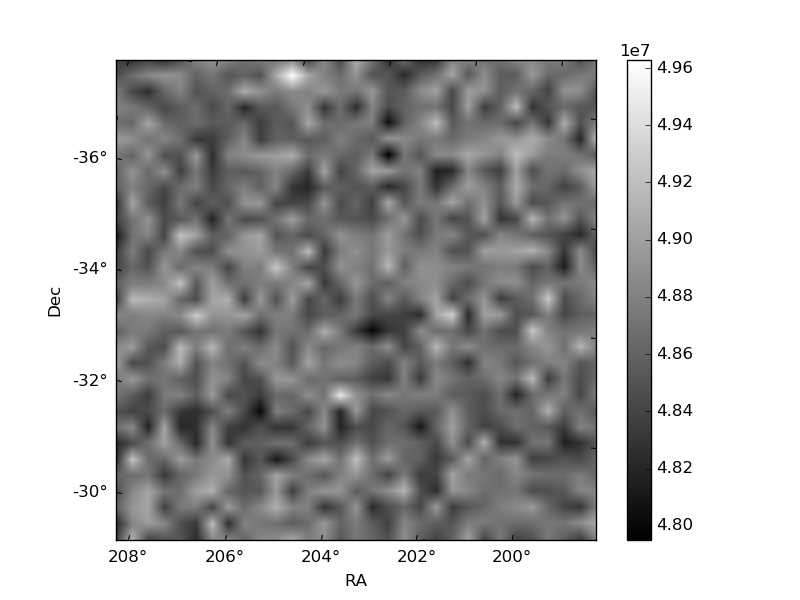
Histogram calculated using DETX and DETY for each event in the final _common_clean file
| Quadrant A | 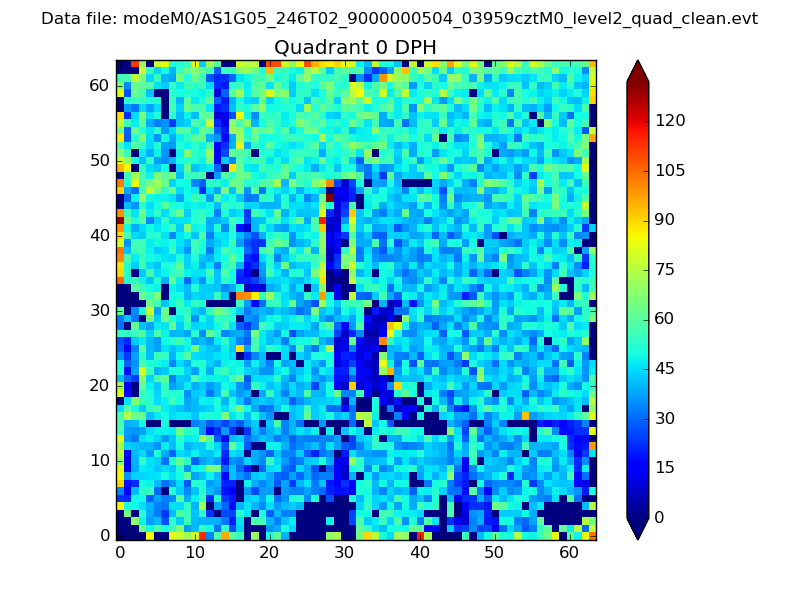 |
 |
Quadrant B |
|---|---|---|---|
| Quadrant D | 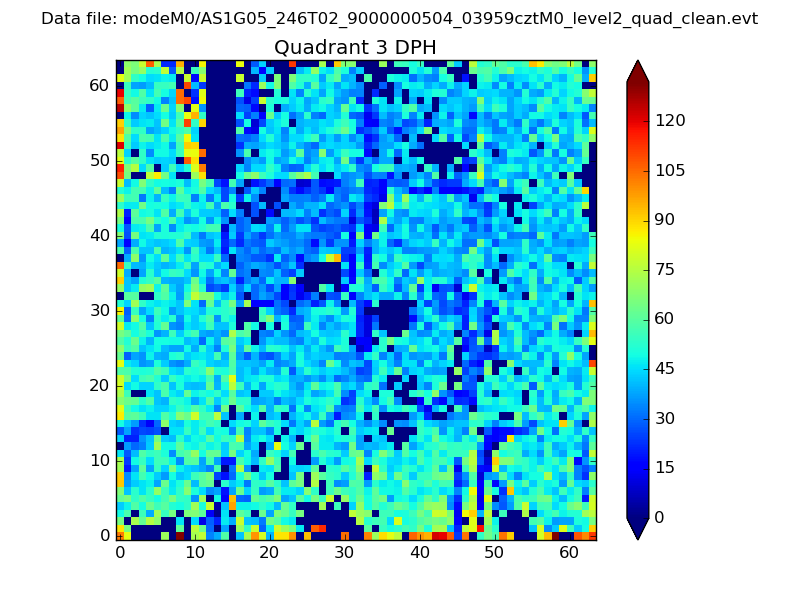 |
 |
Quadrant C |
| Plot type | Count rate plots | Images |
|---|---|---|
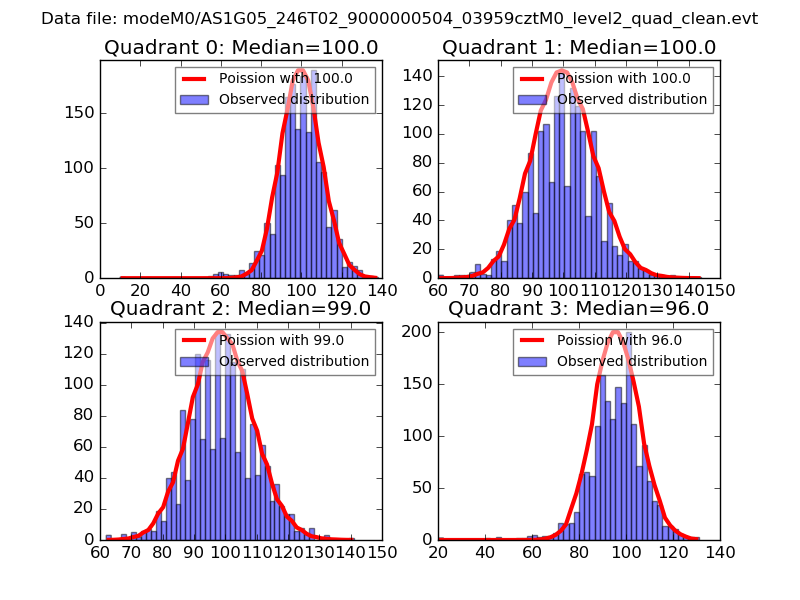
| Comparison with Poisson distribution Blue bars denote a histogram of data divided into 1 sec bins. Red curve is a Poisson curve with rate = median count rate of data. |
 |
 |
| Quadrant-wise count rates Data is divided into 100 sec bins |
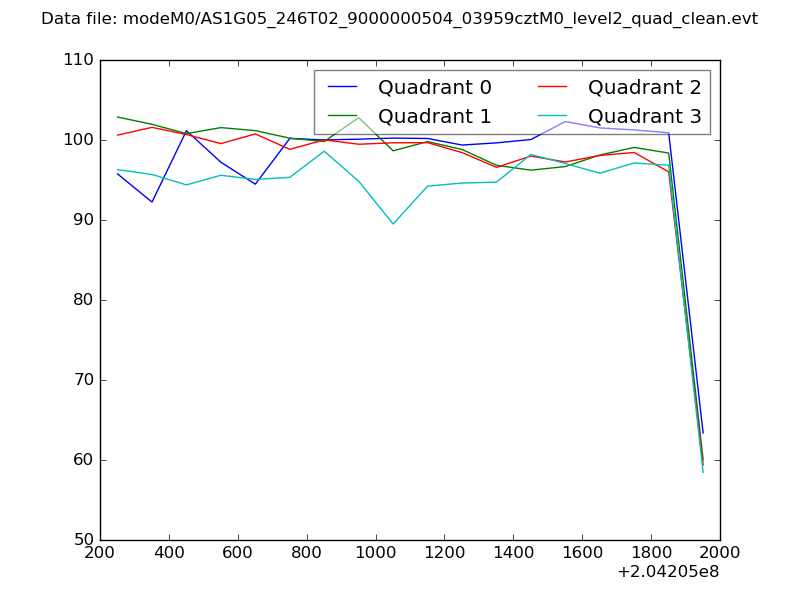 |
|
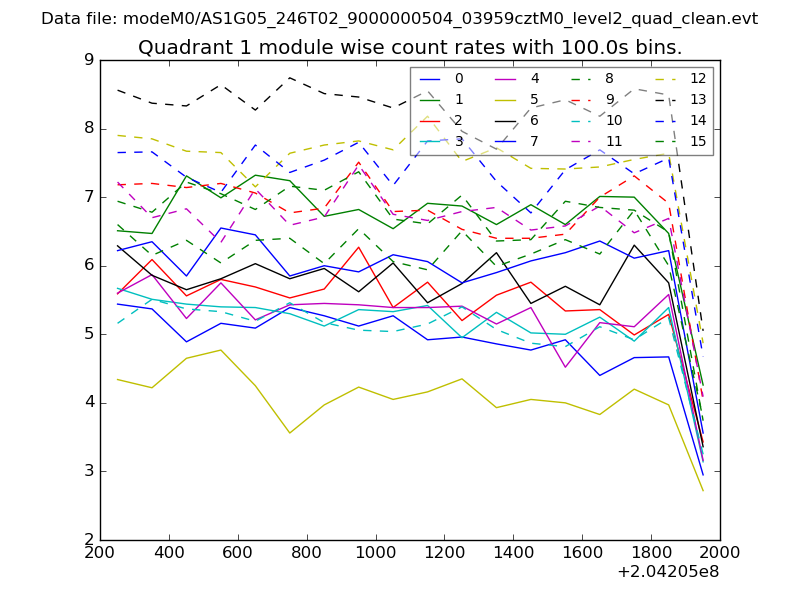
| Module-wise count rates for Quadrant A Data is divided into 100 sec bins |
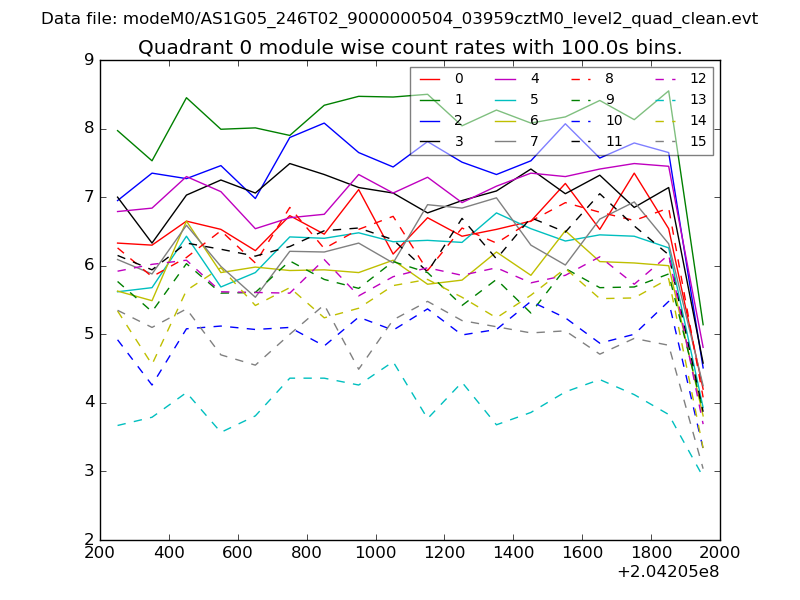 |
 |
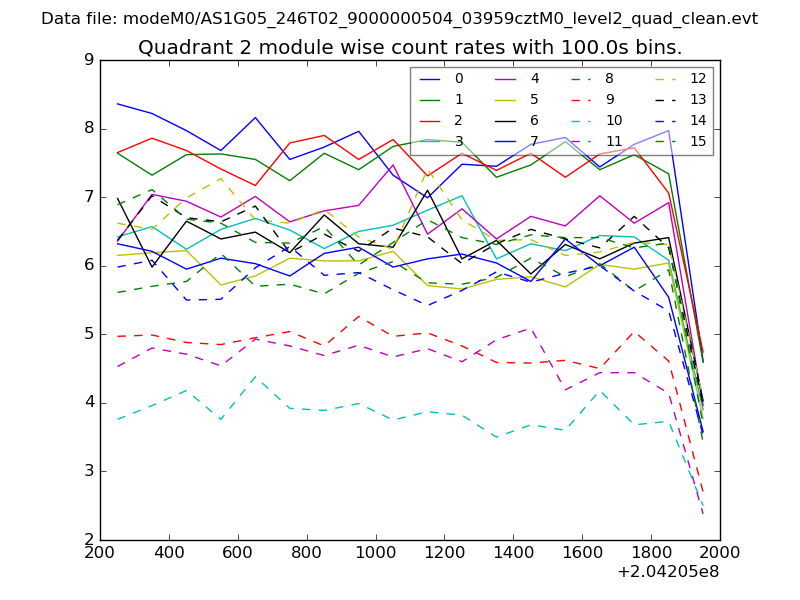
| Module-wise count rates for Quadrant B Data is divided into 100 sec bins |
 |
 |
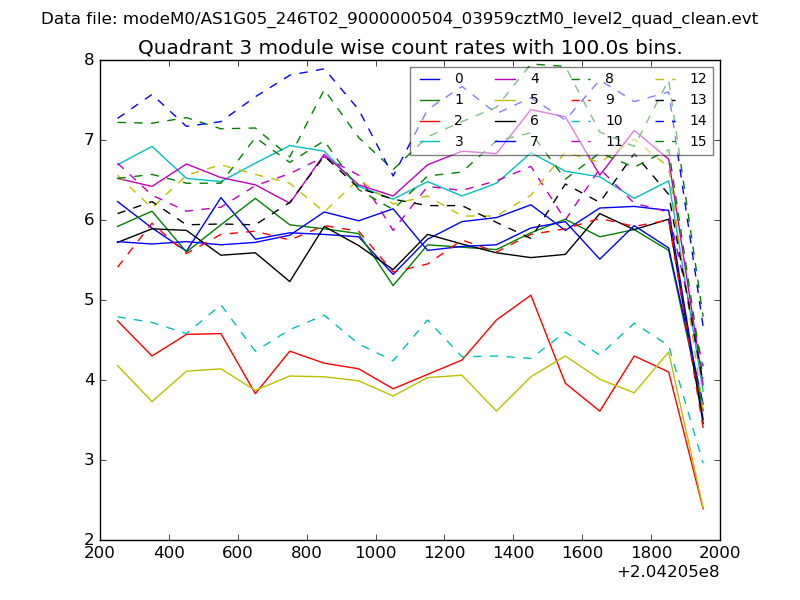
| Module-wise count rates for Quadrant C Data is divided into 100 sec bins |
 |
 |
| Module-wise count rates for Quadrant D Data is divided into 100 sec bins |
 |
 |
| Parameter | Plot |
|---|---|
| CZT HV Monitor | 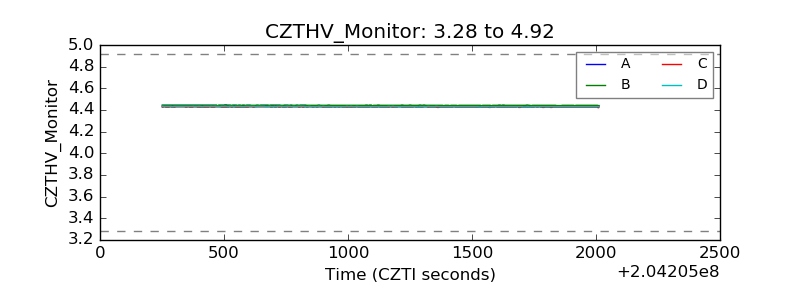 |
| D_VDD | 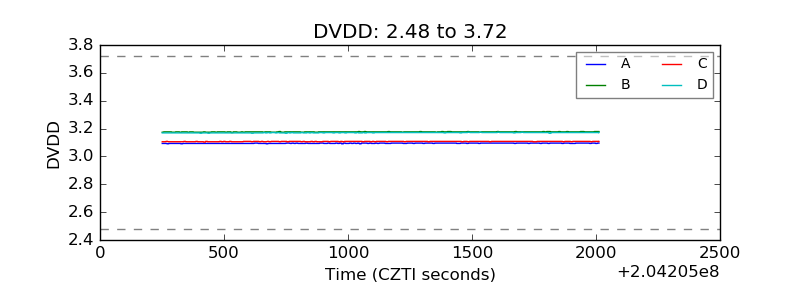 |
| Temperature 1 | 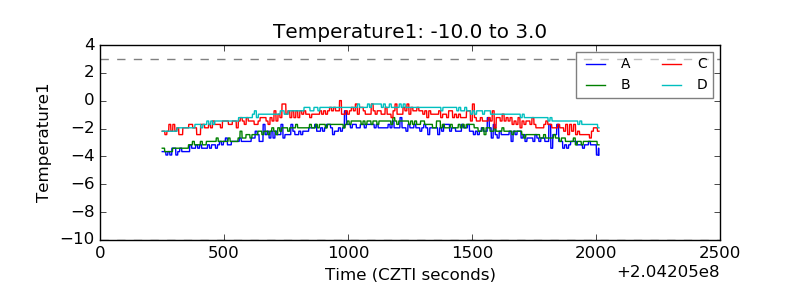 |
| Veto HV Monitor | 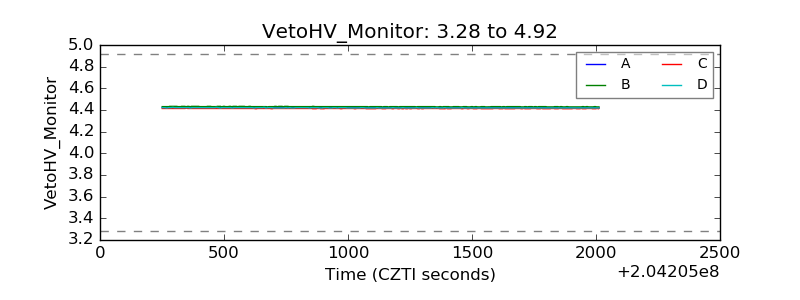 |
| Veto LLD | 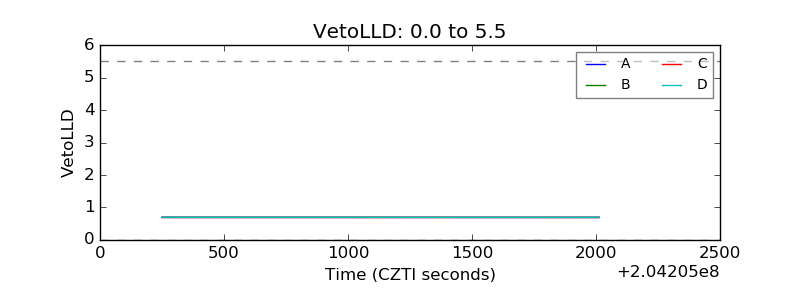 |
| Alpha Counter | 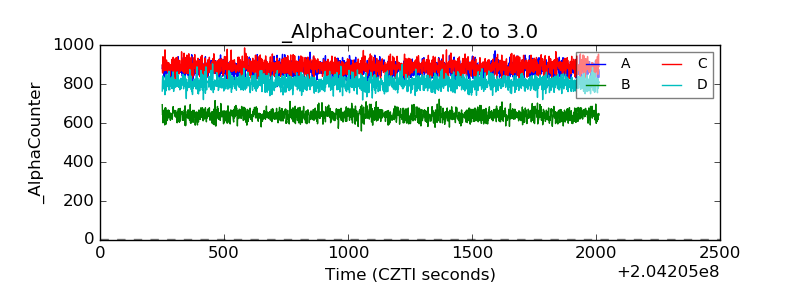 |
| _CPM_Rate | 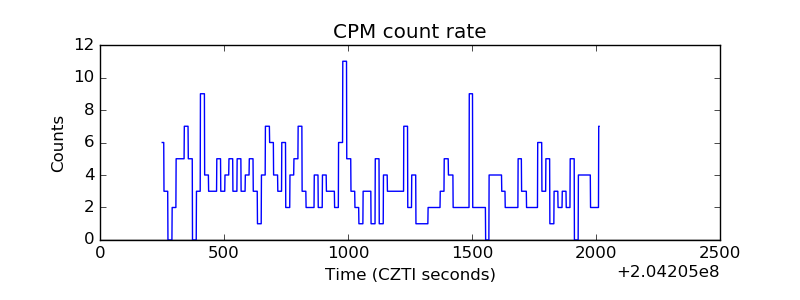 |
| CZT Counter | 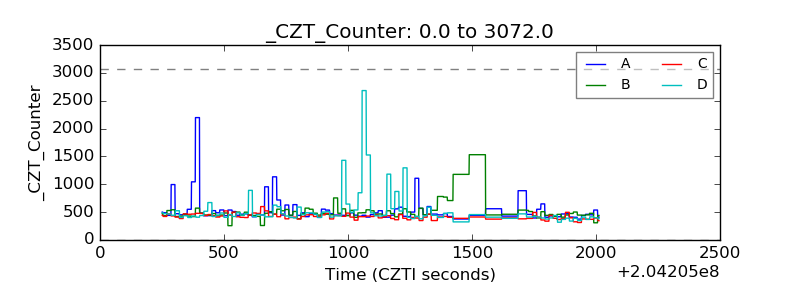 |
| +2.5 Volts monitor |  |
| +5 Volts monitor |  |
| _ROLL_ROT | 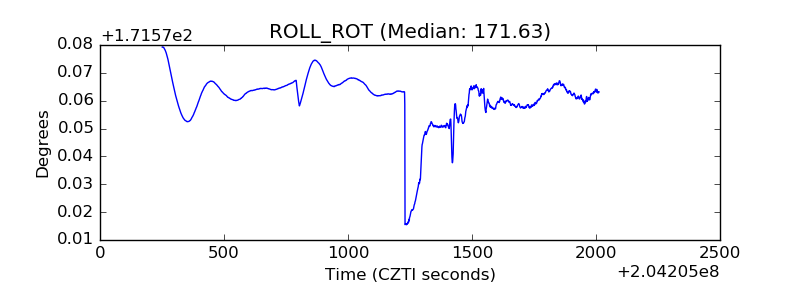 |
| _Roll_DEC | 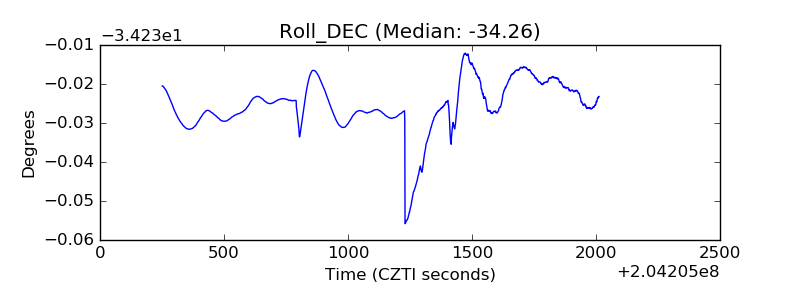 |
| _Roll_RA | 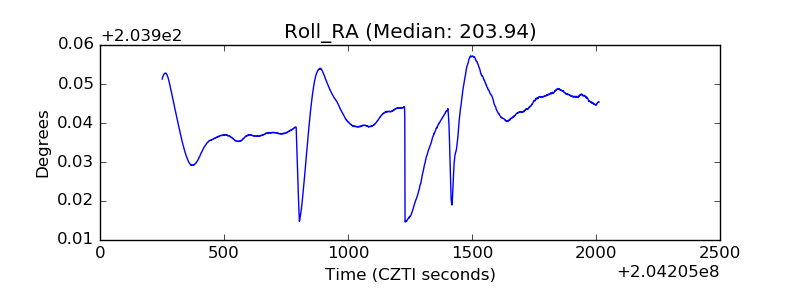 |
| Veto Counter | 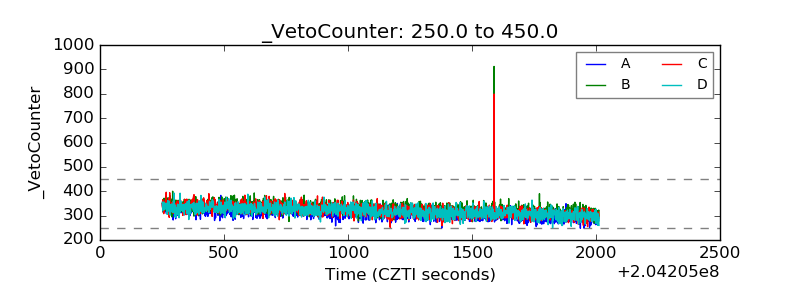 |