| Param | Original file | Final file |
|---|---|---|
| Filename | modeM0/AS1G05_246T02_9000000504_03960cztM0_level2.evt | modeM0/AS1G05_246T02_9000000504_03960cztM0_level2_quad_clean.evt |
| Size (bytes) | 1,300,858,560 | 181,725,120 |
| Size | 1.2 GB | 173.3 MB |
| Events in quadrant A | 12,888,226 | 1,091,207 |
| Events in quadrant B | 8,667,505 | 1,099,497 |
| Events in quadrant C | 7,353,286 | 1,091,318 |
| Events in quadrant D | 9,355,598 | 1,064,804 |
| Mode M0 | |||
|---|---|---|---|
| Quadrant | BADHDUFLAG | Total packets | Discarded packets |
| A | 0 | 50246 | 4 |
| B | 0 | 36647 | 3 |
| C | 0 | 34223 | 3 |
| D | 0 | 39351 | 3 |
| Mode M9 | |||
|---|---|---|---|
| Quadrant | BADHDUFLAG | Total packets | Discarded packets |
| A | 0 | 20 | 0 |
| B | 0 | 20 | 0 |
| C | 0 | 20 | 0 |
| D | 0 | 20 | 0 |
| Mode SS | |||
|---|---|---|---|
| Quadrant | BADHDUFLAG | Total packets | Discarded packets |
| A | 0 | 340 | 0 |
| B | 0 | 340 | 0 |
| C | 0 | 340 | 0 |
| D | 0 | 340 | 0 |
| Quadrant | Total seconds | Saturated seconds | Saturation percentage |
|---|---|---|---|
| A | 16778 | 459 | 2.735725% |
| B | 16778 | 168 | 1.001311% |
| C | 16778 | 87 | 0.518536% |
| D | 16778 | 338 | 2.014543% |
Noise dominated data is calculated using 1-second bins in cleaned event files. If a bin has >2000 counts, and if more than 50% of those come from <1% of pixels, then it is considered to be noise-dominated and hence unusable.
| Quadrant | # 1 sec bins | Bins with >0 counts | Bins with >2000 counts | High rate bins dominated by noise | Noise dominated (total time) | Noise dominated (detector-on time) | Marked lightcurve |
|---|---|---|---|---|---|---|---|
| A | 18753 | 16782 | 140 | 140 | 0.75% | 0.83% |  |
| B | 18753 | 16782 | 20 | 20 | 0.11% | 0.12% | 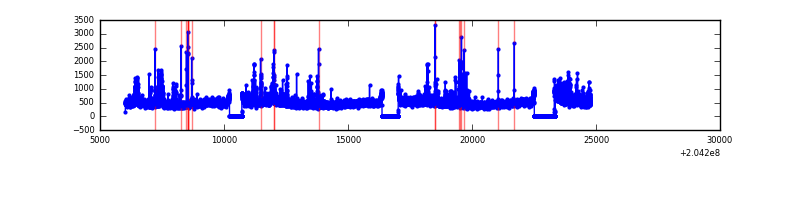 |
| C | 18753 | 16782 | 1 | 1 | 0.01% | 0.01% |  |
| D | 18753 | 16782 | 193 | 193 | 1.03% | 1.15% | 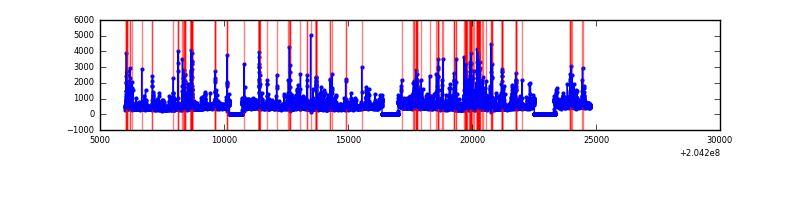 |
Top three noisy pixels from each quadrant. If the there are fewer than three noisy pixels in the level2.evt file, extra rows are filled as -1
| Pixel properties | Quadrant properties | ||||||
|---|---|---|---|---|---|---|---|
| Quadrant | DetID | PixID | Counts | Sigma | Mean | Median | Sigma |
| A | 4 | 48 | 3976738 | 10137.13 | 1917 | 1877 | 392.1 |
| A | 0 | 118 | 603206 | 1533.58 | 1917 | 1877 | 392.1 |
| A | 13 | 251 | 571123 | 1451.75 | 1917 | 1877 | 392.1 |
| B | 15 | 204 | 454820 | 1202.5 | 1944 | 1895 | 376.7 |
| B | 4 | 81 | 192568 | 506.23 | 1944 | 1895 | 376.7 |
| B | 10 | 16 | 176887 | 464.6 | 1944 | 1895 | 376.7 |
| C | 10 | 65 | 80320 | 181.76 | 1858 | 1862 | 431.7 |
| C | 13 | 61 | 15781 | 32.25 | 1858 | 1862 | 431.7 |
| C | 14 | 67 | 10388 | 19.75 | 1858 | 1862 | 431.7 |
| D | 2 | 232 | 665303 | 1480.24 | 1848 | 1794 | 448.2 |
| D | 2 | 63 | 641733 | 1427.66 | 1848 | 1794 | 448.2 |
| D | 4 | 95 | 153470 | 338.38 | 1848 | 1794 | 448.2 |
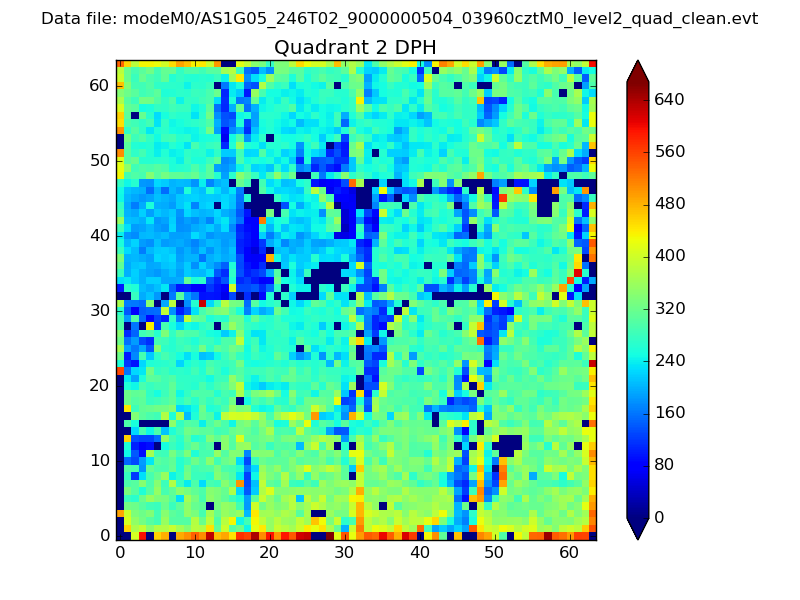
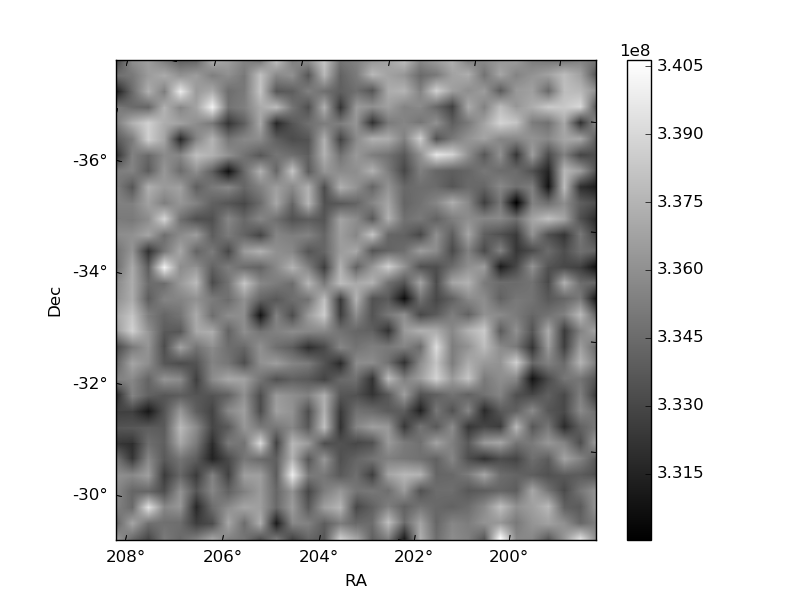
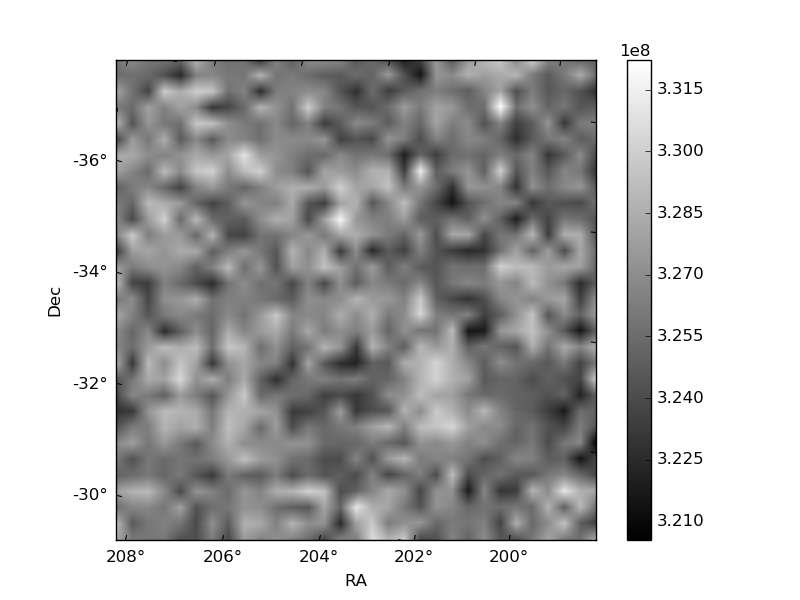
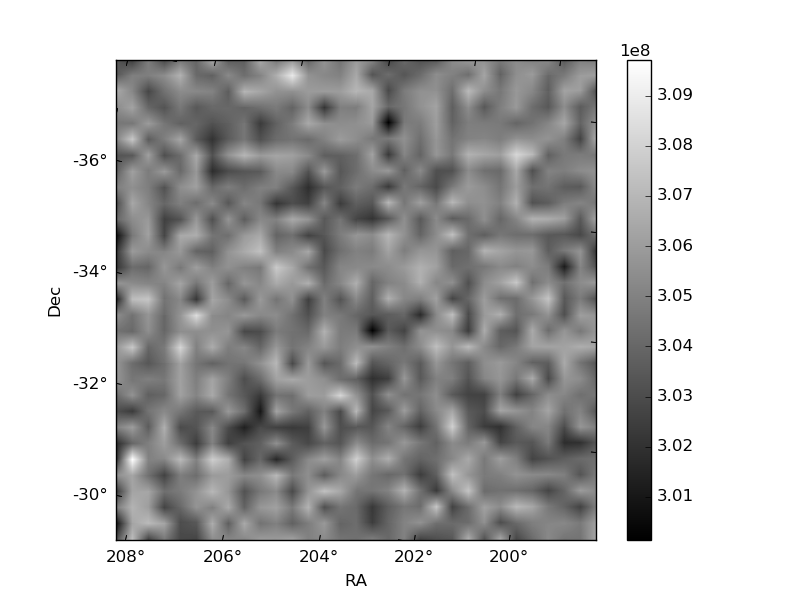
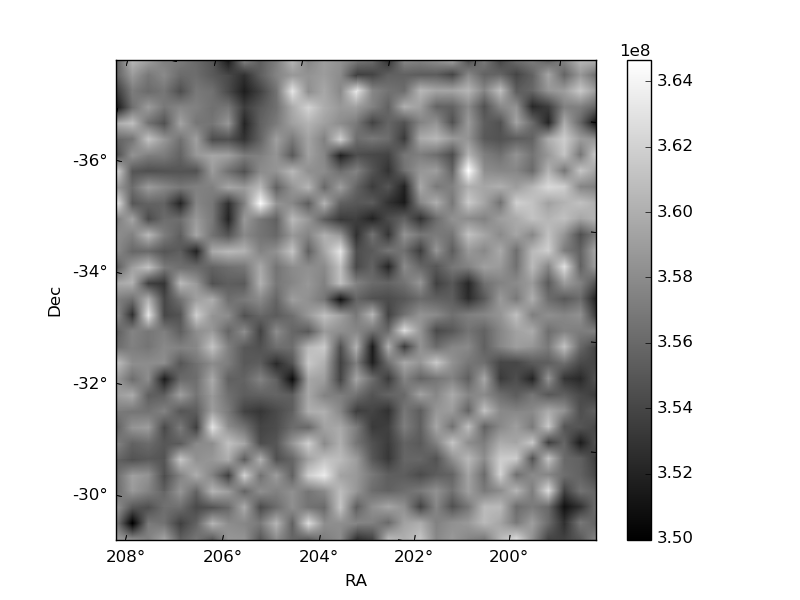
Histogram calculated using DETX and DETY for each event in the final _common_clean file
| Quadrant A | 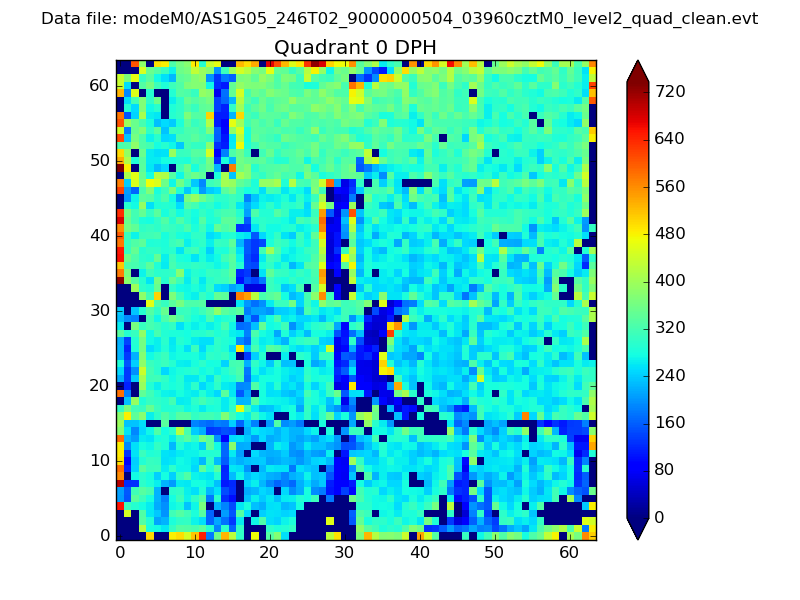 |
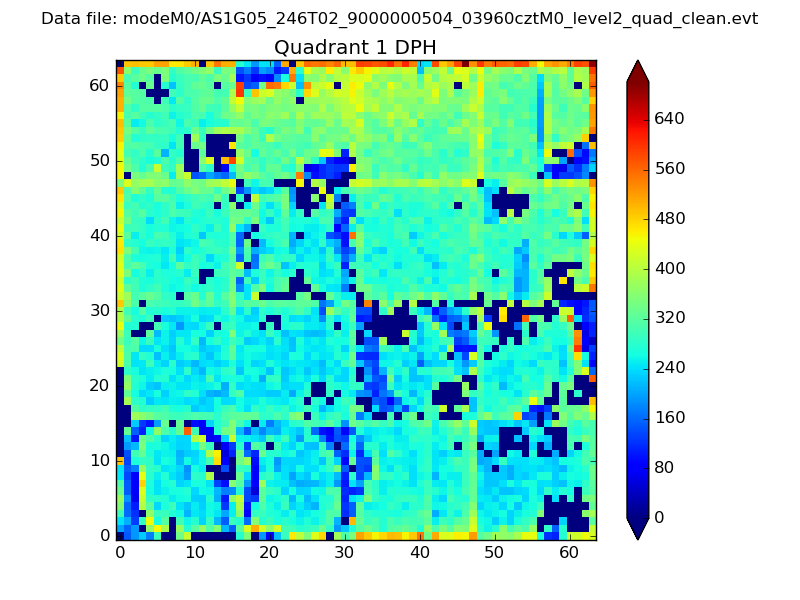 |
Quadrant B |
|---|---|---|---|
| Quadrant D | 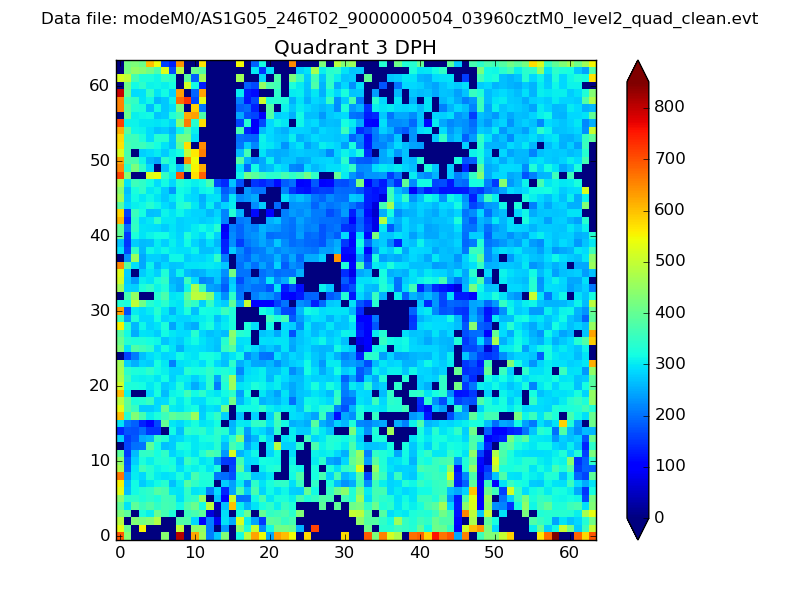 |
 |
Quadrant C |
| Plot type | Count rate plots | Images |
|---|---|---|
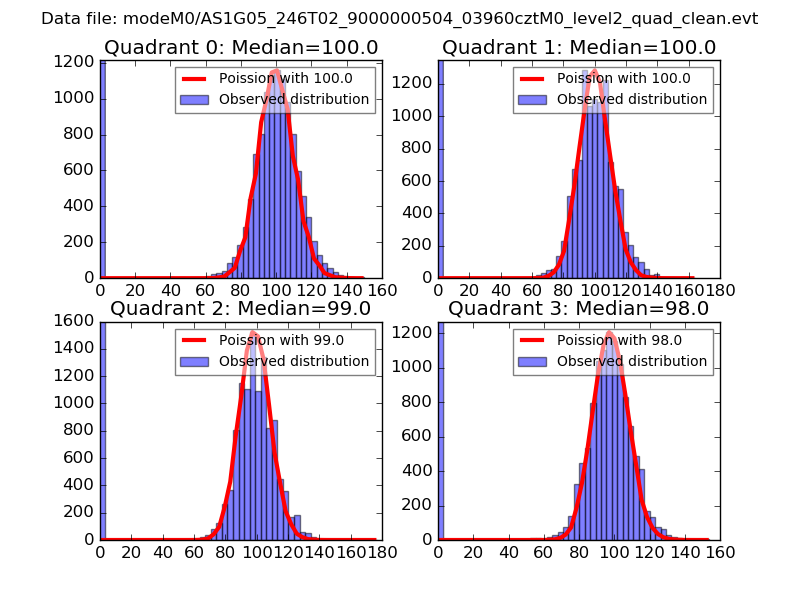
| Comparison with Poisson distribution Blue bars denote a histogram of data divided into 1 sec bins. Red curve is a Poisson curve with rate = median count rate of data. |
 |
 |
| Quadrant-wise count rates Data is divided into 100 sec bins |
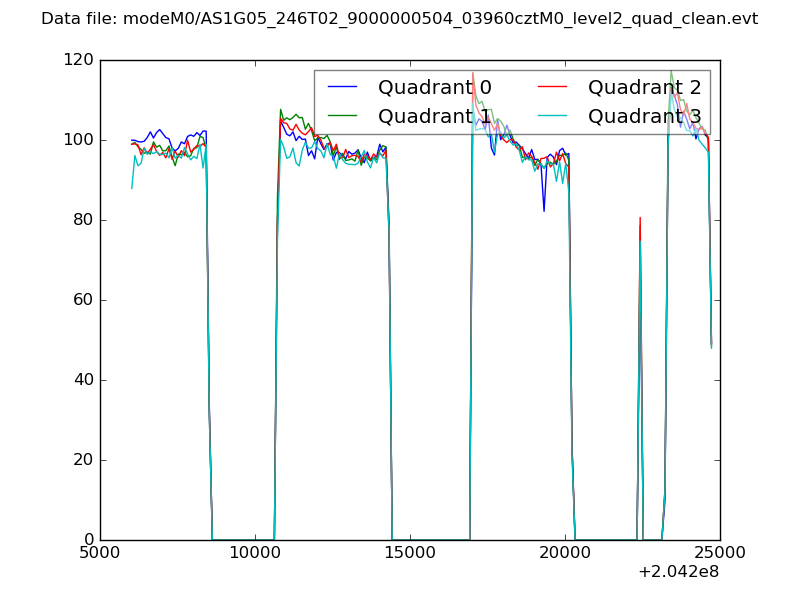 |
|
| Module-wise count rates for Quadrant A Data is divided into 100 sec bins |
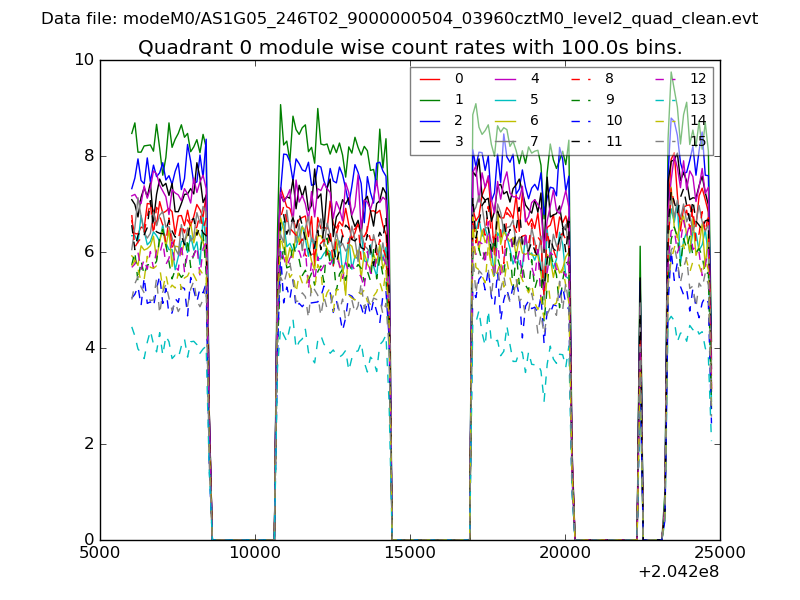 |
 |
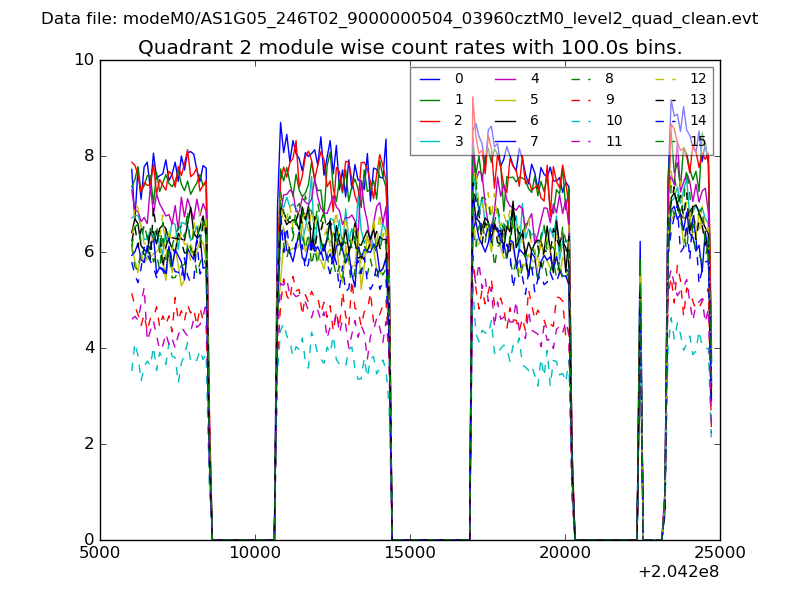
| Module-wise count rates for Quadrant B Data is divided into 100 sec bins |
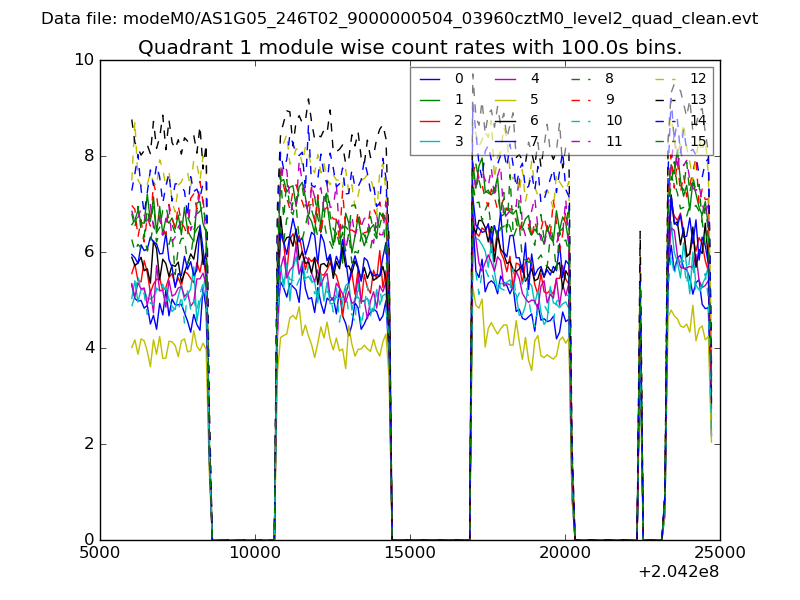 |
 |
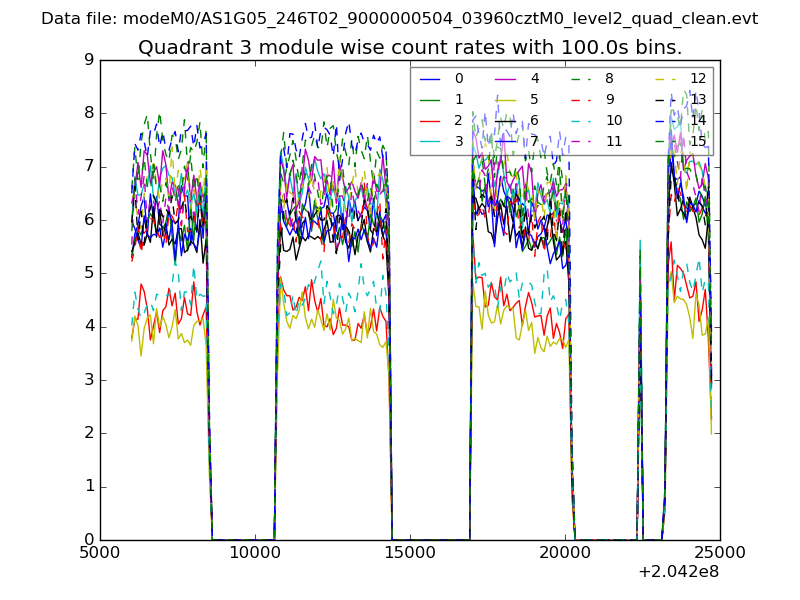
| Module-wise count rates for Quadrant C Data is divided into 100 sec bins |
 |
 |
| Module-wise count rates for Quadrant D Data is divided into 100 sec bins |
 |
 |
| Parameter | Plot |
|---|---|
| CZT HV Monitor | 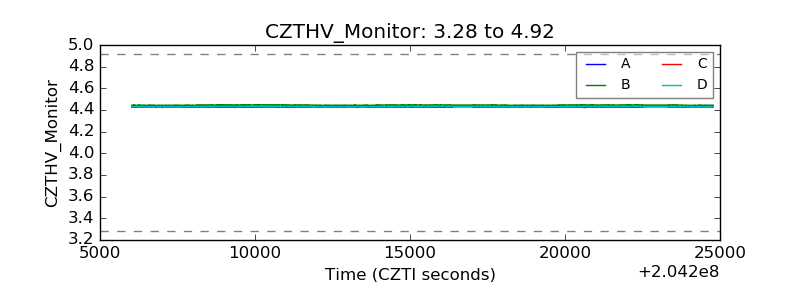 |
| D_VDD | 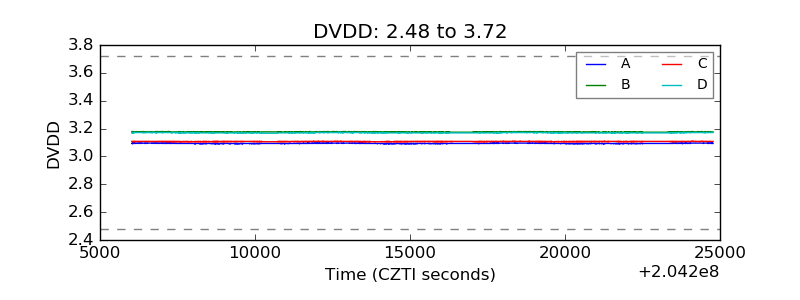 |
| Temperature 1 | 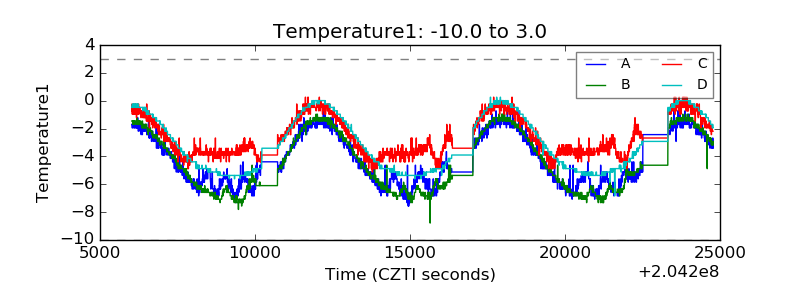 |
| Veto HV Monitor | 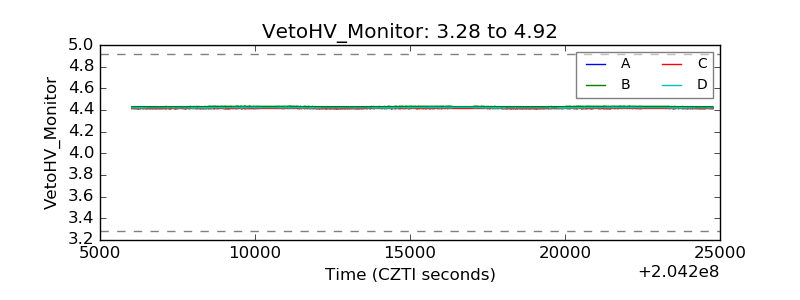 |
| Veto LLD | 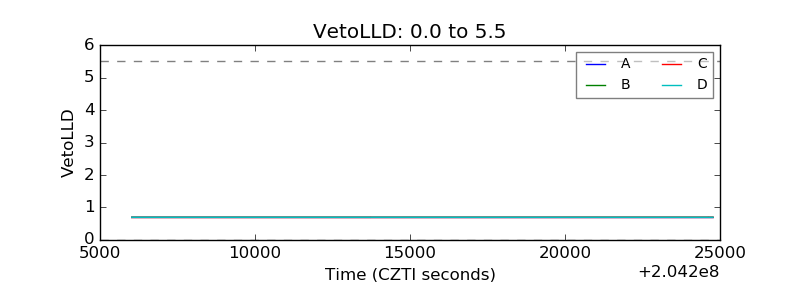 |
| Alpha Counter | 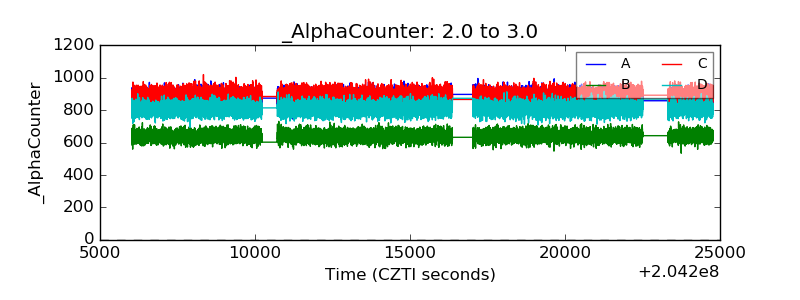 |
| _CPM_Rate | 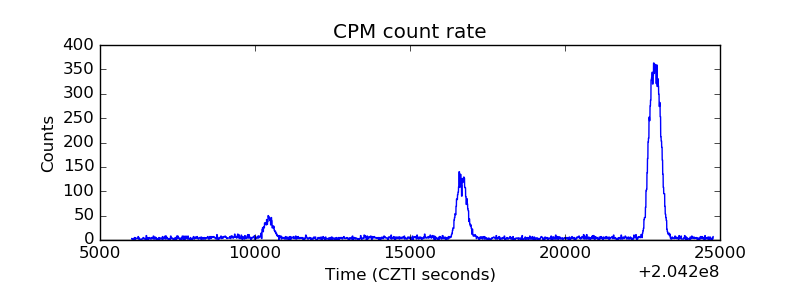 |
| CZT Counter | 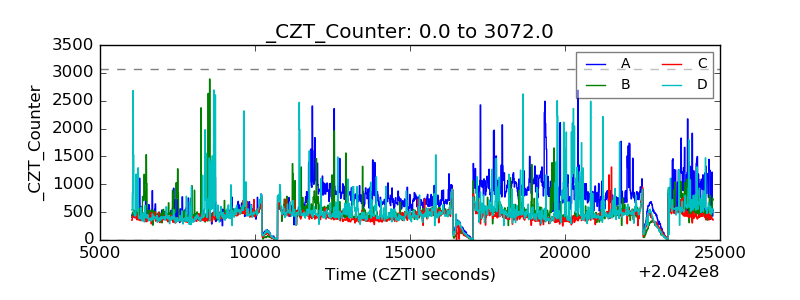 |
| +2.5 Volts monitor |  |
| +5 Volts monitor |  |
| _ROLL_ROT | 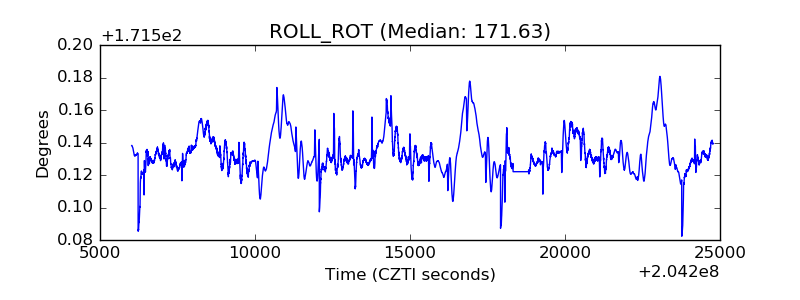 |
| _Roll_DEC | 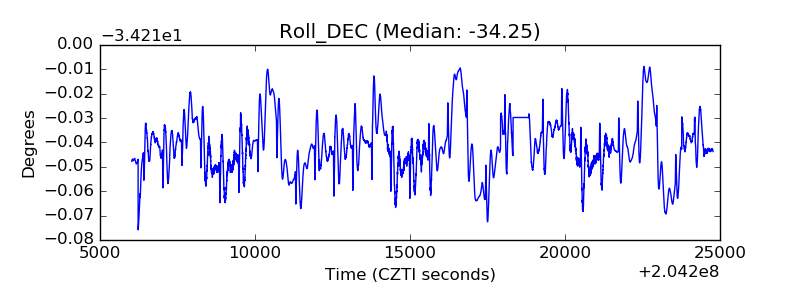 |
| _Roll_RA | 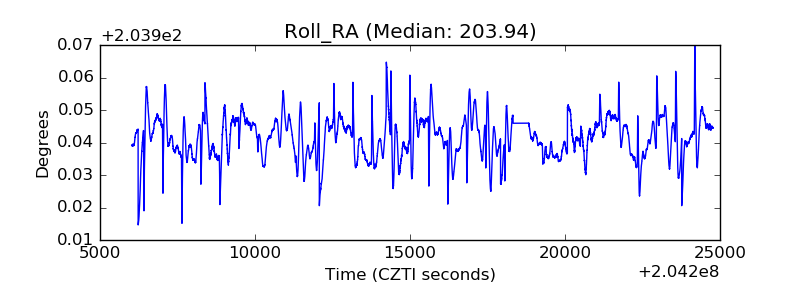 |
| Veto Counter | 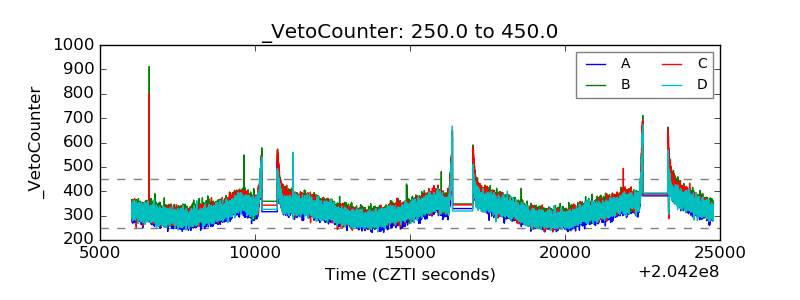 |