| Param | Original file | Final file |
|---|---|---|
| Filename | modeM0/AS1G05_246T02_9000000504_03961cztM0_level2.evt | modeM0/AS1G05_246T02_9000000504_03961cztM0_level2_quad_clean.evt |
| Size (bytes) | 462,254,400 | 51,094,080 |
| Size | 440.8 MB | 48.7 MB |
| Events in quadrant A | 4,235,868 | 297,984 |
| Events in quadrant B | 2,864,440 | 298,361 |
| Events in quadrant C | 2,200,561 | 299,046 |
| Events in quadrant D | 4,349,909 | 290,942 |
| Mode M0 | |||
|---|---|---|---|
| Quadrant | BADHDUFLAG | Total packets | Discarded packets |
| A | 0 | 16157 | 0 |
| B | 0 | 11916 | 0 |
| C | 0 | 10376 | 0 |
| D | 0 | 16287 | 0 |
| Mode SS | |||
|---|---|---|---|
| Quadrant | BADHDUFLAG | Total packets | Discarded packets |
| A | 0 | 104 | 0 |
| B | 0 | 104 | 0 |
| C | 0 | 104 | 0 |
| D | 0 | 104 | 0 |
| Quadrant | Total seconds | Saturated seconds | Saturation percentage |
|---|---|---|---|
| A | 5138 | 106 | 2.063060% |
| B | 5138 | 55 | 1.070455% |
| C | 5138 | 1 | 0.019463% |
| D | 5138 | 460 | 8.952900% |
Noise dominated data is calculated using 1-second bins in cleaned event files. If a bin has >2000 counts, and if more than 50% of those come from <1% of pixels, then it is considered to be noise-dominated and hence unusable.
| Quadrant | # 1 sec bins | Bins with >0 counts | Bins with >2000 counts | High rate bins dominated by noise | Noise dominated (total time) | Noise dominated (detector-on time) | Marked lightcurve |
|---|---|---|---|---|---|---|---|
| A | 5138 | 5138 | 53 | 53 | 1.03% | 1.03% | 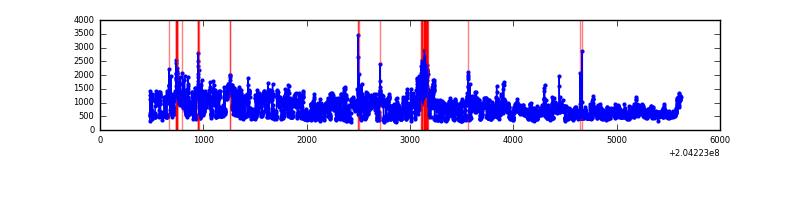 |
| B | 5138 | 5138 | 32 | 32 | 0.62% | 0.62% | 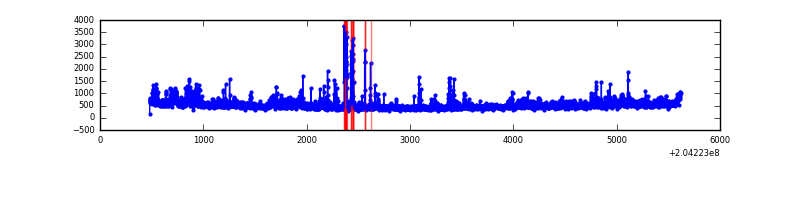 |
| C | 5138 | 5138 | 0 | 0 | 0.00% | 0.00% | 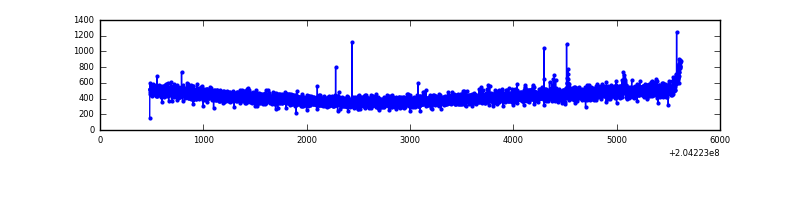 |
| D | 5138 | 5138 | 367 | 367 | 7.14% | 7.14% | 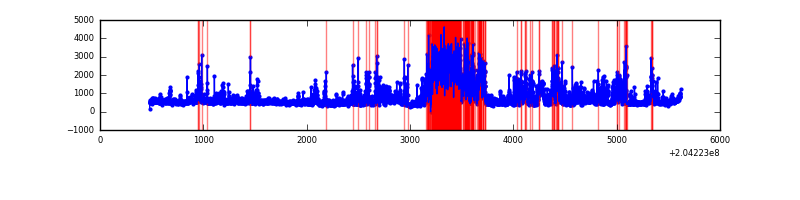 |
Top three noisy pixels from each quadrant. If the there are fewer than three noisy pixels in the level2.evt file, extra rows are filled as -1
| Pixel properties | Quadrant properties | ||||||
|---|---|---|---|---|---|---|---|
| Quadrant | DetID | PixID | Counts | Sigma | Mean | Median | Sigma |
| A | 4 | 48 | 1377530 | 11419.27 | 578 | 565 | 120.6 |
| A | 13 | 251 | 464603 | 3848.3 | 578 | 565 | 120.6 |
| A | 0 | 118 | 90477 | 745.65 | 578 | 565 | 120.6 |
| B | 15 | 204 | 182464 | 1596.34 | 585 | 572 | 113.9 |
| B | 10 | 16 | 142595 | 1246.43 | 585 | 572 | 113.9 |
| B | 4 | 81 | 119749 | 1045.93 | 585 | 572 | 113.9 |
| C | 10 | 65 | 15157 | 110.49 | 559 | 561 | 132.1 |
| C | 13 | 61 | 4759 | 31.78 | 559 | 561 | 132.1 |
| C | 12 | 4 | 1395 | 6.31 | 559 | 561 | 132.1 |
| D | 2 | 232 | 1027097 | 7766.92 | 534 | 519 | 132.2 |
| D | 2 | 63 | 967043 | 7312.56 | 534 | 519 | 132.2 |
| D | 10 | 186 | 134008 | 1009.96 | 534 | 519 | 132.2 |
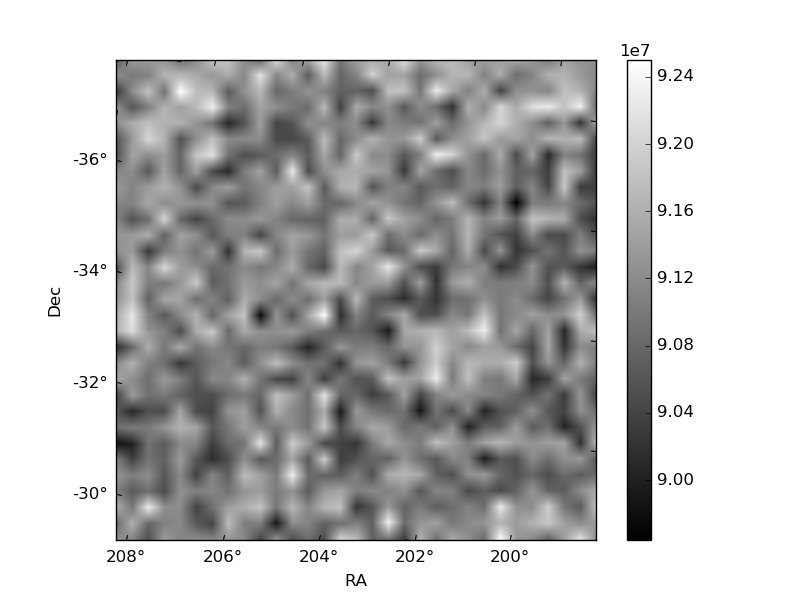
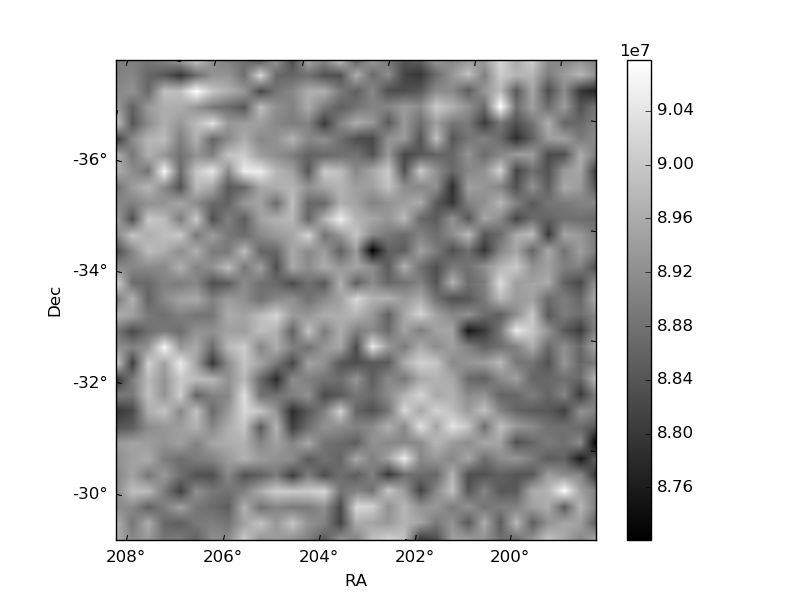
Histogram calculated using DETX and DETY for each event in the final _common_clean file
| Quadrant A | 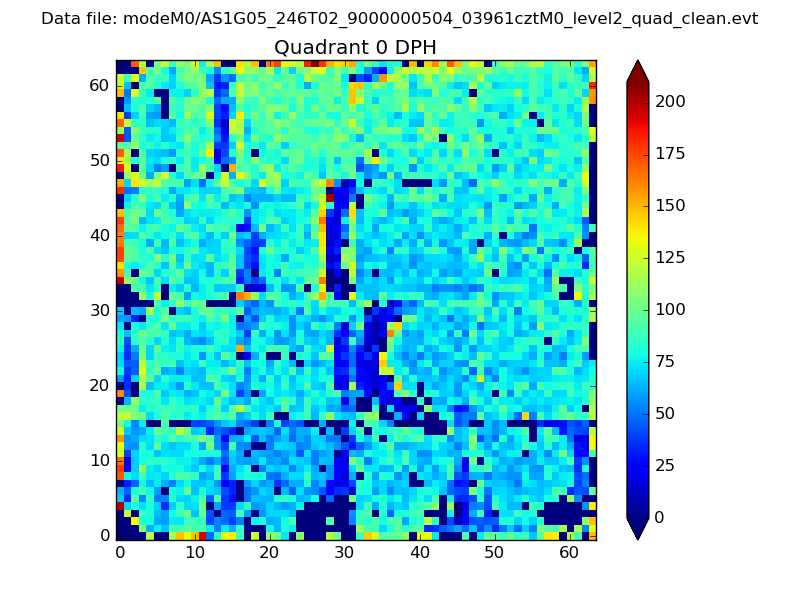 |
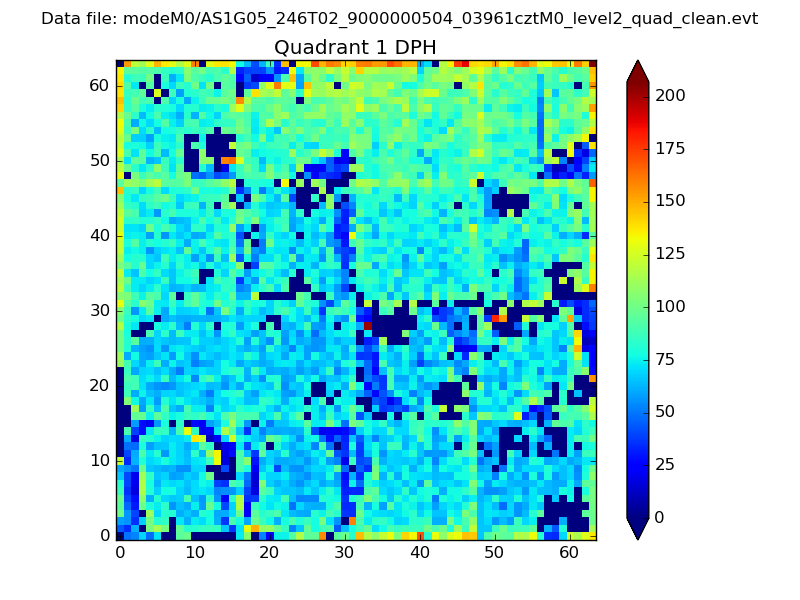 |
Quadrant B |
|---|---|---|---|
| Quadrant D | 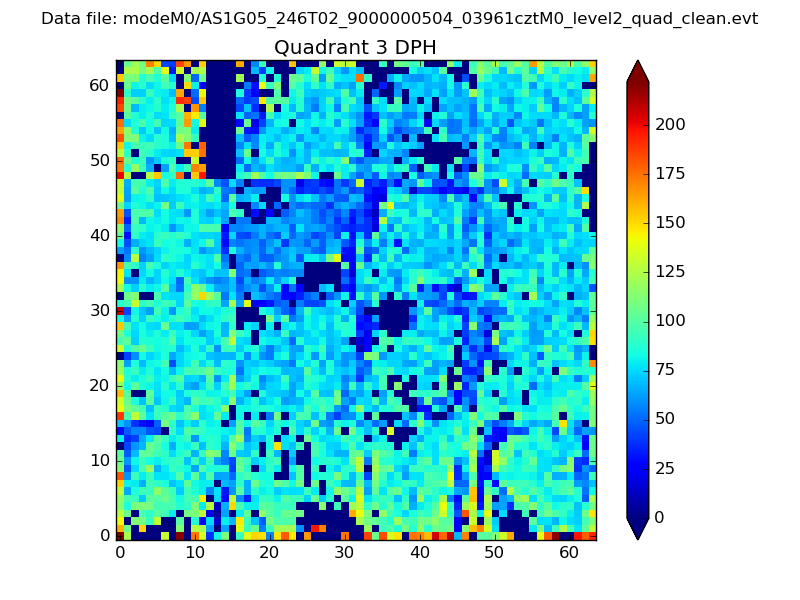 |
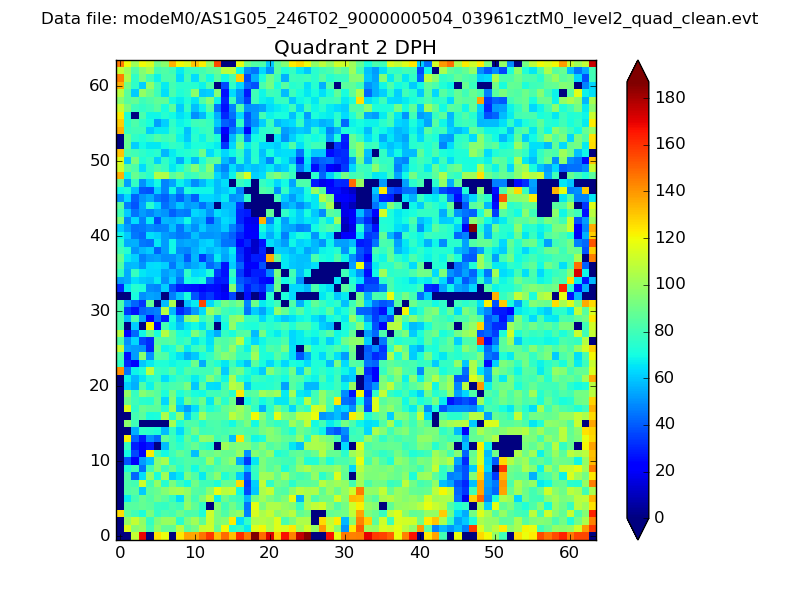 |
Quadrant C |
| Plot type | Count rate plots | Images |
|---|---|---|
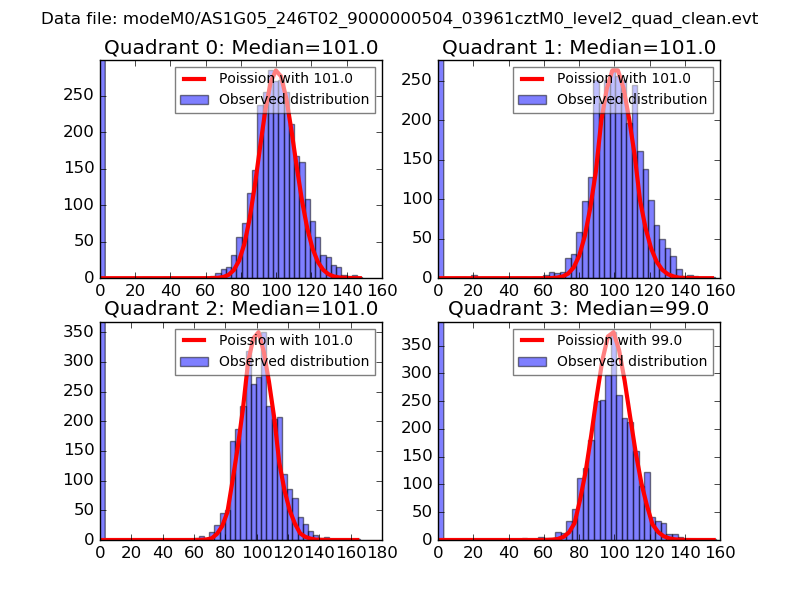
| Comparison with Poisson distribution Blue bars denote a histogram of data divided into 1 sec bins. Red curve is a Poisson curve with rate = median count rate of data. |
 |
 |
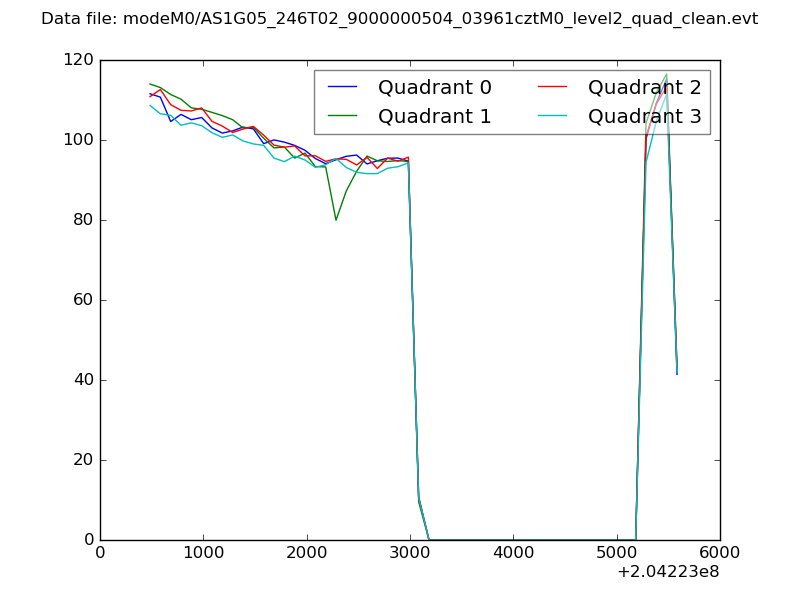
| Quadrant-wise count rates Data is divided into 100 sec bins |
 |
|
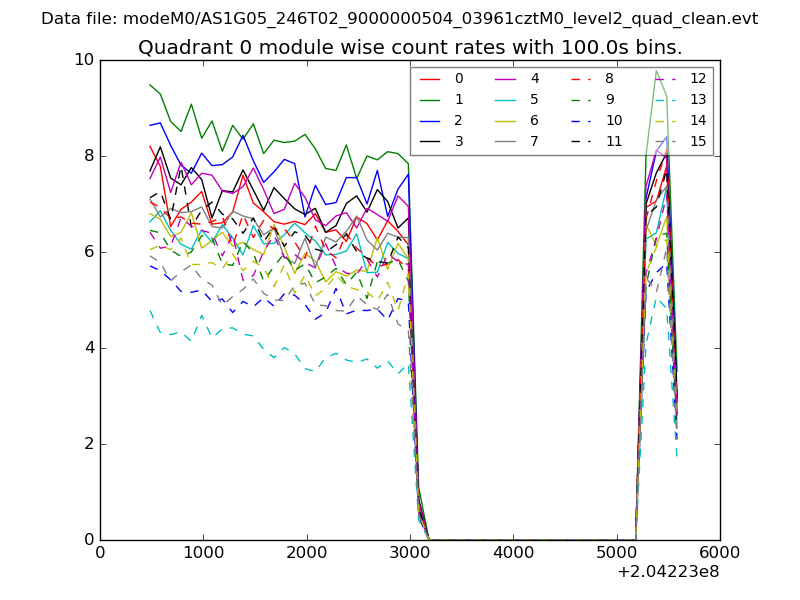
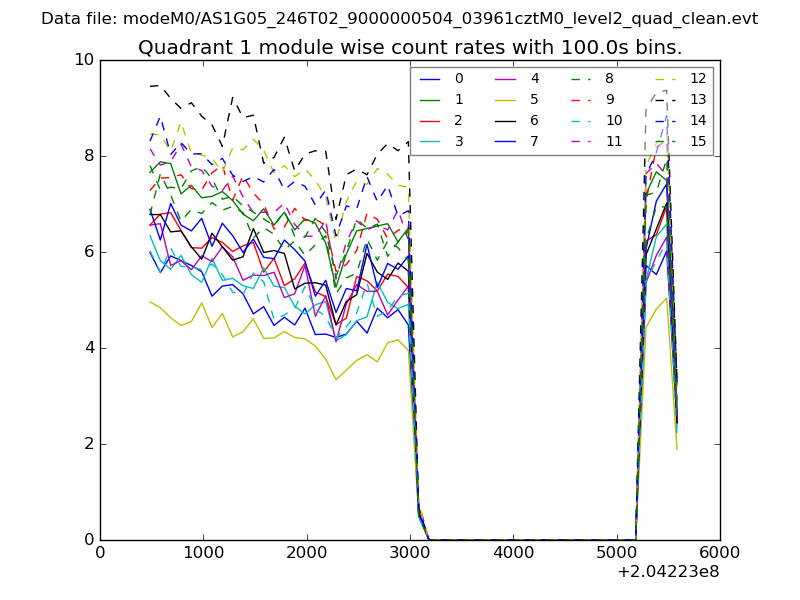
| Module-wise count rates for Quadrant A Data is divided into 100 sec bins |
 |
 |
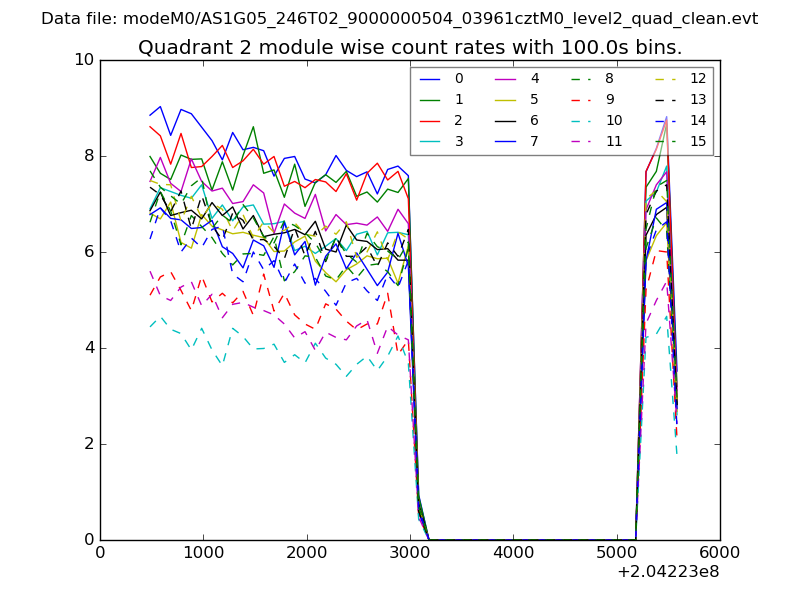
| Module-wise count rates for Quadrant B Data is divided into 100 sec bins |
 |
 |
| Module-wise count rates for Quadrant C Data is divided into 100 sec bins |
 |
 |
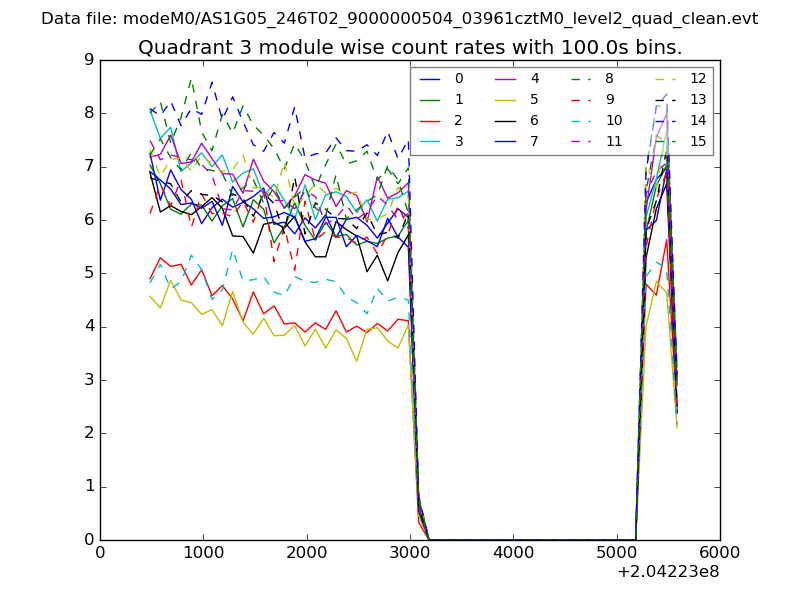
| Module-wise count rates for Quadrant D Data is divided into 100 sec bins |
 |
 |
| Parameter | Plot |
|---|---|
| CZT HV Monitor | 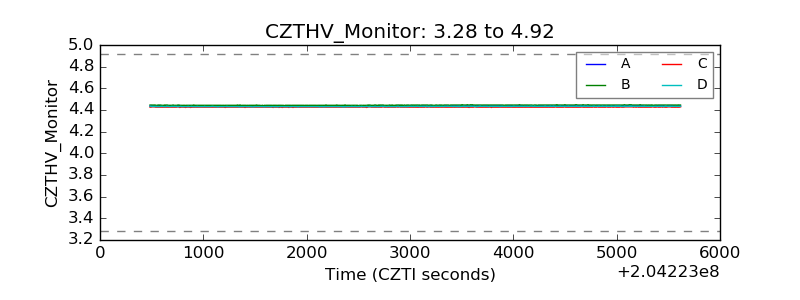 |
| D_VDD | 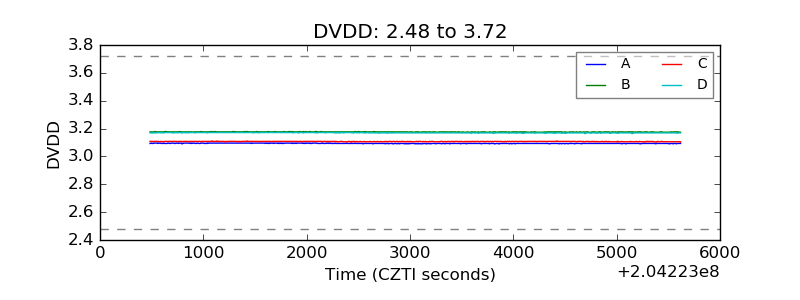 |
| Temperature 1 | 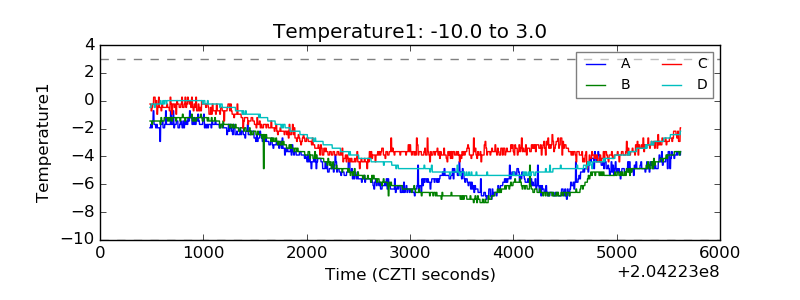 |
| Veto HV Monitor | 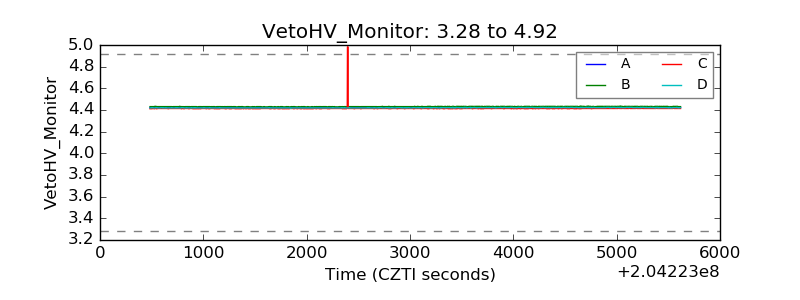 |
| Veto LLD | 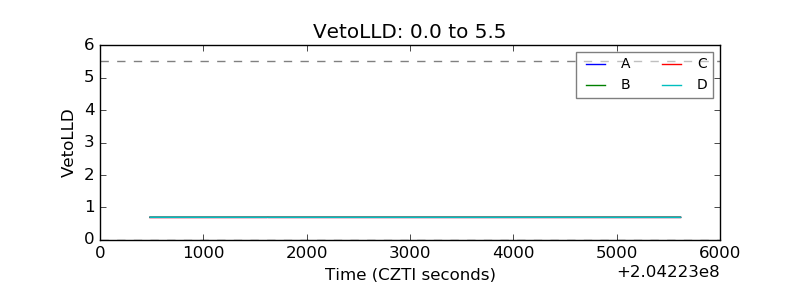 |
| Alpha Counter | 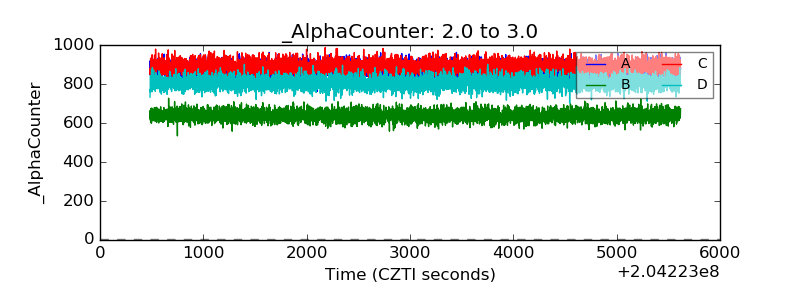 |
| _CPM_Rate | 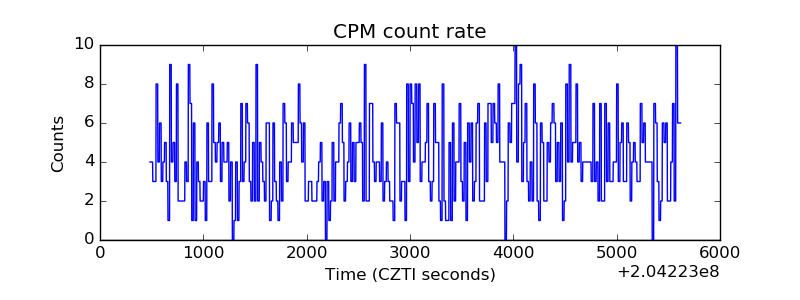 |
| CZT Counter | 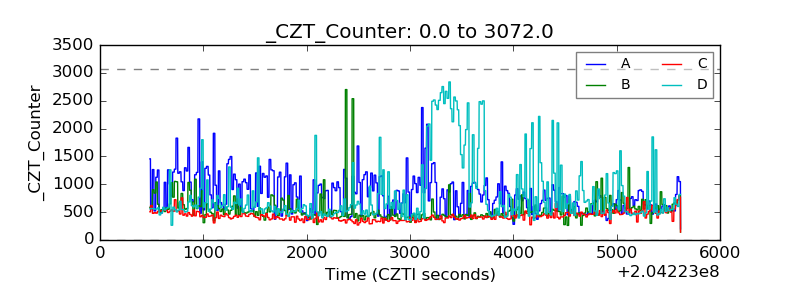 |
| +2.5 Volts monitor |  |
| +5 Volts monitor |  |
| _ROLL_ROT | 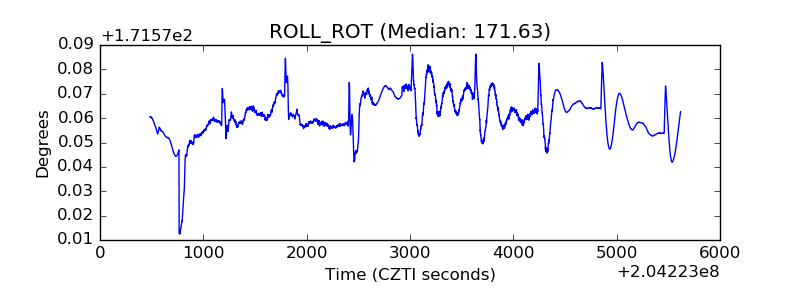 |
| _Roll_DEC | 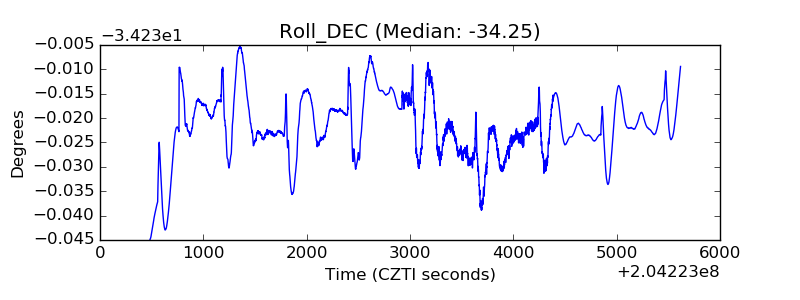 |
| _Roll_RA | 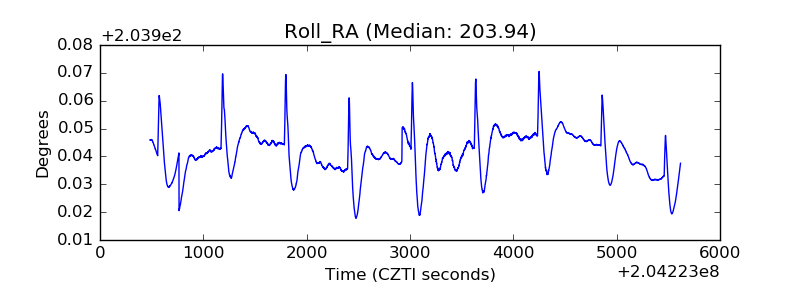 |
| Veto Counter | 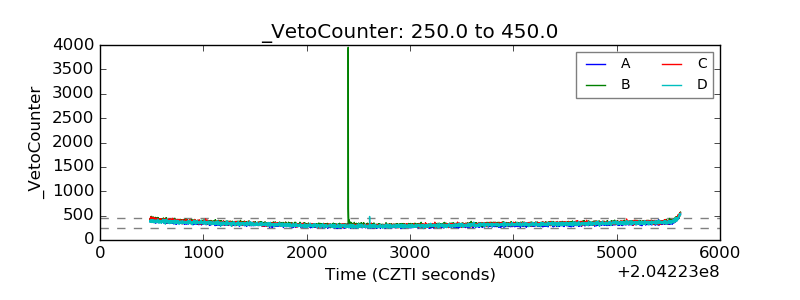 |