| Param | Original file | Final file |
|---|---|---|
| Filename | modeM0/AS1G05_213T01_9000000506cztM0_level2.fits | modeM0/AS1G05_213T01_9000000506cztM0_level2_quad_clean.evt |
| Size (bytes) | 57,306,240 | 50,613,120 |
| Size | 54.7 MB | 48.3 MB |
| Events in quadrant A | 336,784 | 283,424 |
| Events in quadrant B | 335,132 | 286,080 |
| Events in quadrant C | 335,388 | 272,230 |
| Events in quadrant D | 288,026 | 249,753 |
| Mode SS | |||
|---|---|---|---|
| Quadrant | BADHDUFLAG | Total packets | Discarded packets |
| A | 0 | 128 | 0 |
| B | 0 | 128 | 0 |
| C | 0 | 128 | 0 |
| D | 0 | 128 | 0 |
| Mode M0 | |||
|---|---|---|---|
| Quadrant | BADHDUFLAG | Total packets | Discarded packets |
| A | 0 | 14811 | 0 |
| B | 0 | 14253 | 0 |
| C | 0 | 12729 | 0 |
| D | 0 | 14071 | 0 |
| Mode M9 | |||
|---|---|---|---|
| Quadrant | BADHDUFLAG | Total packets | Discarded packets |
| A | 0 | 14 | 0 |
| B | 0 | 14 | 0 |
| C | 0 | 14 | 0 |
| D | 0 | 15 | 0 |
| Quadrant | Total seconds | Saturated seconds | Saturation percentage |
|---|---|---|---|
| A | 6310 | 210 | 3.328051% |
| B | 6310 | 21 | 0.332805% |
| C | 6310 | 4 | 0.063391% |
| D | 6310 | 66 | 1.045959% |
Noise dominated data is calculated using 1-second bins in cleaned event files. If a bin has >2000 counts, and if more than 50% of those come from <1% of pixels, then it is considered to be noise-dominated and hence unusable.
| Quadrant | # 1 sec bins | Bins with >0 counts | Bins with >2000 counts | High rate bins dominated by noise | Noise dominated (total time) | Noise dominated (detector-on time) | Marked lightcurve |
|---|---|---|---|---|---|---|---|
| A | 7459 | 6280 | 0 | 0 | 0.00% | 0.00% |  |
| B | 7459 | 6309 | 0 | 0 | 0.00% | 0.00% |  |
| C | 7459 | 6309 | 0 | 0 | 0.00% | 0.00% |  |
| D | 7459 | 6309 | 0 | 0 | 0.00% | 0.00% | 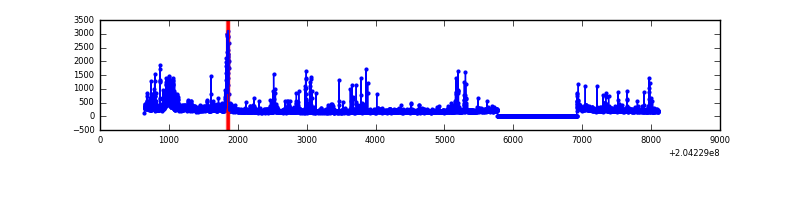 |
Top three noisy pixels from each quadrant. If the there are fewer than three noisy pixels in the level2.evt file, extra rows are filled as -1
| Pixel properties | Quadrant properties | ||||||
|---|---|---|---|---|---|---|---|
| Quadrant | DetID | PixID | Counts | Sigma | Mean | Median | Sigma |
| A | 0 | 29 | 377 | 12.01 | 87 | 82 | 24.6 |
| A | 7 | 110 | 302 | 8.96 | 87 | 82 | 24.6 |
| A | 0 | 28 | 273 | 7.78 | 87 | 82 | 24.6 |
| B | 2 | 9 | 282 | 9.88 | 88 | 84 | 20.0 |
| B | 12 | 226 | 258 | 8.68 | 88 | 84 | 20.0 |
| B | 5 | 128 | 248 | 8.19 | 88 | 84 | 20.0 |
| C | 7 | 111 | 236 | 6.14 | 88 | 82 | 25.1 |
| C | 2 | 17 | 222 | 5.58 | 88 | 82 | 25.1 |
| C | 2 | 191 | 220 | 5.5 | 88 | 82 | 25.1 |
| D | 11 | 82 | 271 | 8.31 | 81 | 74 | 23.7 |
| D | 3 | 14 | 252 | 7.51 | 81 | 74 | 23.7 |
| D | 1 | 19 | 228 | 6.49 | 81 | 74 | 23.7 |
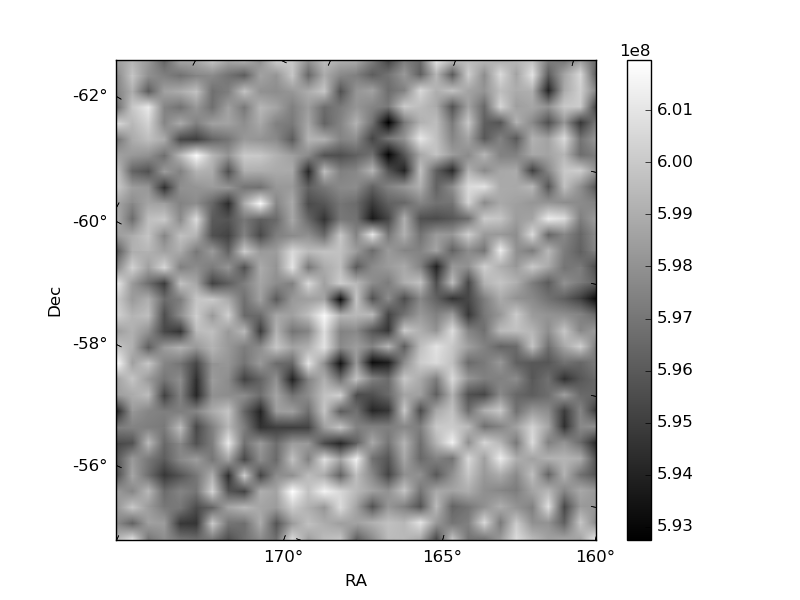
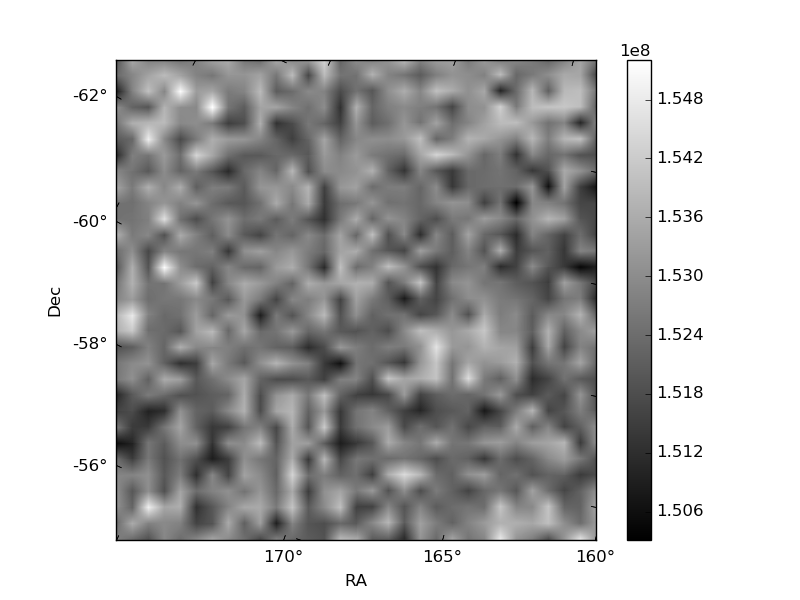
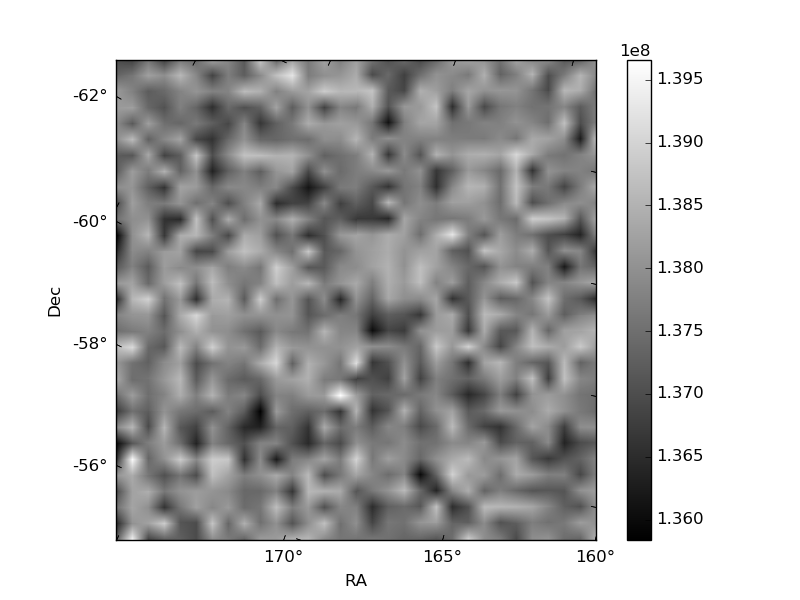
Histogram calculated using DETX and DETY for each event in the final _common_clean file
| Quadrant A |  |
 |
Quadrant B |
|---|---|---|---|
| Quadrant D |  |
 |
Quadrant C |
| Plot type | Count rate plots | Images |
|---|---|---|
| Comparison with Poisson distribution Blue bars denote a histogram of data divided into 1 sec bins. Red curve is a Poisson curve with rate = median count rate of data. |
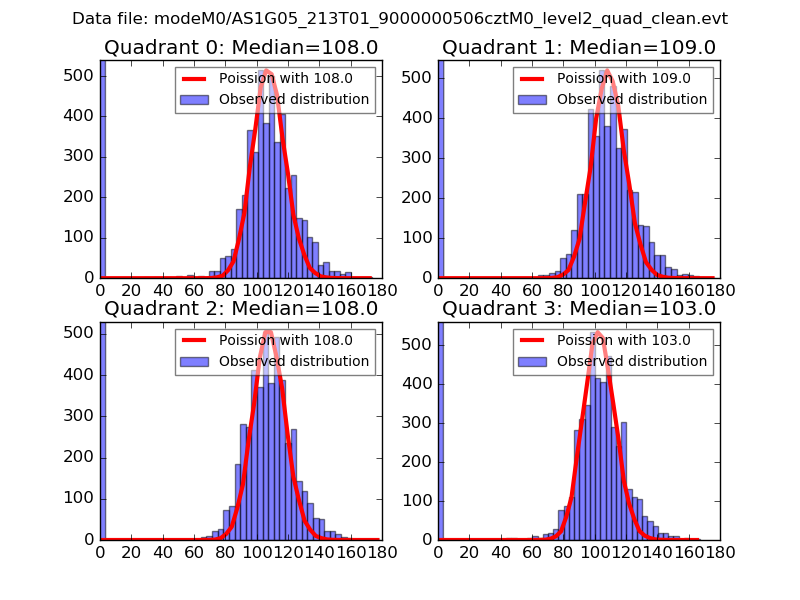 |
 |
| Quadrant-wise count rates Data is divided into 100 sec bins |
 |
|
| Module-wise count rates for Quadrant A Data is divided into 100 sec bins |
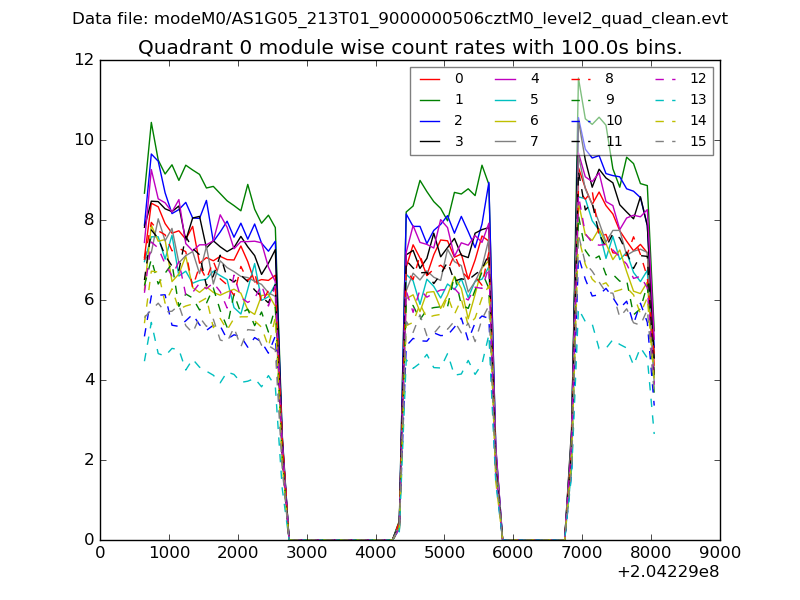 |
 |
| Module-wise count rates for Quadrant B Data is divided into 100 sec bins |
 |
 |
| Module-wise count rates for Quadrant C Data is divided into 100 sec bins |
 |
 |
| Module-wise count rates for Quadrant D Data is divided into 100 sec bins |
 |
 |
| Parameter | Plot |
|---|---|
| CZT HV Monitor |  |
| D_VDD |  |
| Temperature 1 |  |
| Veto HV Monitor |  |
| Veto LLD |  |
| Alpha Counter |  |
| _CPM_Rate | 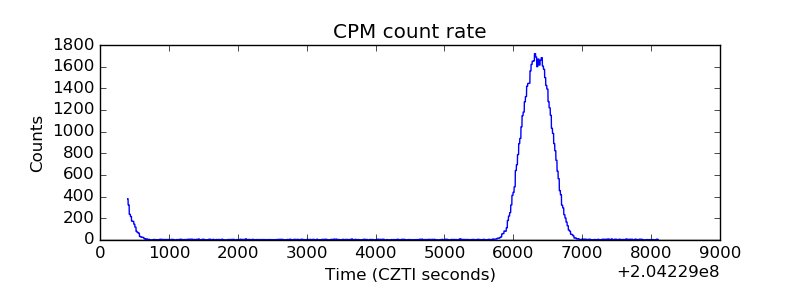 |
| CZT Counter |  |
| +2.5 Volts monitor | 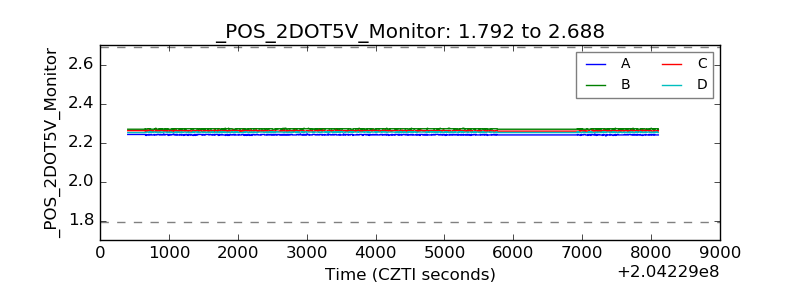 |
| +5 Volts monitor |  |
| _ROLL_ROT |  |
| _Roll_DEC |  |
| _Roll_RA |  |
| Veto Counter |  |